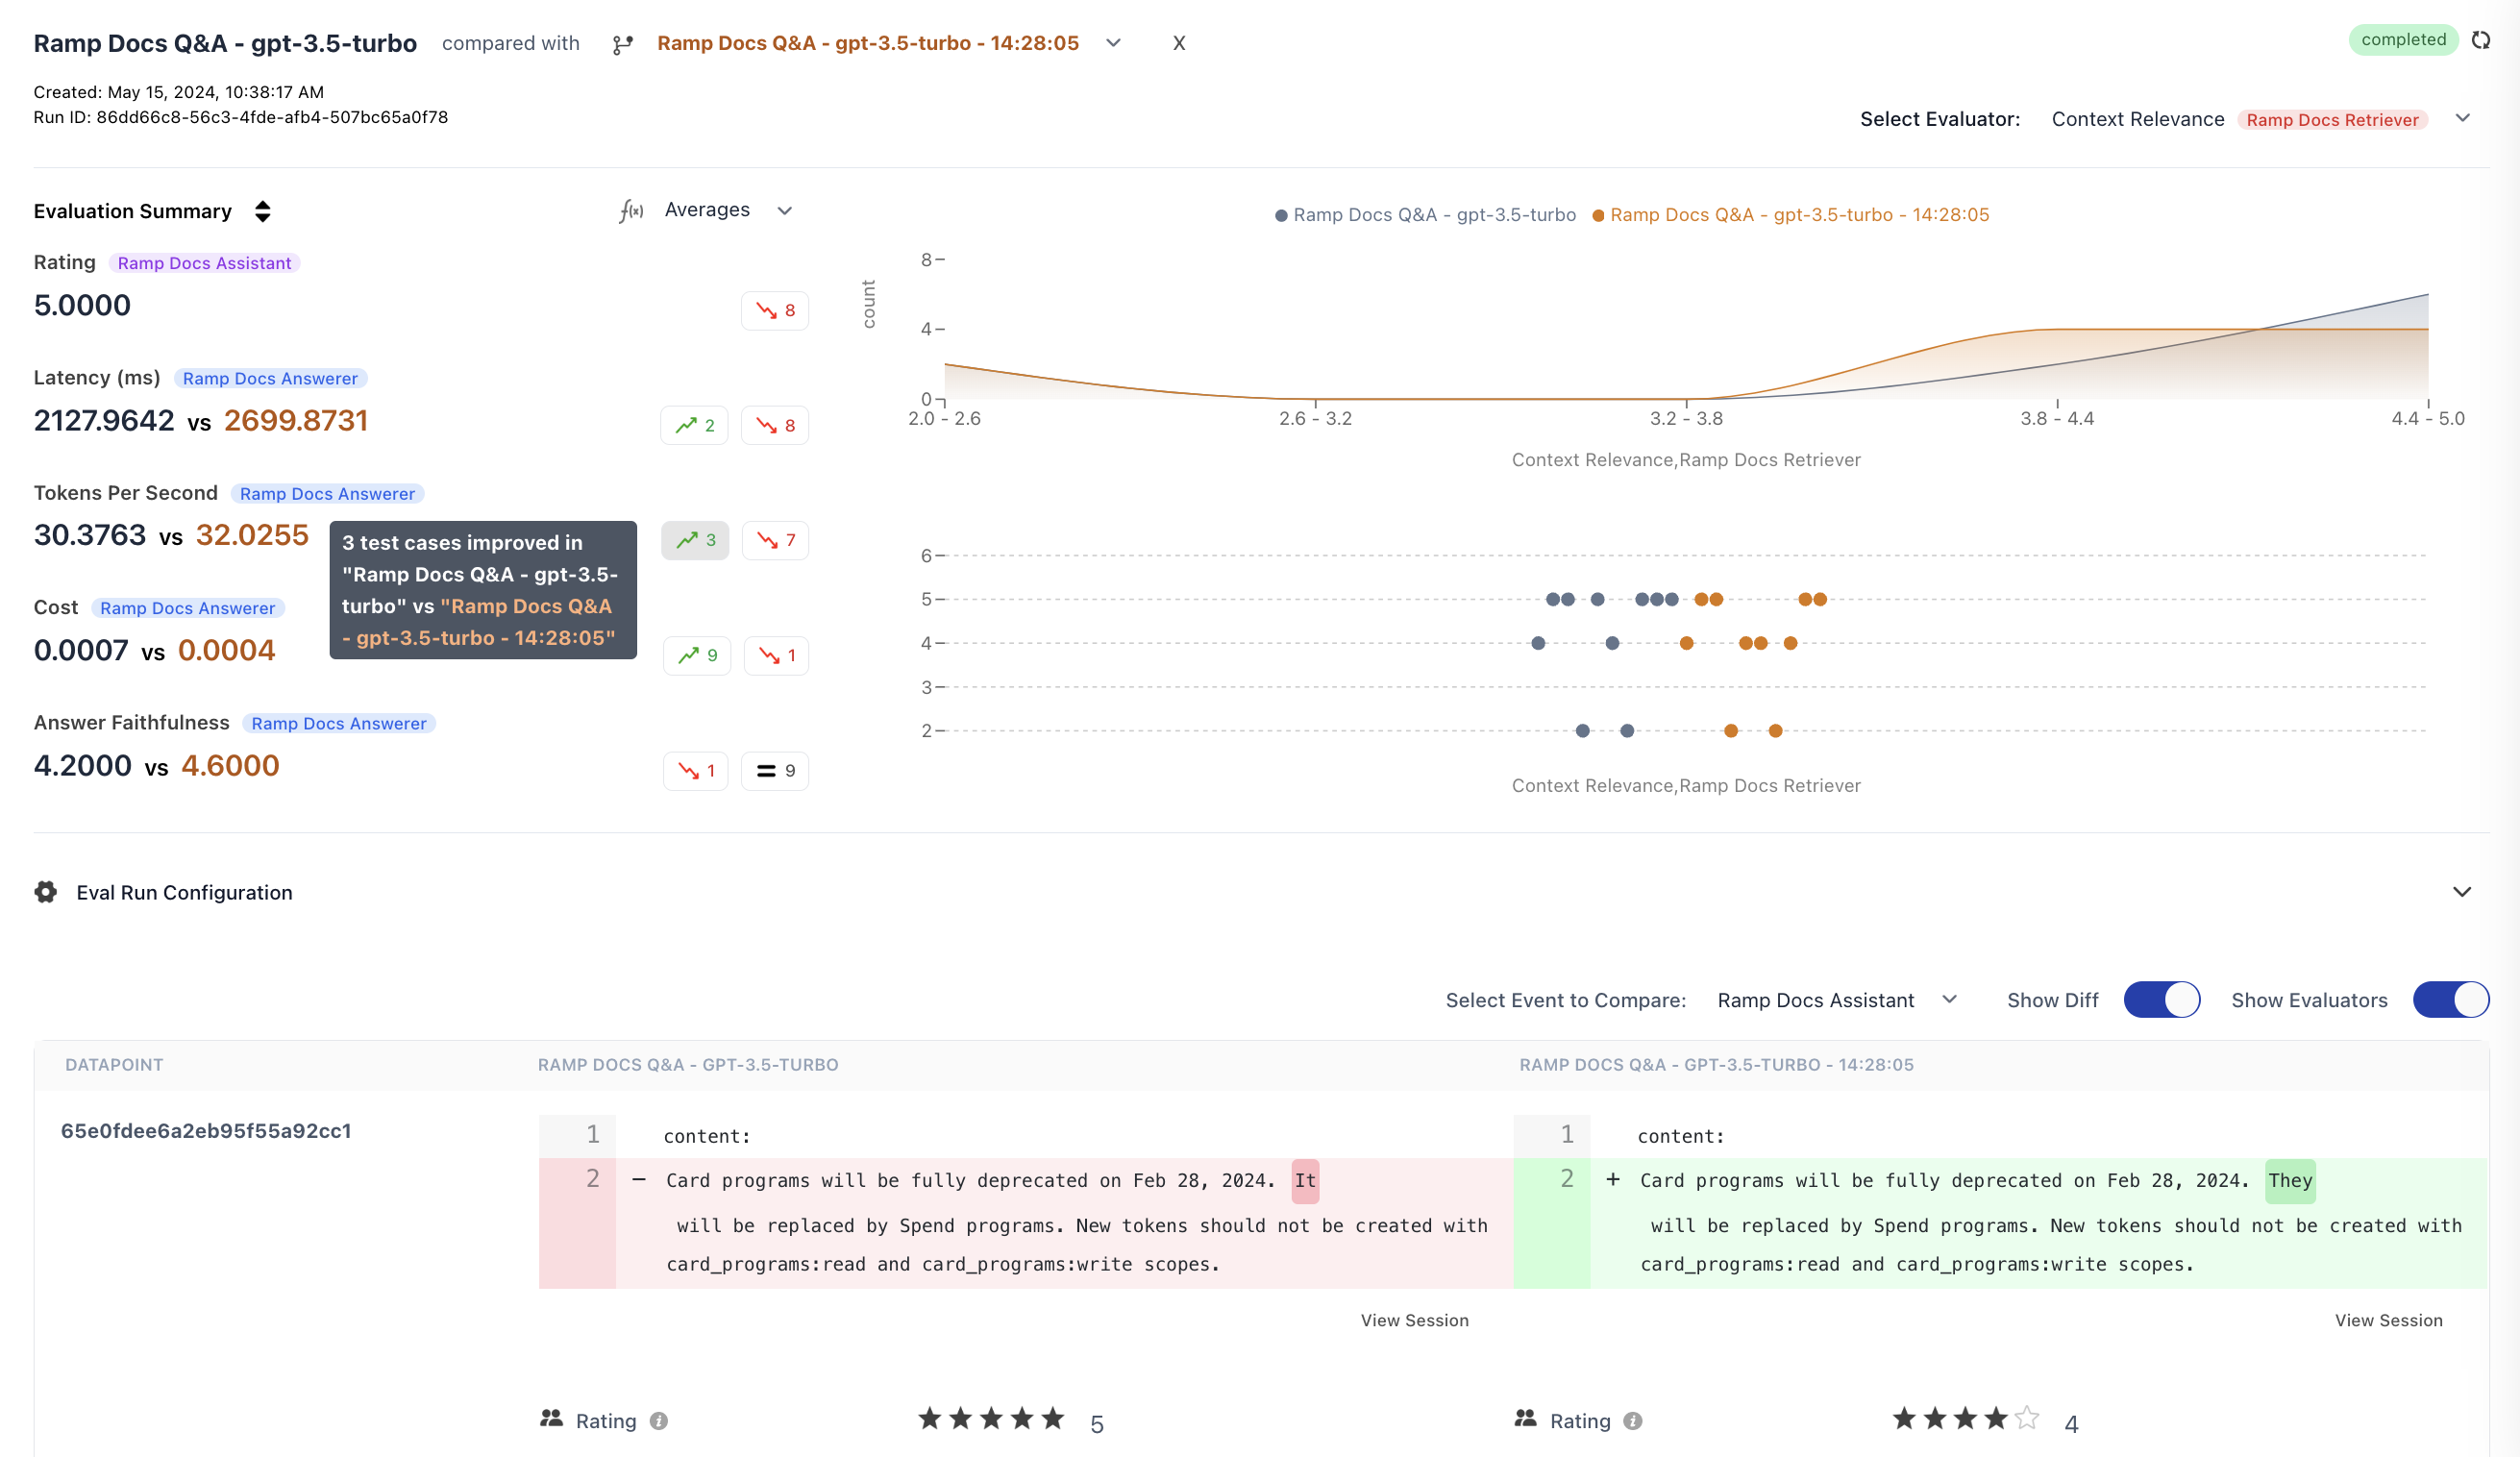
 The comparison view allows you to:
* [step level comparisons](#1-step-level-comparisons)
* [view metric aggregates](#2-aggregated-metrics)
* [find improved/regressed events](#3-improved-regressed-events)
* [compare outputs](#4-output-diff-viewer)
* [analyze metric distribution](#5-metric-distribution)
## Navigating the Comparison View
Let's walk through the key features of the comparison view to help you effectively compare your experiments.
The comparison view allows you to:
* [step level comparisons](#1-step-level-comparisons)
* [view metric aggregates](#2-aggregated-metrics)
* [find improved/regressed events](#3-improved-regressed-events)
* [compare outputs](#4-output-diff-viewer)
* [analyze metric distribution](#5-metric-distribution)
## Navigating the Comparison View
Let's walk through the key features of the comparison view to help you effectively compare your experiments.
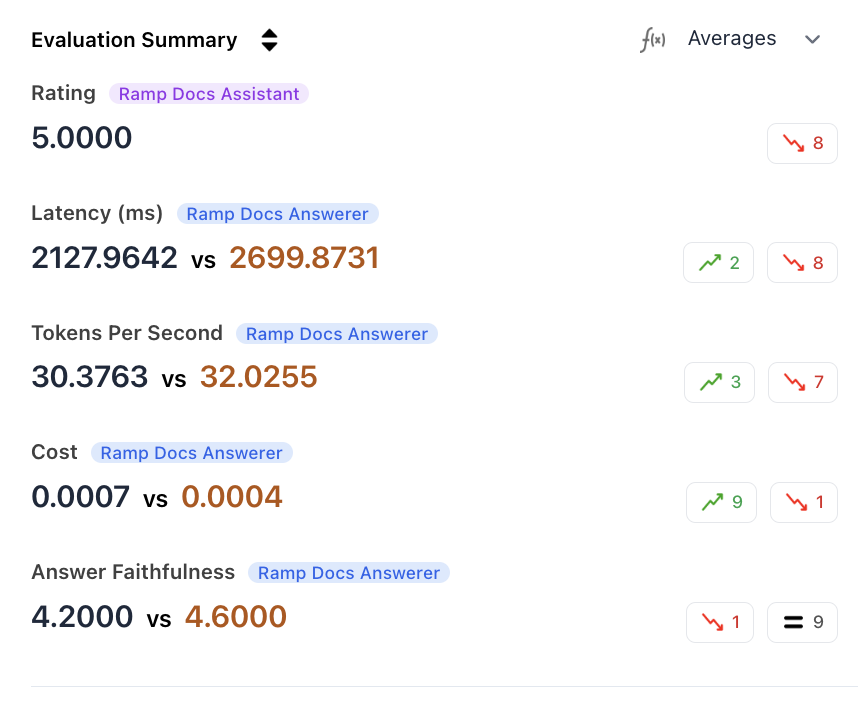 ### 3. Improved/regressed events
Filter for events that have improved or regressed in specific metrics.
Select the metric and operation you want.
### 3. Improved/regressed events
Filter for events that have improved or regressed in specific metrics.
Select the metric and operation you want.
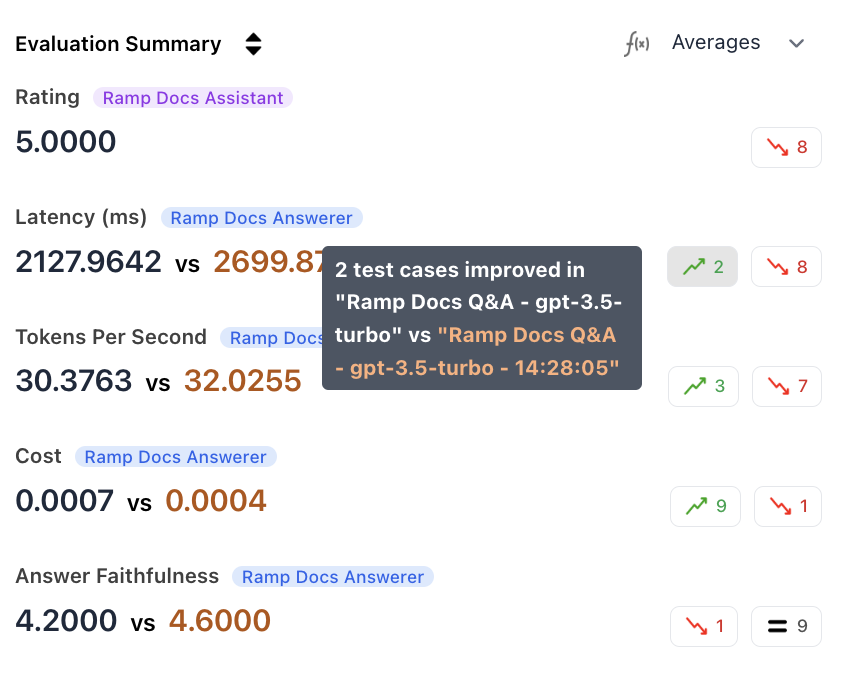 View the corresponding events in the events table.
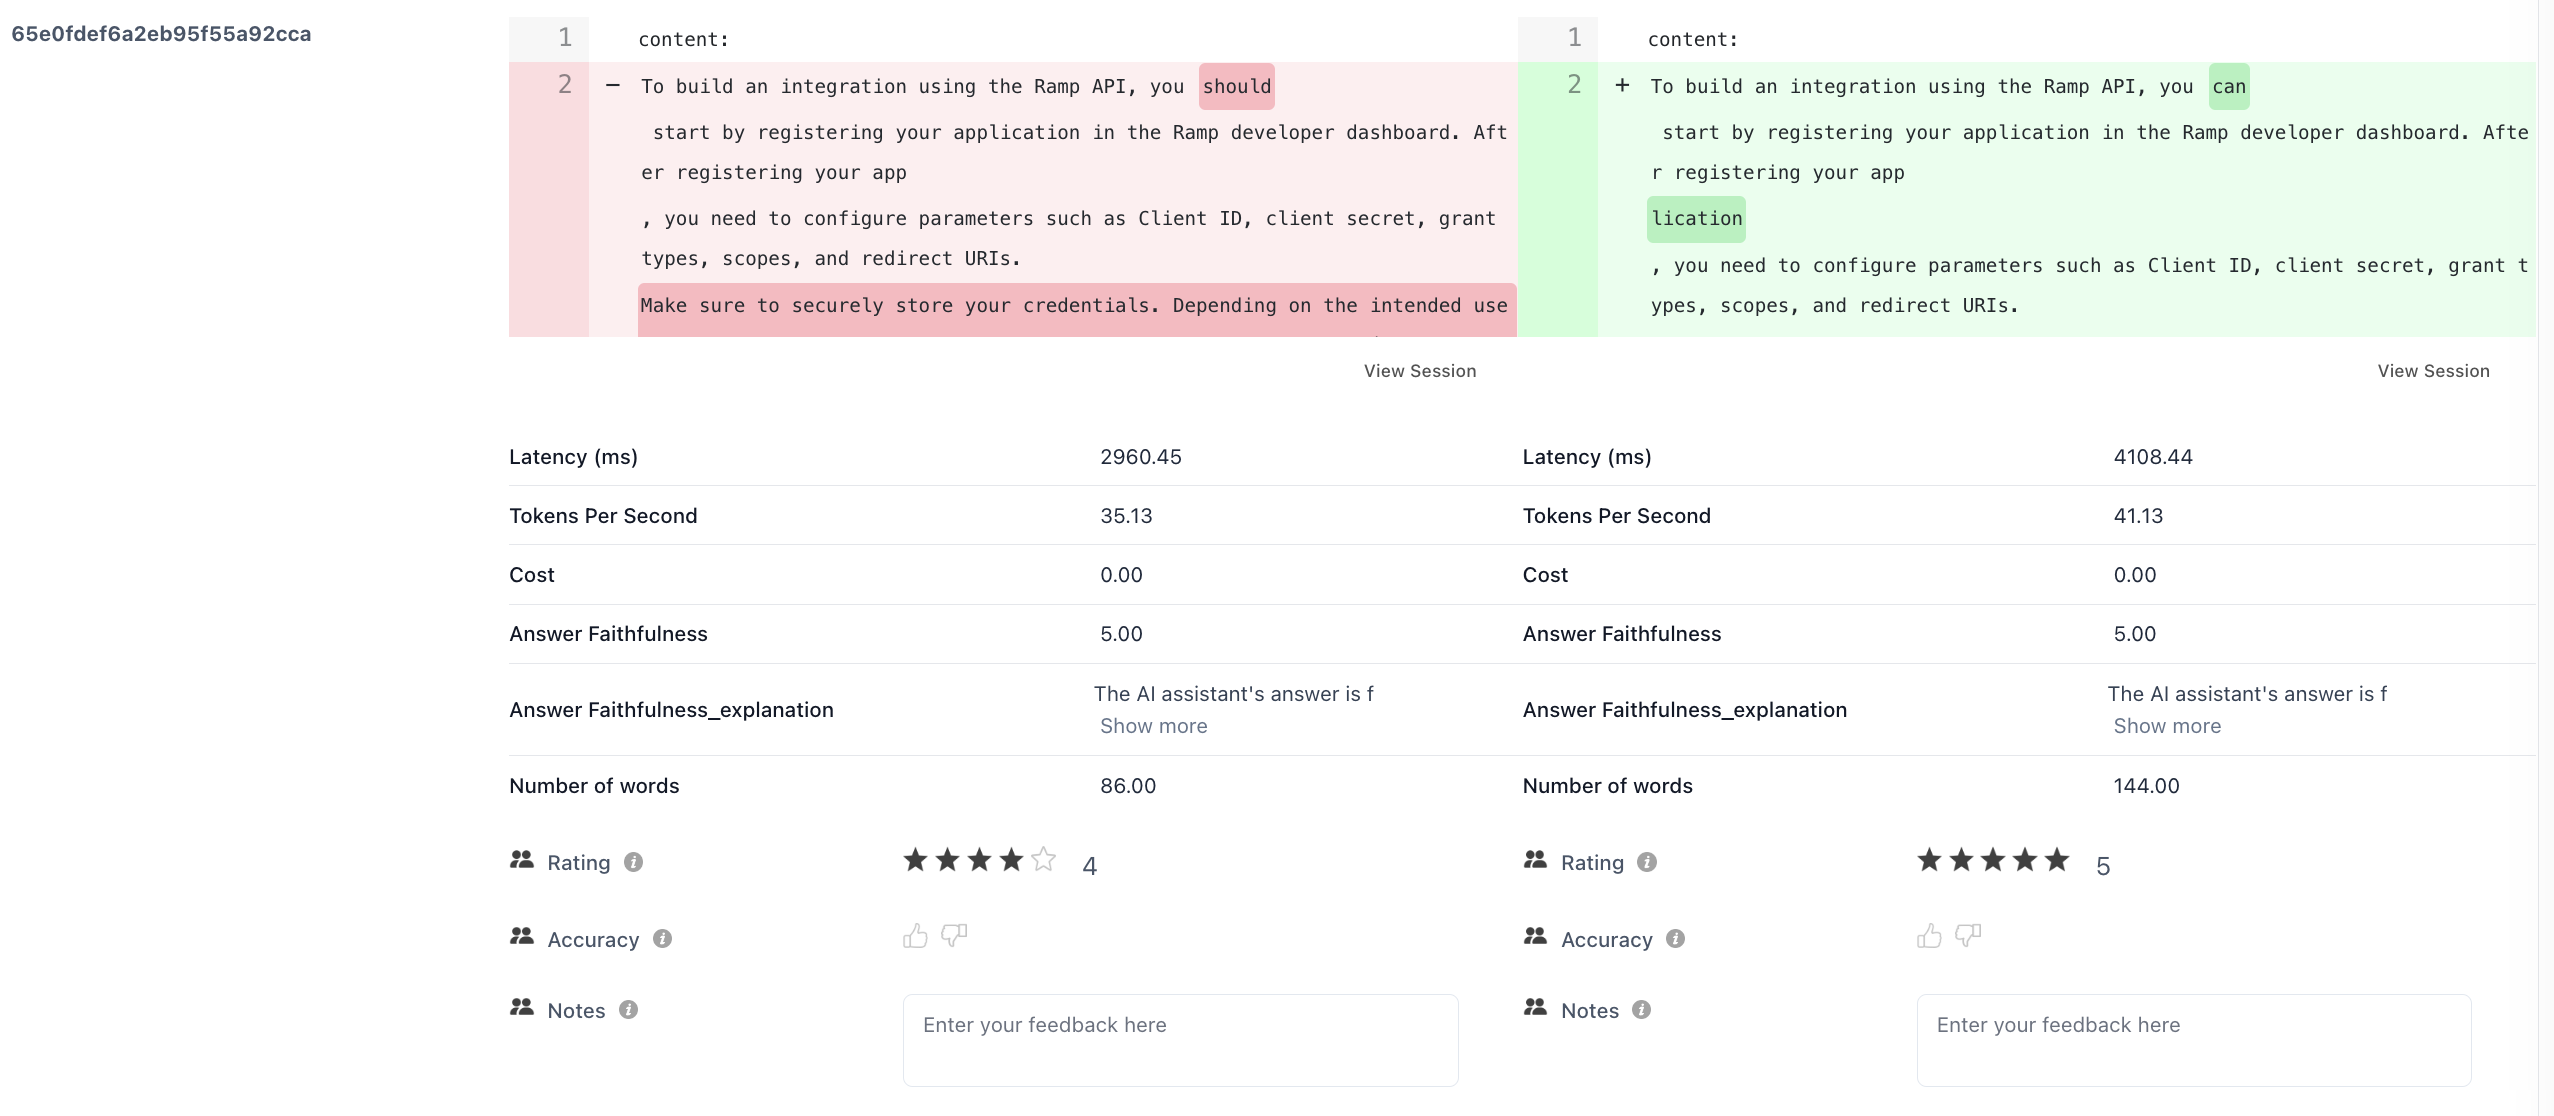
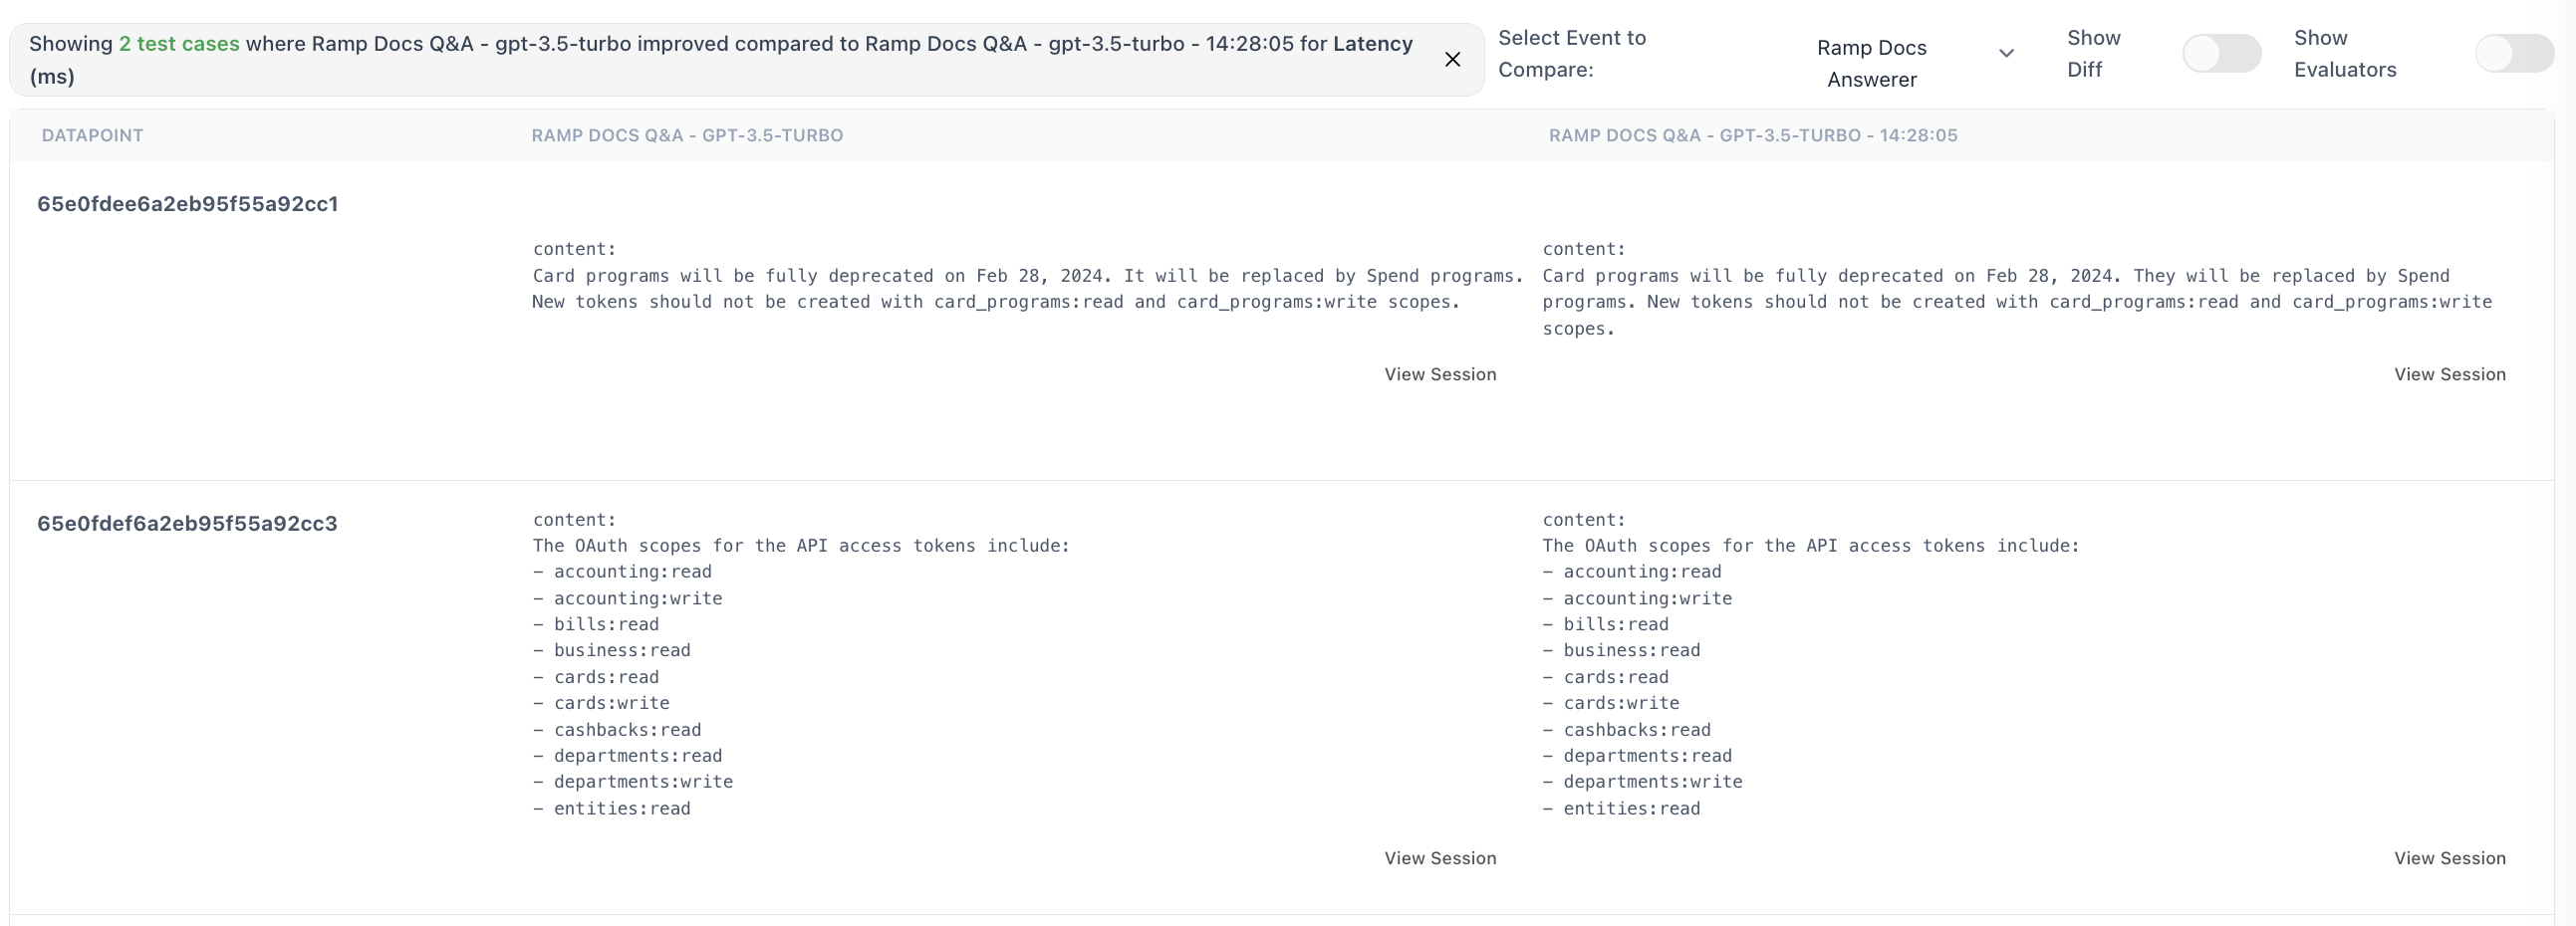 ### 4. Output Diff Viewer
Compare outputs and metrics of corresponding events with the same event name.
### 4. Output Diff Viewer
Compare outputs and metrics of corresponding events with the same event name.
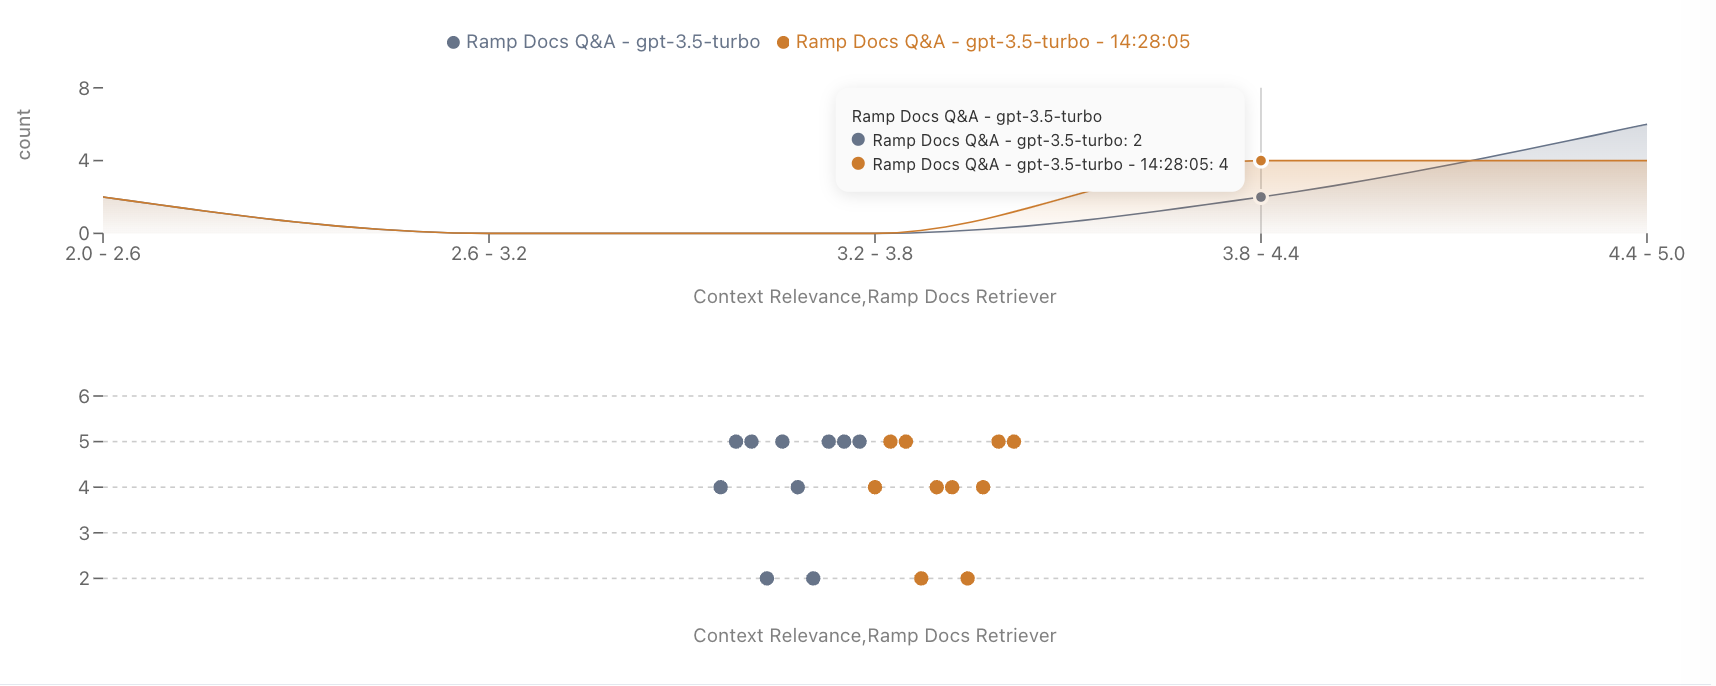
 ### 5. Metric Distribution
Analyze the distribution of various metrics for deeper insights.
### 5. Metric Distribution
Analyze the distribution of various metrics for deeper insights.
 ## Best Practices
1. Use a consistent dataset for all compared experiments.
2. Isolate one change at a time (e.g., model, prompt, temperature) to understand its specific impact.
3. Ensure a sufficient sample size for statistically significant conclusions.
4. Document configurations used in each experiment for future reference.
## Conclusion
Comparitive View for Experiments in HoneyHive provide a powerful tool for benchmarking different LLM configurations. Leverage this feature to make data-driven decisions about optimal models, prompts, or parameters for your specific use case.
## Best Practices
1. Use a consistent dataset for all compared experiments.
2. Isolate one change at a time (e.g., model, prompt, temperature) to understand its specific impact.
3. Ensure a sufficient sample size for statistically significant conclusions.
4. Document configurations used in each experiment for future reference.
## Conclusion
Comparitive View for Experiments in HoneyHive provide a powerful tool for benchmarking different LLM configurations. Leverage this feature to make data-driven decisions about optimal models, prompts, or parameters for your specific use case.