> ## Documentation Index
> Fetch the complete documentation index at: https://docs.honeyhive.ai/llms.txt
> Use this file to discover all available pages before exploring further.
# Distributed Tracing
> How to trace application execution across multiple services.
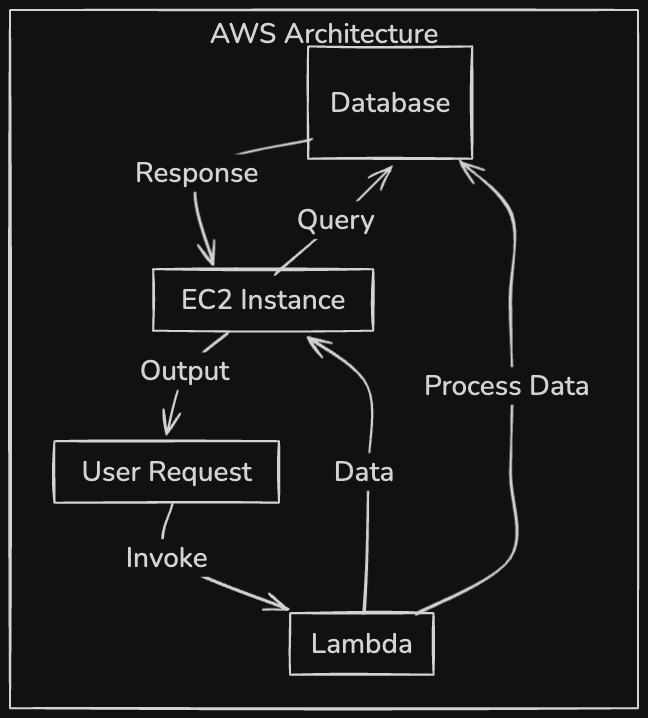
LLM applications often involve both backend and frontend services to deliver the best user experience.
With distributed tracing, we are able to stitch together traces from across multiple services to see what happens when a user interacts with our application.
 ### How it works
When a trace is captured in a service, a unique **Session Id** is associated with the trace. This allows HoneyHive to correlate traces across multiple services.
The Session Id must be passed from service to service to maintain a consistent Session Id across all services.
### Implementing distributed tracing
For this tutorial, we are assuming you have already instrumented one of your services with our tracer and now want to correlate that trace with another.
### Prerequisites
You have already set tracing for your code as [described here](/introduction/quickstart).
For serverless environments such as AWS Lambda, please ensure that you are using the x86\_64 runtime architecture in your lambda. You can install the x86\_64 version of honeyhive using:
```bash Bash (Python) theme={null}
pip install \
--platform manylinux2014_x86_64 \
--target ./site-packages \
--implementation cp \
--python-version 3.11 \
--only-binary=:all: \
--upgrade "honeyhive>=0.2.37"
```
**Expected Time**: 5 minutes
**Steps**
All our tracers expose a `session_id`/`sessionId` property that you can use to get the session id of the trace.
For TypeScript, you will need to pass the tracer object to the traced function to fetch the session id.
```python Python theme={null}
from honeyhive import HoneyHiveTracer
# make sure to set disable_batch=True if you are using serverless environments such as AWS Lambda
HoneyHiveTracer.init(
api_key="my-api-key",
project="my-project",
session_name="my-session-name",
disable_batch=True
)
# ...
session_id = HoneyHiveTracer.session_id
```
```typescript TypeScript theme={null}
import { HoneyHiveTracer } from "honeyhive";
// inside the traced function
const sessionId = tracer.sessionId;
```
```python LangChain / LlamaIndex theme={null}
session_id = honeyhive_tracer.session_id
```
Pass the session id as one of the response headers or body properties to the other service.
In the other service, instantiate the tracer with the session id you received from the original service.
For serverless environments such as AWS Lambda, you must set `disable_batch` to `True` in the `init` function. Also, ensure that you are using the x86\_64 runtime architecture in your lambda.
```python Python theme={null}
from honeyhive import HoneyHiveTracer
# make sure to set disable_batch=True if you are using serverless environments such as AWS Lambda
HoneyHiveTracer.init(
session_id=session_id,
api_key="my-api-key",
disable_batch=True
)
```
```typescript TypeScript theme={null}
import { HoneyHiveTracer } from "honeyhive";
// place the code below at the beginning of your application
const tracer = await HoneyHiveTracer.init({
sessionId: sessionId,
apiKey: MY_HONEYHIVE_API_KEY,
});
await tracer.trace(async () => {
// your code here
});
```
```python Lambda (Python) theme={null}
from honeyhive import HoneyHiveTracer
HoneyHiveTracer.init(
session_id=session_id,
api_key=MY_HONEYHIVE_API_KEY,
disable_batch=True
)
```
### Conclusion
You have successfully correlated traces across multiple services. You can now see the full trace in HoneyHive.
### Learn more
Learn how HoneyHive's core data model works.
Learn how to use your traces in the HoneyHive UI.
### How it works
When a trace is captured in a service, a unique **Session Id** is associated with the trace. This allows HoneyHive to correlate traces across multiple services.
The Session Id must be passed from service to service to maintain a consistent Session Id across all services.
### Implementing distributed tracing
For this tutorial, we are assuming you have already instrumented one of your services with our tracer and now want to correlate that trace with another.
### Prerequisites
You have already set tracing for your code as [described here](/introduction/quickstart).
For serverless environments such as AWS Lambda, please ensure that you are using the x86\_64 runtime architecture in your lambda. You can install the x86\_64 version of honeyhive using:
```bash Bash (Python) theme={null}
pip install \
--platform manylinux2014_x86_64 \
--target ./site-packages \
--implementation cp \
--python-version 3.11 \
--only-binary=:all: \
--upgrade "honeyhive>=0.2.37"
```
**Expected Time**: 5 minutes
**Steps**
All our tracers expose a `session_id`/`sessionId` property that you can use to get the session id of the trace.
For TypeScript, you will need to pass the tracer object to the traced function to fetch the session id.
```python Python theme={null}
from honeyhive import HoneyHiveTracer
# make sure to set disable_batch=True if you are using serverless environments such as AWS Lambda
HoneyHiveTracer.init(
api_key="my-api-key",
project="my-project",
session_name="my-session-name",
disable_batch=True
)
# ...
session_id = HoneyHiveTracer.session_id
```
```typescript TypeScript theme={null}
import { HoneyHiveTracer } from "honeyhive";
// inside the traced function
const sessionId = tracer.sessionId;
```
```python LangChain / LlamaIndex theme={null}
session_id = honeyhive_tracer.session_id
```
Pass the session id as one of the response headers or body properties to the other service.
In the other service, instantiate the tracer with the session id you received from the original service.
For serverless environments such as AWS Lambda, you must set `disable_batch` to `True` in the `init` function. Also, ensure that you are using the x86\_64 runtime architecture in your lambda.
```python Python theme={null}
from honeyhive import HoneyHiveTracer
# make sure to set disable_batch=True if you are using serverless environments such as AWS Lambda
HoneyHiveTracer.init(
session_id=session_id,
api_key="my-api-key",
disable_batch=True
)
```
```typescript TypeScript theme={null}
import { HoneyHiveTracer } from "honeyhive";
// place the code below at the beginning of your application
const tracer = await HoneyHiveTracer.init({
sessionId: sessionId,
apiKey: MY_HONEYHIVE_API_KEY,
});
await tracer.trace(async () => {
// your code here
});
```
```python Lambda (Python) theme={null}
from honeyhive import HoneyHiveTracer
HoneyHiveTracer.init(
session_id=session_id,
api_key=MY_HONEYHIVE_API_KEY,
disable_batch=True
)
```
### Conclusion
You have successfully correlated traces across multiple services. You can now see the full trace in HoneyHive.
### Learn more
Learn how HoneyHive's core data model works.
Learn how to use your traces in the HoneyHive UI.