> ## Documentation Index
> Fetch the complete documentation index at: https://docs.honeyhive.ai/llms.txt
> Use this file to discover all available pages before exploring further.
# Introduction
> Getting started with tracing in HoneyHive.
Distributed tracing is a critical observability technique for modern AI systems, providing a hierarchical view of execution across complex architectures.
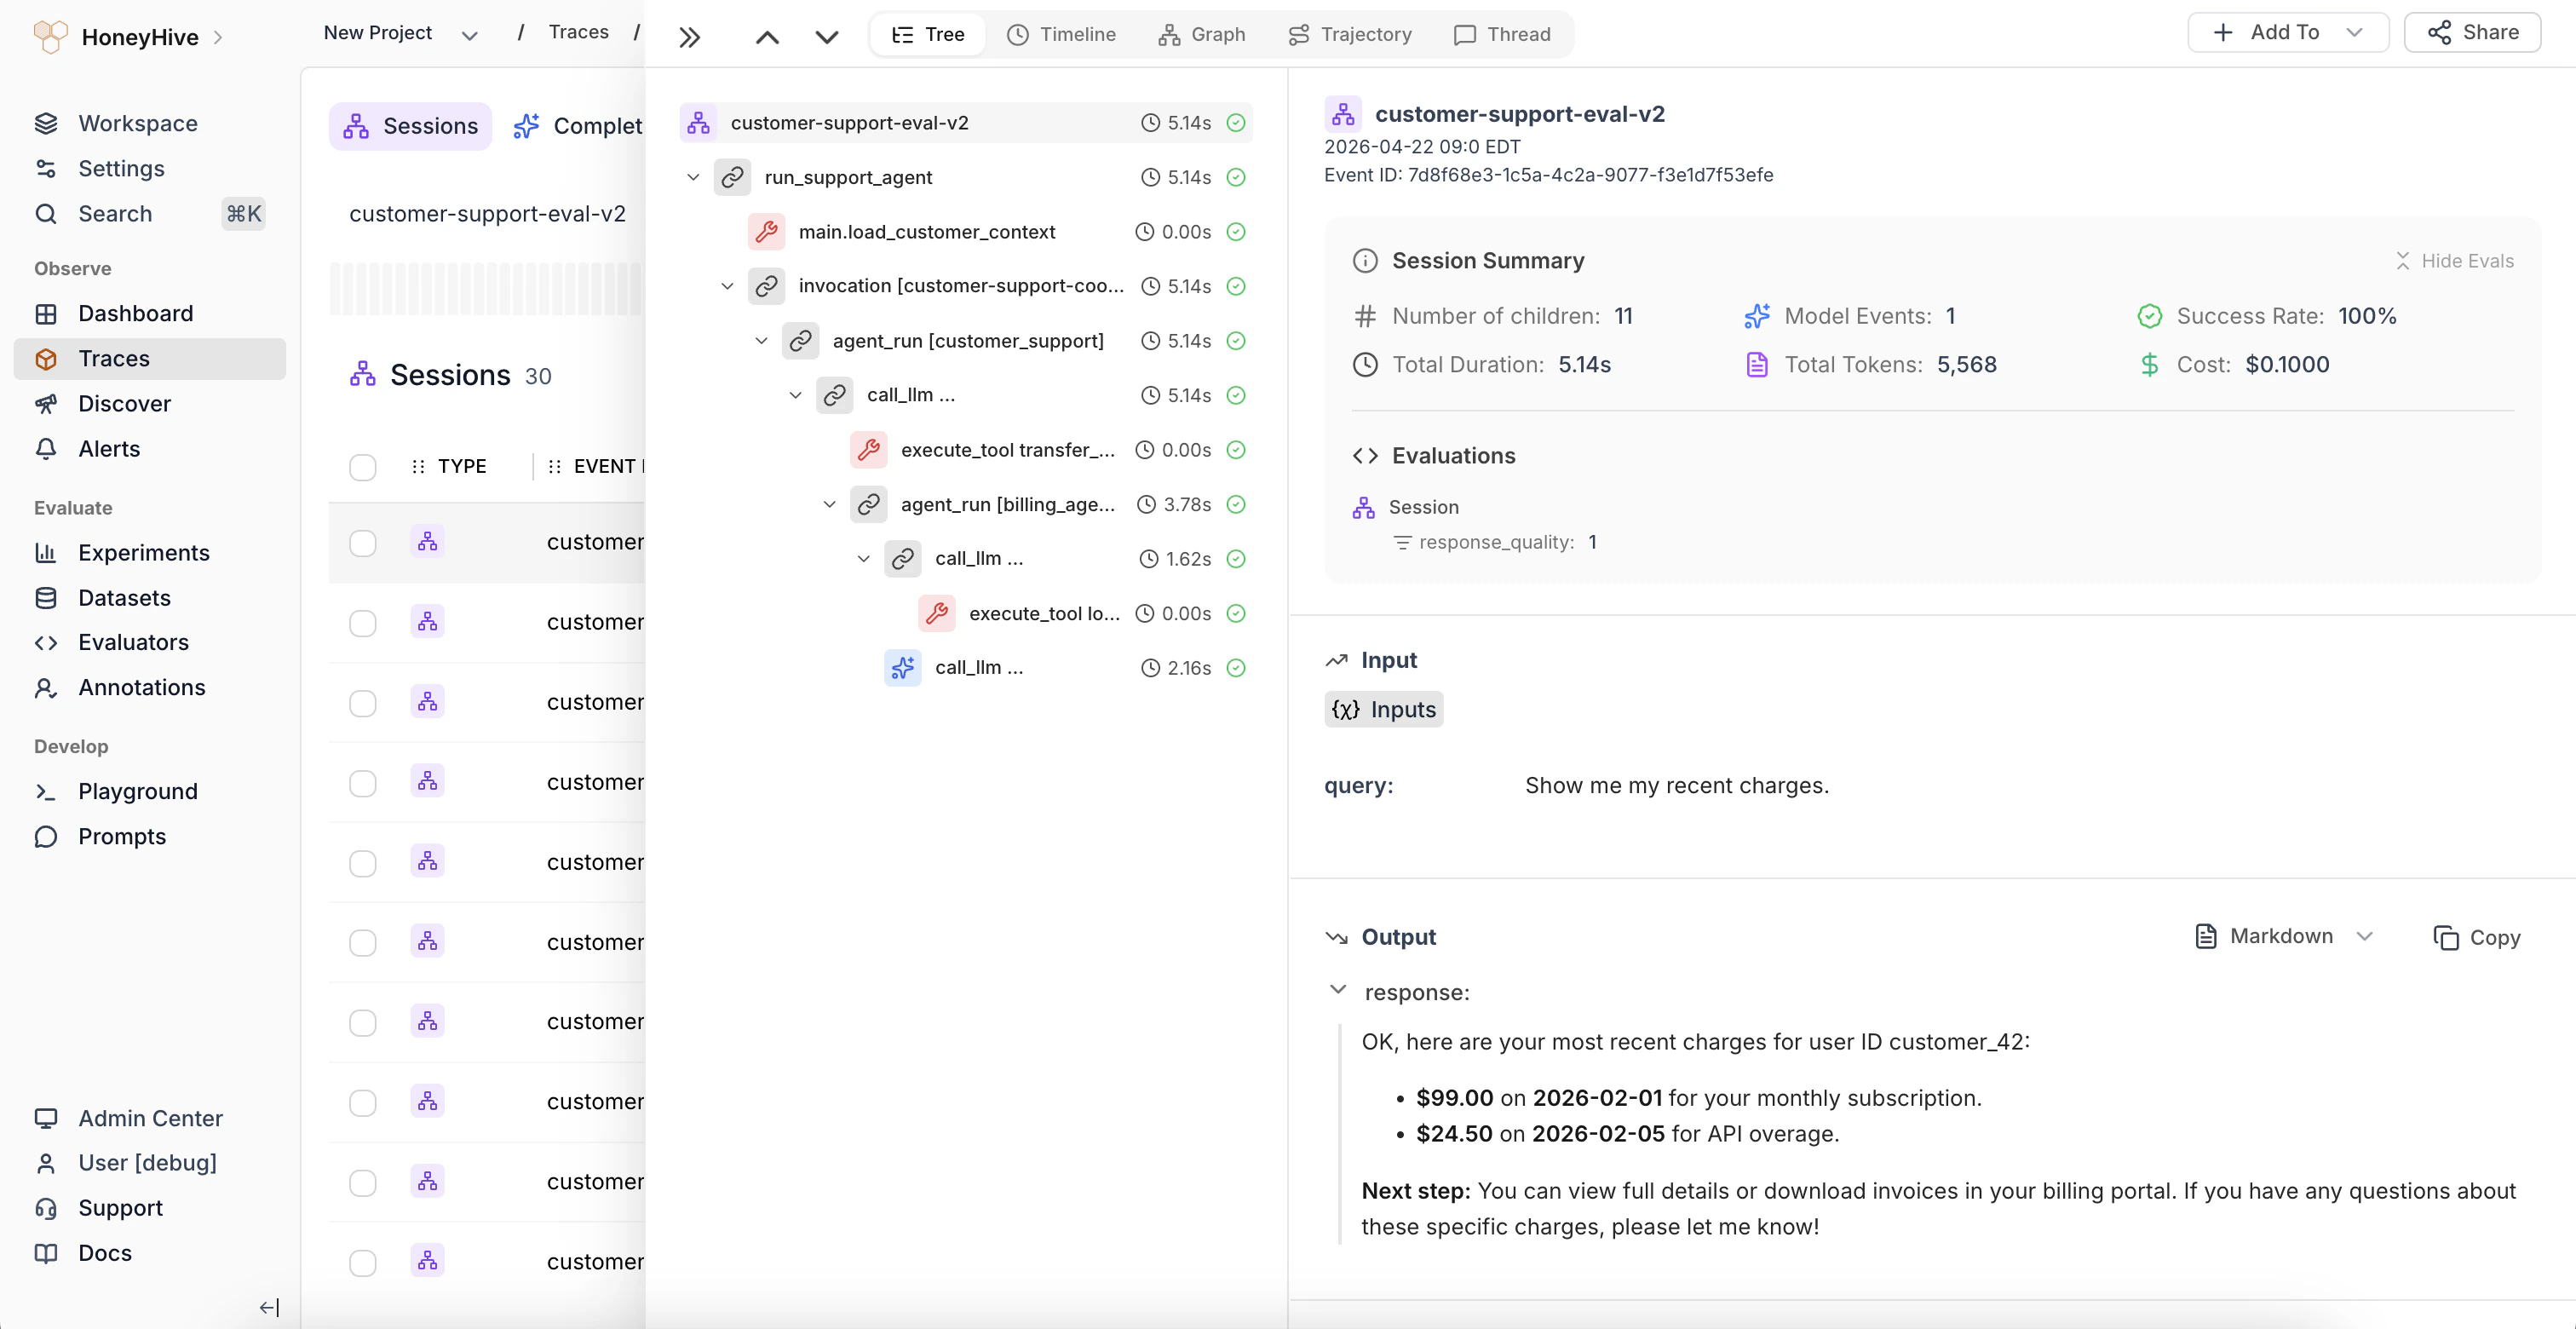 HoneyHive's tracing capabilities enable you to:
1. **Log Execution Data**: Log detailed information throughout your AI pipeline.
2. **Analyze System Behavior**: Gain insights into component interactions, including LLM calls and database queries.
3. **Debug Complex Scenarios**: Trace issues across service boundaries in multi-modal AI systems.
4. **Evaluate Performance**: Assess model outputs, prompt effectiveness, and overall system performance.
5. **Monitor Key Metrics**: Track latency, token usage, costs, and custom KPIs in real-time.
This guide will walk you through implementing HoneyHive tracing, from basic instrumentation to advanced techniques for distributed AI systems.
## Understanding Sessions and Events
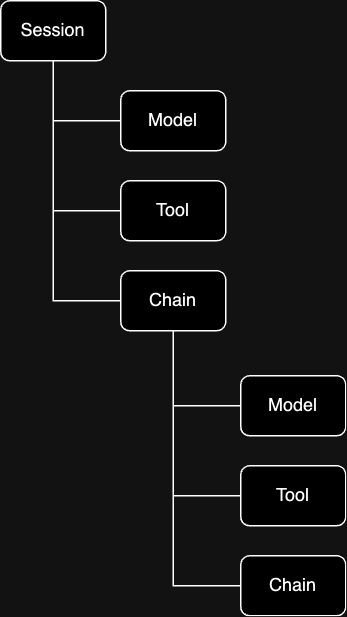
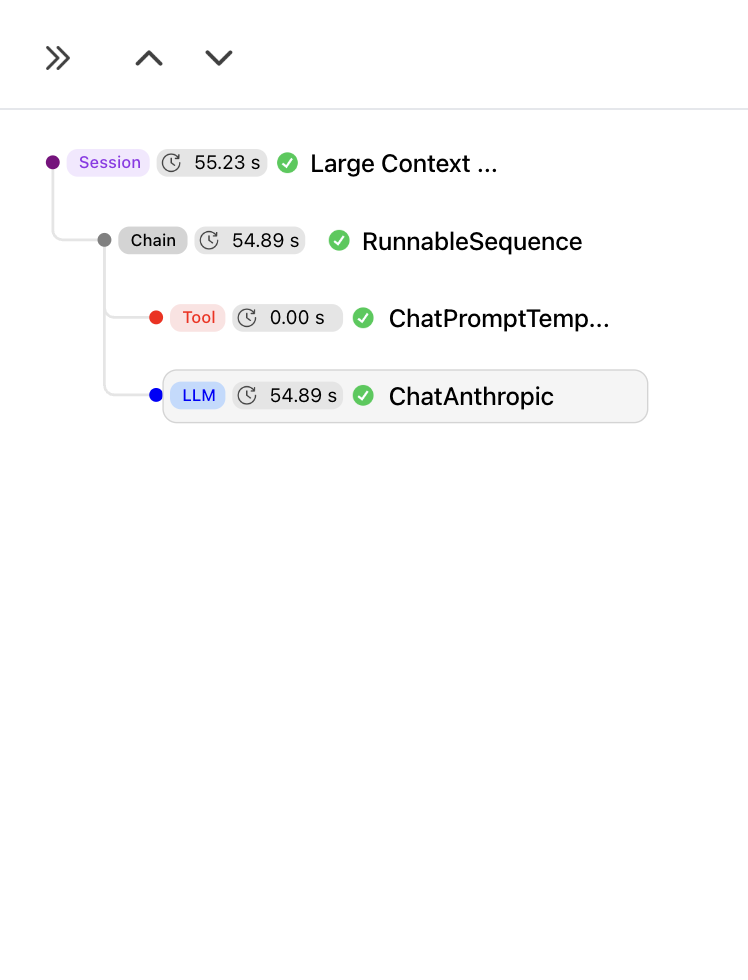
HoneyHive's tracing system represents your code's execution flow across different processes and services as a hierarchical tree of events. This structure provides a comprehensive view of your application's execution flow:
HoneyHive's tracing capabilities enable you to:
1. **Log Execution Data**: Log detailed information throughout your AI pipeline.
2. **Analyze System Behavior**: Gain insights into component interactions, including LLM calls and database queries.
3. **Debug Complex Scenarios**: Trace issues across service boundaries in multi-modal AI systems.
4. **Evaluate Performance**: Assess model outputs, prompt effectiveness, and overall system performance.
5. **Monitor Key Metrics**: Track latency, token usage, costs, and custom KPIs in real-time.
This guide will walk you through implementing HoneyHive tracing, from basic instrumentation to advanced techniques for distributed AI systems.
## Understanding Sessions and Events
HoneyHive's tracing system represents your code's execution flow across different processes and services as a hierarchical tree of events. This structure provides a comprehensive view of your application's execution flow:
 ### Session
The root event in the tree is called a `session` event, which is equivalent to `trace` in Application Performance Monitoring (APM) tools. A session represents a complete interaction or process within your AI application, grouping together all subsequent events in that trace.
### Events
Each `session` is composed of nested `event`s, which are equivalent to `span`s in APM tools. Events represent discrete operations or steps in your application's execution. They can be of different types:
1. **`Model` Events**:
* Represent API requests to any model providers
* Capture input prompts, output responses, and relevant metadata
* Example: A GPT-4o completion request or a DALL-E image generation call
2. **`Tool` Events**:
* Represent API requests to external services or tools
* Can include API calls, database queries, or custom function executions
* Example: A vector database similarity search, an external API call for internet search, etc.
3. **`Chain` Events**:
* Contain nested events
* Represent a sequence of operations or a logical grouping of related actions
* Example: A multi-step reasoning process or a complex query pipeline
Segmenting execution by these different event types enables quicker debugging, dataset curation, and granular evaluations down the line. This hierarchical structure allows for detailed analysis and efficient troubleshooting of your AI application's execution flow, providing insights at every level of your system. You can learn more about our data model [here](/schema-overview).
## Getting Started
### Automatic Tracing
For those looking to get started quickly, we recommend our automatic tracing method. This method automatically instruments major LLM providers and even vector database requests with minimal setup using OpenTelemetry's Semantic Conventions.
Begin tracing sessions with HoneyHive in minutes
Explore our wide range of pre-built integrations
For a comprehensive list of packages supported by our automatic tracer, please refer to our [compatibility guide](/introduction/troubleshooting#latest-package-versions-tested).
### Tracing Custom Spans
While automatic tracing covers many use cases, you may need to instrument custom logic or code not captured automatically. Custom Spans allow you to trace any function in your codebase.
Trace any custom spans in Python/TS using function decorators.
### Enriching Traces
To maximize the value of your traces, you can enrich any event with additional properties such as `user feedback`, `user properties`, `evaluations`, `configs`, `metadata`, and more.
Learn how to add valuable context to your traces
### Advanced Tracing Techniques
For mature AI teams with complex requirements, we offer advanced tracing capabilities:
Track execution across multiple services
Instrument multi-modal AI pipelines effectively
Trace multi-threaded Python applications
Conduct A/B tests on metrics and feedback
### Manual Instrumentation via API
For scenarios requiring fine-grained control over tracing or when using languages outside of Python and JS/TS, we offer manual instrumentation options:
Implement custom tracing logic via our APIs
Explore our comprehensive API documentation
## Next Steps
Now that you're familiar with HoneyHive's tracing capabilities, we recommend:
1. Setting up automatic tracing in a test environment using our [Quickstart Guide](/introduction/quickstart)
2. Experimenting with custom spans in your code
3. Exploring our advanced features to optimize your AI workflows
For any questions or support, please don't hesitate to reach out to our [support team](mailto:support@honeyhive.ai) or join our [community forum](https://discord.gg/vqctGpqA97).
### Session
The root event in the tree is called a `session` event, which is equivalent to `trace` in Application Performance Monitoring (APM) tools. A session represents a complete interaction or process within your AI application, grouping together all subsequent events in that trace.
### Events
Each `session` is composed of nested `event`s, which are equivalent to `span`s in APM tools. Events represent discrete operations or steps in your application's execution. They can be of different types:
1. **`Model` Events**:
* Represent API requests to any model providers
* Capture input prompts, output responses, and relevant metadata
* Example: A GPT-4o completion request or a DALL-E image generation call
2. **`Tool` Events**:
* Represent API requests to external services or tools
* Can include API calls, database queries, or custom function executions
* Example: A vector database similarity search, an external API call for internet search, etc.
3. **`Chain` Events**:
* Contain nested events
* Represent a sequence of operations or a logical grouping of related actions
* Example: A multi-step reasoning process or a complex query pipeline
Segmenting execution by these different event types enables quicker debugging, dataset curation, and granular evaluations down the line. This hierarchical structure allows for detailed analysis and efficient troubleshooting of your AI application's execution flow, providing insights at every level of your system. You can learn more about our data model [here](/schema-overview).
## Getting Started
### Automatic Tracing
For those looking to get started quickly, we recommend our automatic tracing method. This method automatically instruments major LLM providers and even vector database requests with minimal setup using OpenTelemetry's Semantic Conventions.
Begin tracing sessions with HoneyHive in minutes
Explore our wide range of pre-built integrations
For a comprehensive list of packages supported by our automatic tracer, please refer to our [compatibility guide](/introduction/troubleshooting#latest-package-versions-tested).
### Tracing Custom Spans
While automatic tracing covers many use cases, you may need to instrument custom logic or code not captured automatically. Custom Spans allow you to trace any function in your codebase.
Trace any custom spans in Python/TS using function decorators.
### Enriching Traces
To maximize the value of your traces, you can enrich any event with additional properties such as `user feedback`, `user properties`, `evaluations`, `configs`, `metadata`, and more.
Learn how to add valuable context to your traces
### Advanced Tracing Techniques
For mature AI teams with complex requirements, we offer advanced tracing capabilities:
Track execution across multiple services
Instrument multi-modal AI pipelines effectively
Trace multi-threaded Python applications
Conduct A/B tests on metrics and feedback
### Manual Instrumentation via API
For scenarios requiring fine-grained control over tracing or when using languages outside of Python and JS/TS, we offer manual instrumentation options:
Implement custom tracing logic via our APIs
Explore our comprehensive API documentation
## Next Steps
Now that you're familiar with HoneyHive's tracing capabilities, we recommend:
1. Setting up automatic tracing in a test environment using our [Quickstart Guide](/introduction/quickstart)
2. Experimenting with custom spans in your code
3. Exploring our advanced features to optimize your AI workflows
For any questions or support, please don't hesitate to reach out to our [support team](mailto:support@honeyhive.ai) or join our [community forum](https://discord.gg/vqctGpqA97).