> ## Documentation Index
> Fetch the complete documentation index at: https://docs.honeyhive.ai/llms.txt
> Use this file to discover all available pages before exploring further.
# Explore Traces in UI
> Learn how to use HoneyHive to utilize your traces
Using the trace sideview in our Log Store, you can quickly navigate through your traces, debug LLM requests, and curate datasets.
## Debugging LLM requests
Sometimes you might see an LLM output that doesn't look right. In such cases, you can quickly debug the output by opening the model event in the Playground and iterating on your prompt to resolve the issue.
You can open a model event in your trace in the Playground by clicking the `Open in Playground` button on the top right of your trace.
**Expected time**: 1-2 minutes
## Annotating outputs
It's important to manually review your LLM outputs even if you use automated evaluators, in order to judge whether the outputs meet your specific criteria. Teams often involve domain experts in this process.
To do so, you can [**define human evaluation criteria**](/evaluators/human) in the `Evaluators` tab and use the UI to score outputs and provide comments.
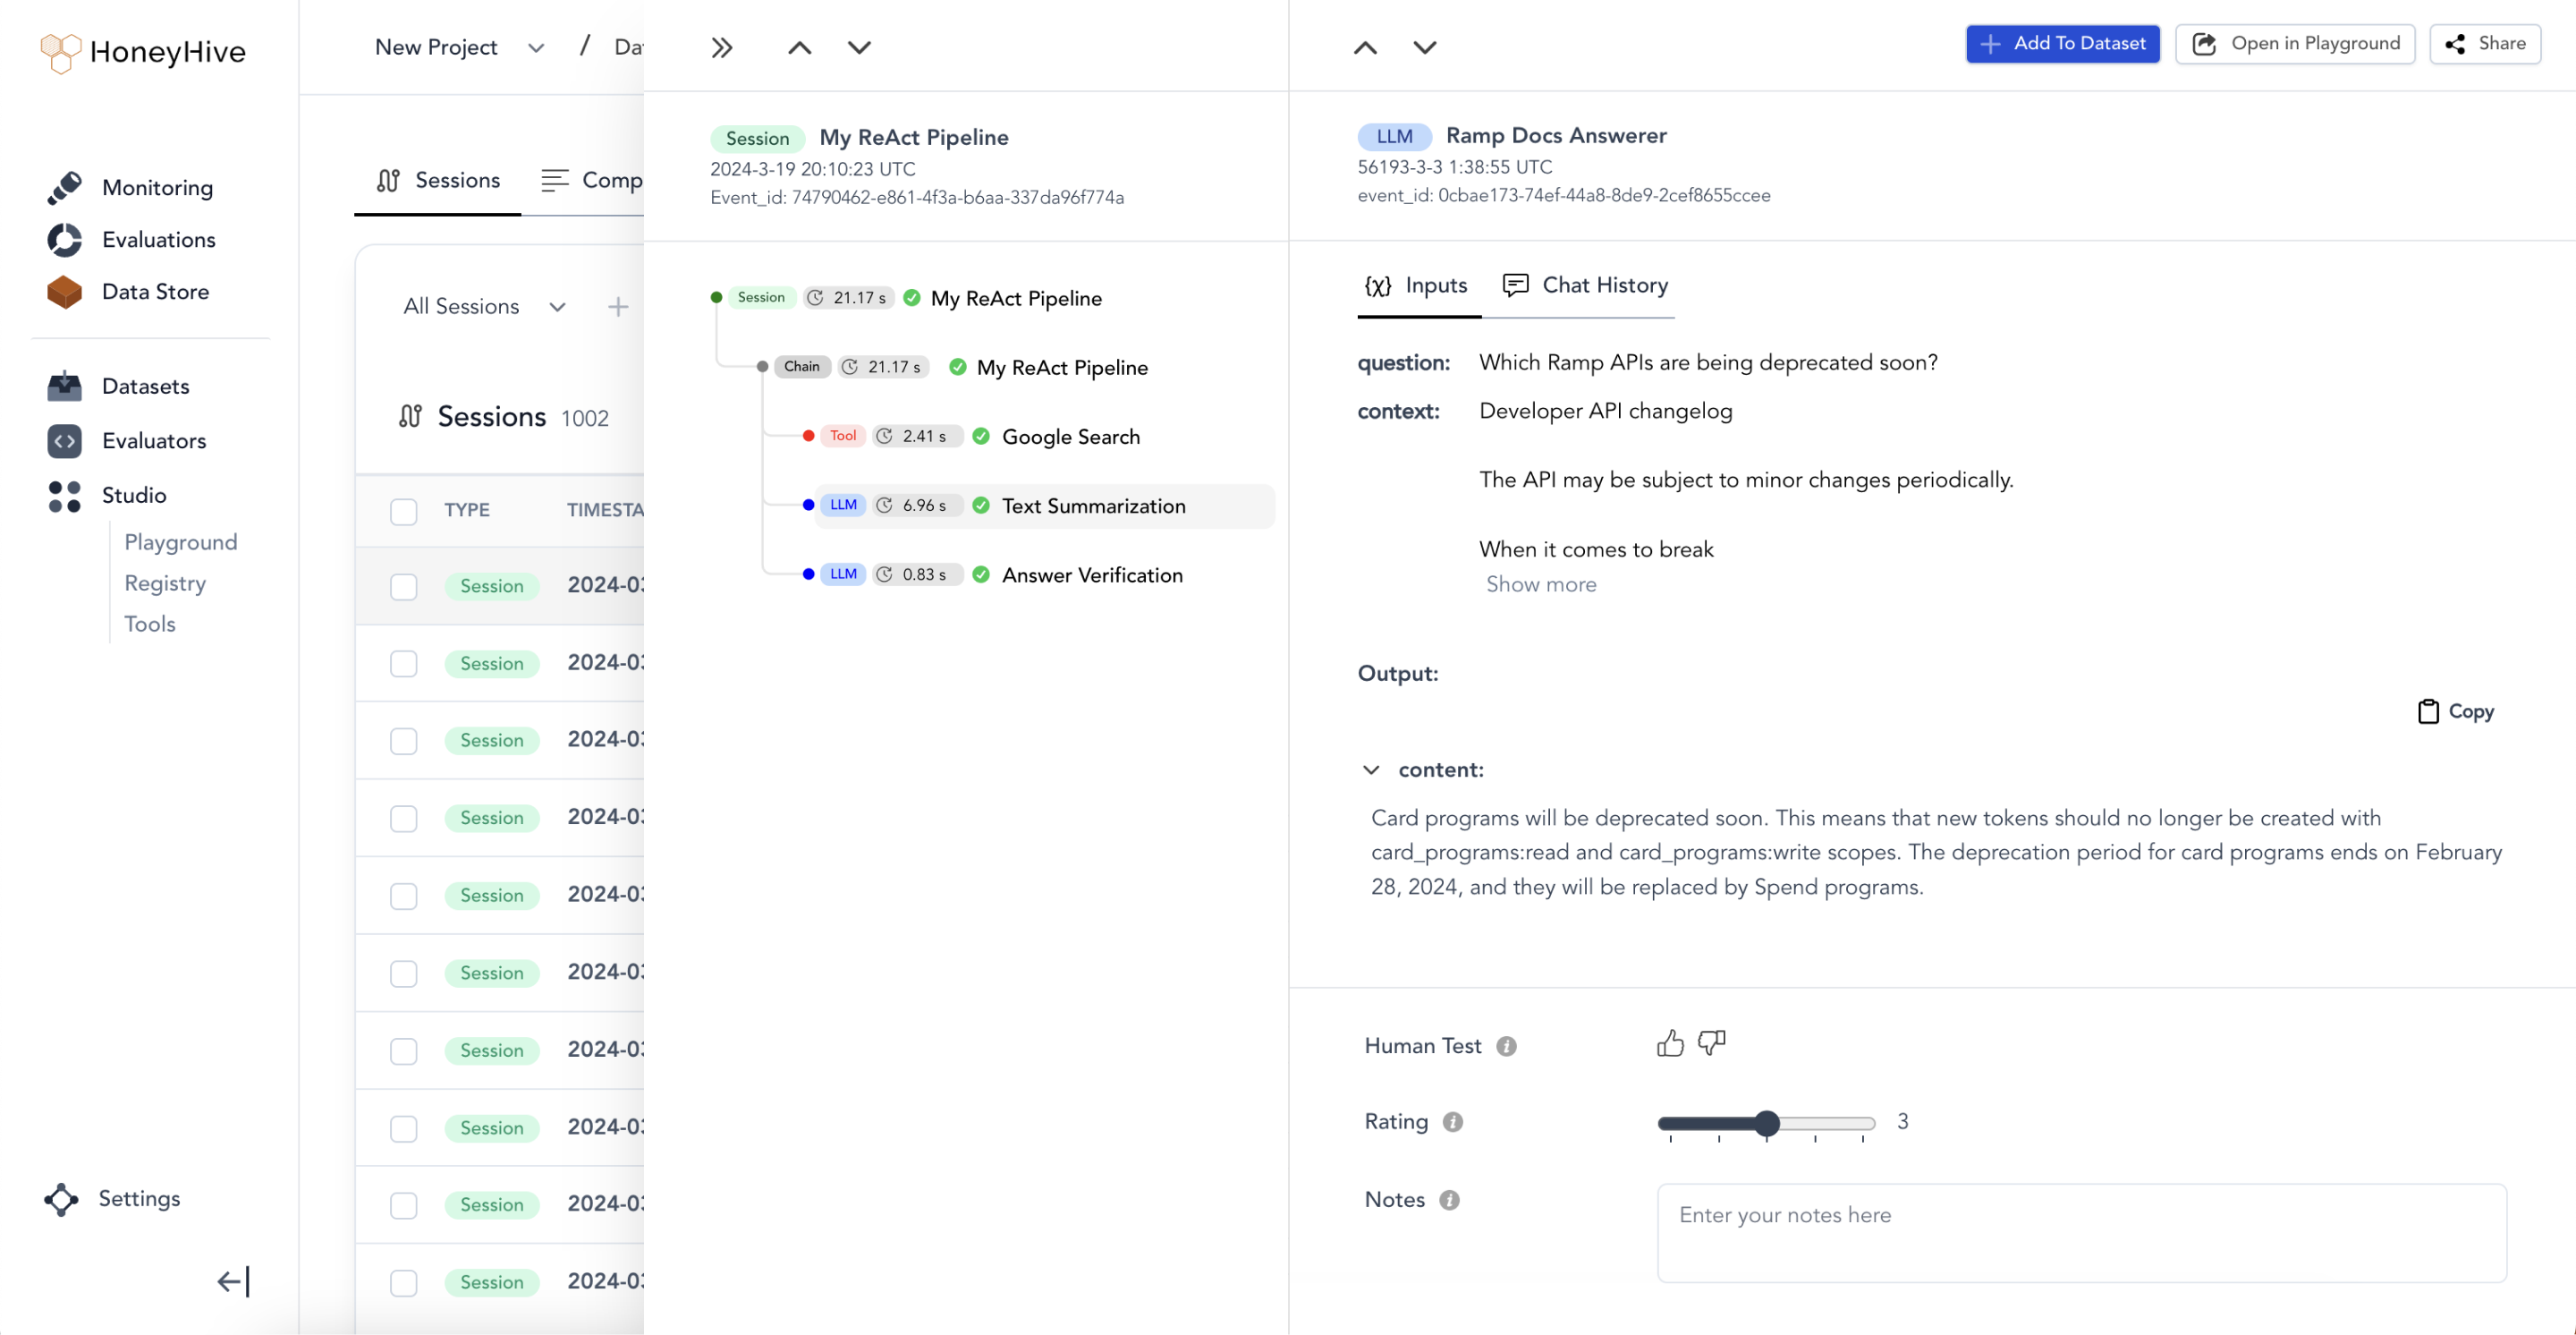 **Annotation Queues:** You can create an annotation queue by simply using the trace and span-level filters in the `Log Store`. Use `Completions` tab if you're looking to navigate between LLM requests, and `Sessions` tab if you're looking to navigate between traces. You can use keyboard shortcuts like ⬆️ and ⬇️ to navigate across rows.
## Curating datasets
With the UI, you can curate datasets for your overall session, completions or any particular step of your pipeline.
In the following example, we will do so for the overall session. You can simply add a filter for `event_name` or go to the `Completions` tab to curate model requests.
**Expected time:** 1-2 minutes
**Steps:**
**Annotation Queues:** You can create an annotation queue by simply using the trace and span-level filters in the `Log Store`. Use `Completions` tab if you're looking to navigate between LLM requests, and `Sessions` tab if you're looking to navigate between traces. You can use keyboard shortcuts like ⬆️ and ⬇️ to navigate across rows.
## Curating datasets
With the UI, you can curate datasets for your overall session, completions or any particular step of your pipeline.
In the following example, we will do so for the overall session. You can simply add a filter for `event_name` or go to the `Completions` tab to curate model requests.
**Expected time:** 1-2 minutes
**Steps:**
## Sharing traces
Sharing a trace is as simple as clicking the Share button on the top right of your trace.
 The link to the trace is now copied to your cilpboard & can be shared with anyone on your team.
Note: If you share a child event, the link will take them directly to that specific event in the trace.
The link to the trace is now copied to your cilpboard & can be shared with anyone on your team.
Note: If you share a child event, the link will take them directly to that specific event in the trace.