> ## Documentation Index
> Fetch the complete documentation index at: https://docs.honeyhive.ai/llms.txt
> Use this file to discover all available pages before exploring further.
# Product
> See what is new in the HoneyHive platform and UI. Browse product updates, feature launches, and major improvements that affect how you build and monitor AI.
## Core Platform
### Data Plane Selector in Admin Center
Multi-data-plane deployments can now switch between data planes directly from the Admin Center. A new dropdown in the Data Plane section (General and Members) lets you target a specific data plane without leaving the page. Switching no longer resets your current workspace and project, and newly created data planes appear immediately without requiring a re-login.
### Improvements
* Dataset ID is now a searchable field on the Datasets page, making it easier to find specific datasets when you know the ID.
* Project and workspace settings pages now clearly prompt you to select a scope before showing settings, instead of displaying an ambiguous empty state.
* The workspace switcher now consistently shows "Workspace" instead of a confusing "Onboarding" label when no workspace is selected.
### Fixes
* Fixed intermittent "No events found" in the UI when the events database was temporarily unavailable. Transient failures now retry automatically and surface as errors instead of silently showing empty results.
* Fixed slow loading of evaluator results on large projects.
* String field values now appear as filter options on the Traces page. Previously, string values were not recorded for filtering.
* Playground now loads the correct prompt template, config, and inputs after a page refresh.
* Fixed a double scrollbar in the evaluator test panel and test results being cleared shortly after running.
* Fixed the event-name dropdown on the Traces page rendering behind the table header.
* Fixed the profile menu being hidden behind other page elements on the evaluator page.
* Experiment run names can no longer be empty or whitespace-only.
* Running an evaluator that requires ground truth on an event with no feedback now shows a clear message instead of a generic error.
* Quickstart coding-agent prompts now wrap correctly within cards instead of overflowing.
* Fixed an issue with the Admin Center scope selector when editing member roles.
* Fixed the "New Workspace" button being incorrectly disabled in certain multi-data-plane configurations.
## Core Platform
### Streamlined Scope Navigation
A redesigned navigation experience makes it faster to manage organizations, workspaces, and projects. New selectors in the top navigation let you browse all scopes in one place, jump directly to scope settings, and see at a glance which scopes you administer versus those you're a direct member of. Per-page scope selectors on Settings pages have been removed in favor of this unified workflow.
### Fetch a Single Event by ID
A new `GET /v1/events/{event_id}` endpoint lets you retrieve a single event directly by its ID. Useful for building integrations, debugging pipelines, or pulling specific events into external tools without querying the full events list.
### Action Required
**The following changes may require action on your part**
* **Self-hosted deployments: update custom admin roles for downward permission inheritance.** The child-scope `list` and `manage_memberships` permissions (e.g., `org.dataplane.list`, `dataplane.workspace.manage_memberships`) are deprecated in this release and will be removed in a future version. Replace them with downward-cascading `scope` and `membership` permissions (e.g., `dataplane.scope.*`, `workspace.membership.*`) in your custom role manifests. Without this update, a future release may cause admins to lose the ability to view and manage descendant scopes where they are not direct members. See the [roles migration table](/v2/workspace/roles#downward-permission-inheritance-migration) for the full mapping. `ProjectAdmin` roles require no changes.
### Improvements
* Experiment runs now display the linked dataset's name alongside the dataset ID in the runs table, run details, summary, and filters, making it easier to identify which dataset a run used.
### Fixes
* Fixed the Traces table freezing or exhausting memory on projects with many event fields. The column selector is now virtualized, and the table only renders the columns you actually use.
* Fixed the Alerts page silently capping at 10 alerts. All alerts now appear with full server-side filtering and pagination.
* Fixed alert configuration offering invalid aggregation options (which could prevent alert creation) and now exposes all supported aggregations, including P99.
* Fixed manual email/password sign-in being blocked for users whose email domain matches an SSO organization. These users can now sign in with their own credentials.
* Fixed editing an alert resetting derived fields (such as the last evaluated result) when the underlying values had not changed.
* Project and read-only API keys now work on the session and queue routes, matching the documented permission policy. Read-only keys can read these routes but still receive HTTP 403 on writes.
* Fixed updating an event with a non-object output value corrupting the event. The `PUT /v1/events/{event_id}` endpoint now validates that `outputs` uses the canonical object form and returns a clear error otherwise.
### Security
* Custom role permission inheritance is now limited to scope and membership permissions. Custom roles that previously inherited broader permissions should grant those permissions directly at the target scope.
## Core Platform
### Read-Only Project API Keys
You can now create read-only API keys from Settings > Project > API Keys by toggling the read-only option when generating a new key. Read-only keys allow your team to query traces, datasets, and evaluator results without the ability to ingest new events. This is useful for dashboards, reporting tools, and integrations that should observe but not write. (See Action Required below for the manual step on existing orgs.)
### Action Required
**The following changes may require action on your part**
* **Read-only API key permissions needed for existing orgs.** To let users create and manage read-only project API keys, add `project.ro_project_api_key.*` to the roles that should manage them (e.g. ProjectAdmin and/or ProjectMember) under Settings > Organization > Roles. New organizations get these permissions automatically; the manual step is only needed for orgs created before this release. [Learn more about roles and permissions](/v2/workspace/roles)
### Improvements
* The Alerts page is now generally available and no longer marked as Beta.
* The event side view now includes a copy button for inputs/outputs JSON, making it faster to grab payloads for debugging or sharing.
### Fixes
* Fixed event and experiment log tables freezing on large payloads. Tables that previously hung for up to 30 seconds when rendering large events now load consistently regardless of payload size.
* Fixed an issue where users with access to many projects could be locked out of the Data Plane due to access tokens exceeding the HTTP header limit. Tokens are now scoped per workspace.
* Error messages captured by the SDK (e.g. via enrichment or traced exceptions) are no longer silently dropped during OpenTelemetry ingestion.
* Non-UUID session IDs sent via OpenTelemetry no longer cause dropped events. These IDs are now mapped to a stable session per project, and the original identifier is preserved for display and search.
* Improved event search latency when retrieving large result sets.
* The "Show Evals" button in the Session Summary is now hidden when an event has no evaluations or feedback.
* Projects with no events now show the onboarding quickstart on the Alerts and Annotation Queues pages instead of a non-functional empty state.
* The Experiments page now refreshes immediately when you navigate to it. Previously, returning to the page within 15 seconds showed cached data, so newly created experiments and runs would not appear until the next automatic refresh.
### Security
* Streaming LLM completion error responses no longer expose internal details such as file paths or connection info. Clients receive a generic error message with no change to the streaming error signal.
## Core Platform
### Jinja2 Templating in LLM Evaluator Prompts
LLM evaluator prompts now support full Jinja2 templating, giving you conditionals, loops, filters, and default values inside your prompt definitions. This makes it easier to write dynamic evaluator prompts that adapt to different event shapes and edge cases. [Learn how to use advanced template syntax](/v2/evaluators/llm#advanced-template-syntax) or browse the ready-made [conversation evaluator templates](/v2/evaluators/evaluator-templates#conversation-evaluator-templates). See **Action Required** below for migration guidance.
### Input/Output Redaction for Self-Hosted Deployments
Self-hosted deployments can now redact event inputs and outputs before data leaves the Data Plane for the Control Plane. Set the `REDACT_VALUES=true` environment variable to replace every value inside event `inputs` and `outputs` with an empty value of its type, while preserving field structure for indexing and filtering. Useful for deployments with strict data residency or privacy requirements.
### Evaluator Version Management API
New API endpoints let you list, create, and deploy evaluator versions programmatically. Create draft versions for testing, then deploy them when ready, without going through the UI. [Learn more about evaluator versioning](/v2/evaluators/versioning)
### OTLP/HTTP Protobuf Support
OTLP/HTTP trace ingestion now accepts `application/x-protobuf` payloads, the default format for most OpenTelemetry SDKs. If you previously had to configure your exporter to send JSON to avoid HTTP 415 errors, you can now use the default protobuf format for better performance and smaller payloads.
### Action Required
**The following changes may require action on your part**
* **Review LLM evaluator prompts for variable casing and array access.** Evaluator prompts now render with Jinja2, so field names are case-sensitive. Use the exact field names shown in **Show Schema**. For array access, prefer explicit bracket notation like `{{ messages[0].content }}` because it is unambiguous and matches JSON indexing. Most prompts using lowercase dot-paths like `{{ outputs.content }}` are unaffected.
### Improvements
* All project pages now enforce per-page permissions. Users without access see a clear "no access" message instead of a broken or empty page.
* Datapoints now have shareable URLs, open in a side panel, and link directly to their source trace.
* Deleting a dataset now requires a confirmation step to prevent accidental deletion.
* The datasets list now includes a search field to filter by name or description.
* Evaluator Advanced Settings are now expanded by default so the sampling percentage is visible without an extra click.
* The alerts, prompts, annotation queue, API keys, providers, and usage tables now use the shared table layout for consistent sorting, pagination, and column resizing.
* Ingestion endpoints now accept gzip-compressed payloads (`Content-Encoding: gzip`) across all OTLP, events, and sessions endpoints.
### Fixes
* Fixed bulk-deleting datapoints removing them from every dataset instead of only the current one.
* Fixed editing a datapoint metadata value unintentionally changing its type.
* Unknown or zero session cost now displays as "-" instead of "\$0.0000".
* Dataset deletion now surfaces success and failure notifications instead of failing silently.
* Fixed evaluator changes not taking effect promptly due to a caching issue. Newly enabled evaluators now activate reliably, and deleted evaluators stop running immediately.
## Core Platform
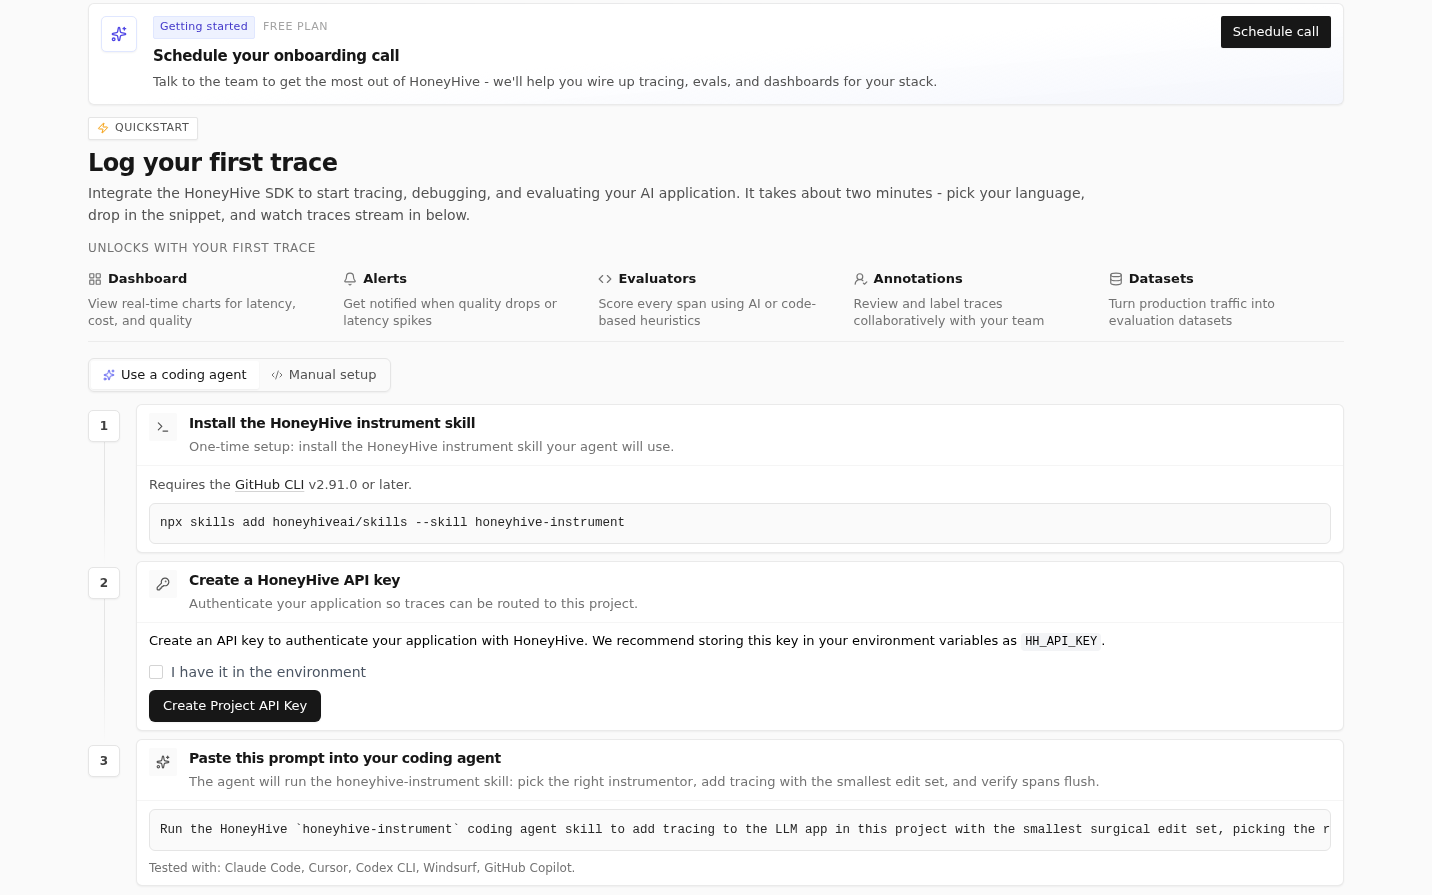
### Coding Agent Onboarding
If you instrument your application through a coding agent like Claude Code or Cursor, the onboarding flow now includes a dedicated path with copyable prompts and a picker for popular coding agents — get from sign-up to first traces faster by pasting straight into your agent. [Learn more about using coding agents with HoneyHive](/v2/introduction/ai-coding-agents).
 ### Faster Project Quickstarts
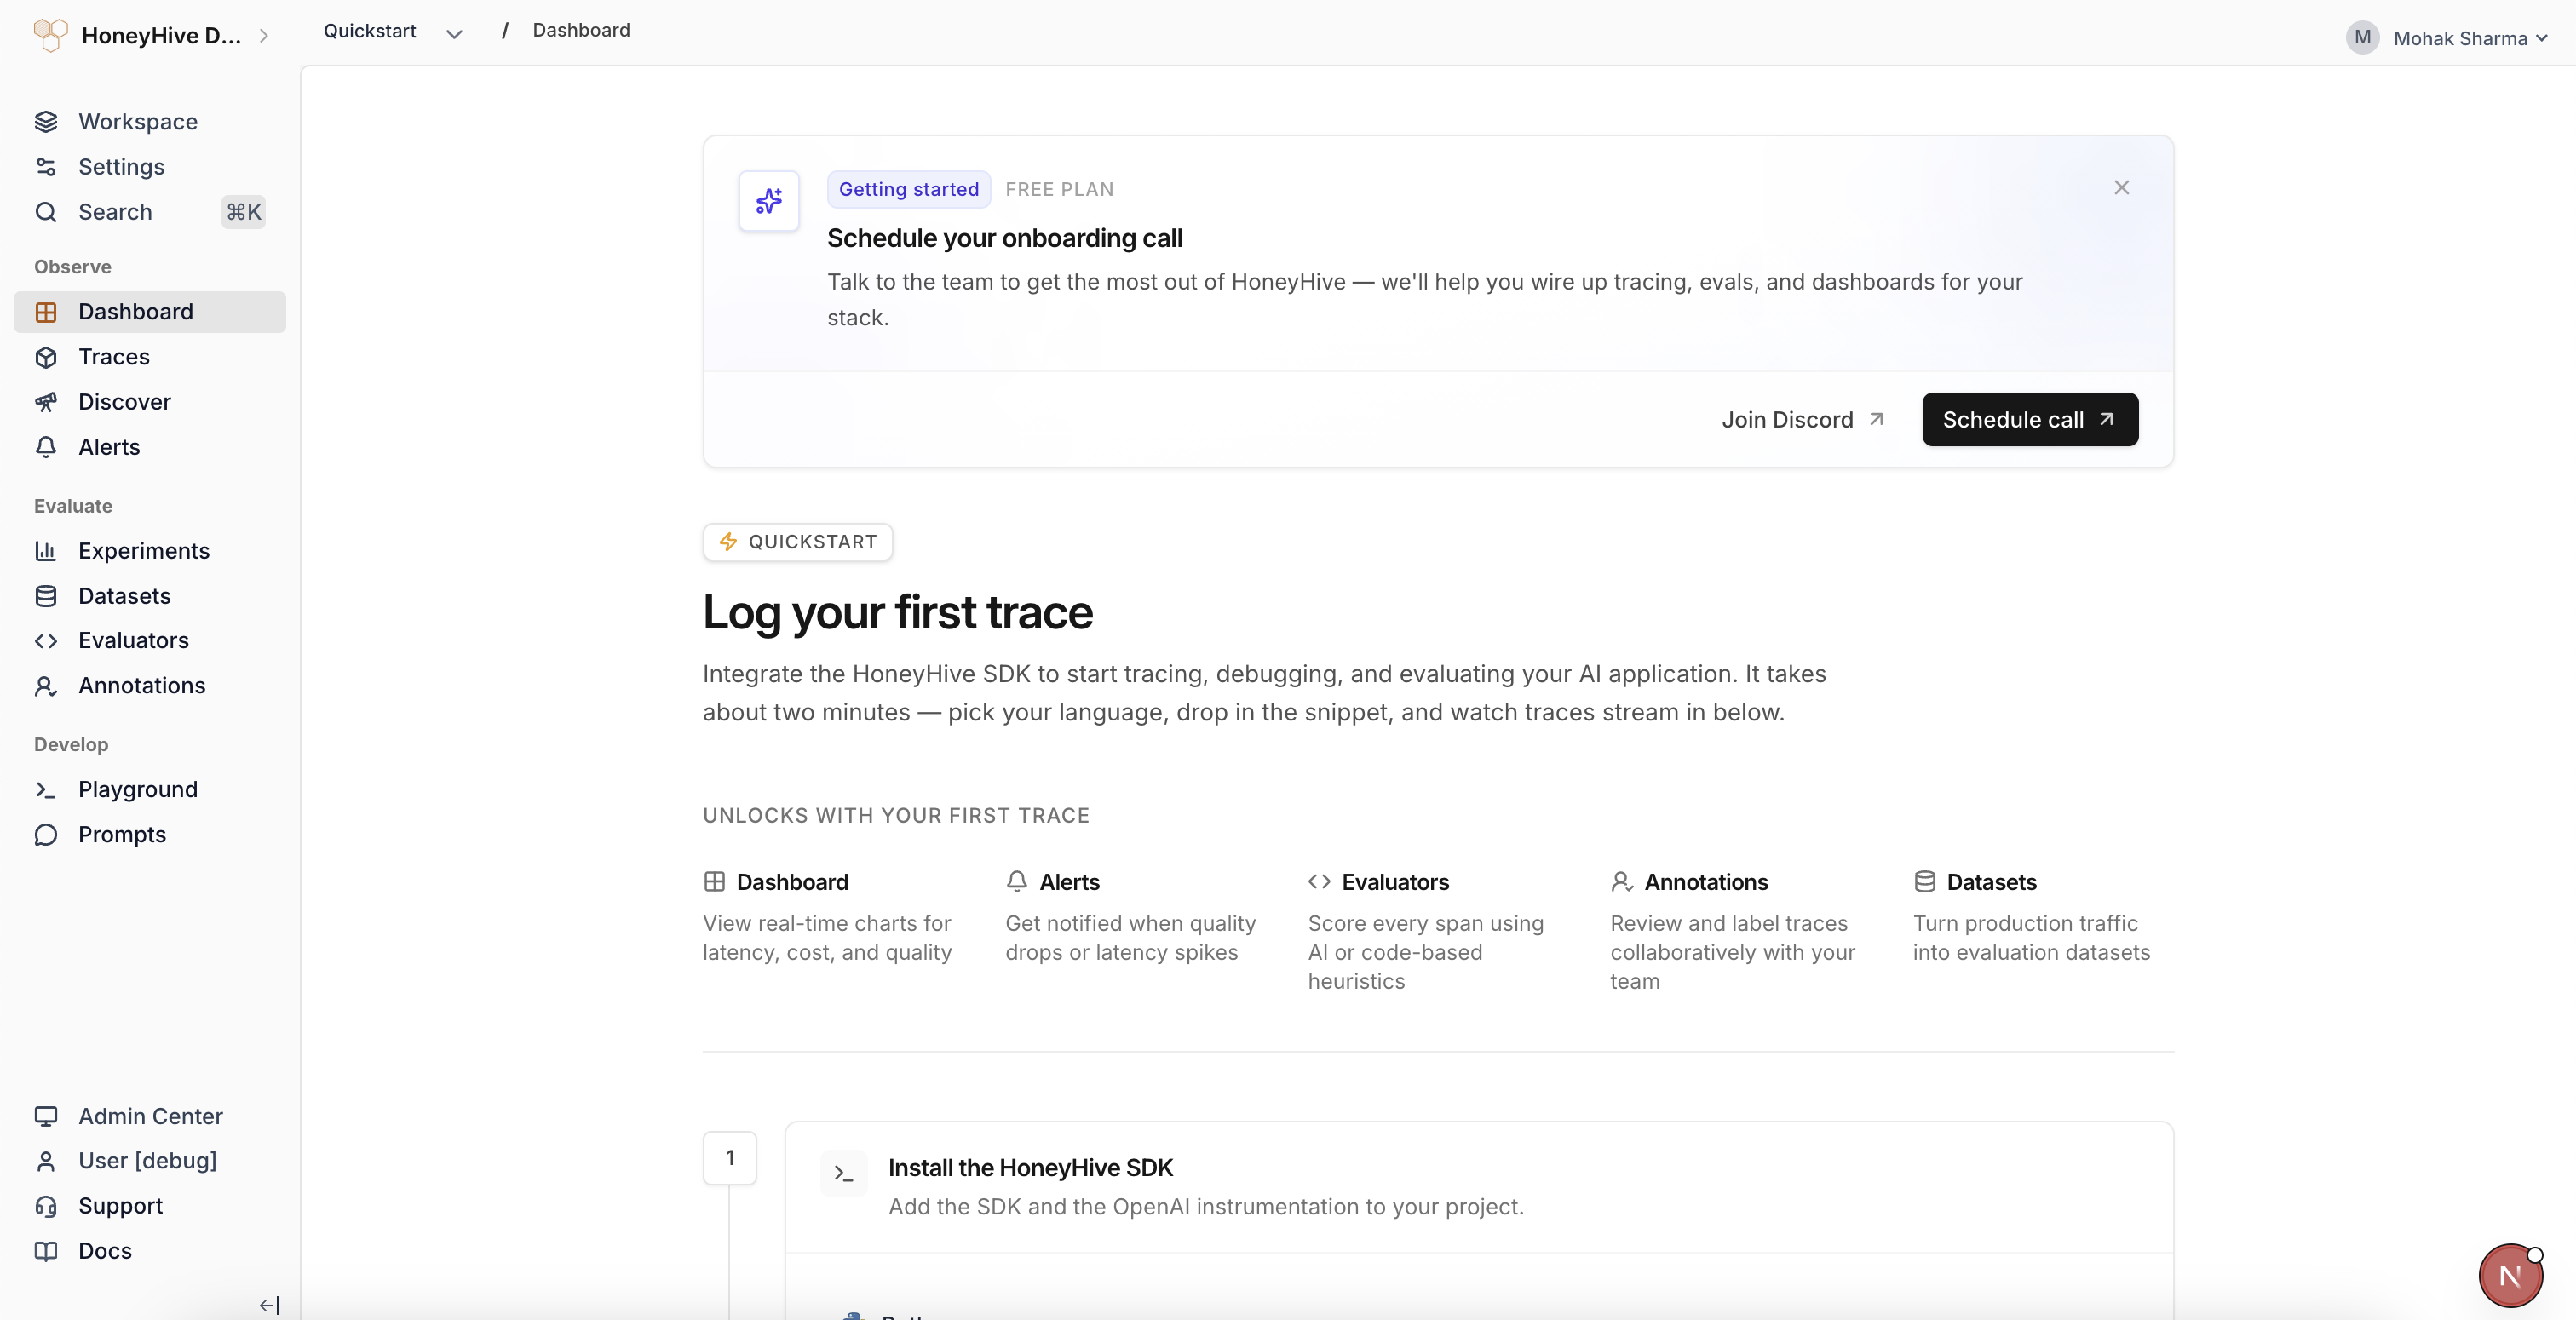 Project and experiment quickstarts now help you get from a fresh project to your first trace or experiment faster, so you can start using HoneyHive sooner.
### Action Required
**The following changes may require action on your part**
* **Workspace Templates permission needed for existing orgs.** To let Workspace Admins view and edit project-creation templates, add `workspace.templates.*` to your workspace admin role under Settings > Organization > Roles. New organizations get this automatically; the manual step is only needed for orgs created before this release. [Learn more about templates](/v2/workspace/templates)
### Improvements
* Evaluators that return categorical or string values now show a histogram of the top 5 values with frequency bars and counts in the session summary panel.
* Page-size selector added to event tables (Traces, Discover, and experiment run views) so you can control how many rows display per page.
* Hover tooltips now appear for long evaluator names in the Automated Evaluations panel.
* Tables across the app (Datasets, Evaluators, Runs, Members, scope selectors, and event tables) now share a consistent experience with unified pagination, sorting, column resizing, and row selection.
### Fixes
* Fixed OTLP/JSON ingestion rejecting valid payloads from JavaScript and TypeScript OpenTelemetry exporters. String-encoded integers, numeric enums, and hex-encoded trace/span IDs are now handled correctly, and malformed payloads return 400 instead of 500.
* Fixed Workspace Admins being unable to access the [Workspace Templates](/v2/workspace/templates) page due to missing default permissions. (See Action Required above for the manual step on existing orgs.)
* Fixed the side view jumping to the top when submitting a star rating in the feedback widget.
## Core Platform
### Project-Scoped URLs
All top-level routes (Traces, Datasets, Experiments, Evaluators, Playground, Prompts, Alerts, Dashboard, and Discover) are now nested under `/p/[projectId]/...`. Every URL now explicitly identifies which project it belongs to, so shared links always open the intended project regardless of who clicks them. Old bookmarks to bare URLs like `/traces` still work and redirect based on your current project cookie, but when sharing links with teammates, use the project-scoped form for accuracy.
### Org Admin Permission Inheritance (HoneyHive Cloud)
Org Admins on HoneyHive Cloud now automatically inherit membership and scope management permissions on all child workspaces and projects. You can manage workspace members, project settings, and scope configurations without needing an explicit role on each one. Self-hosted deployments with custom RBAC configurations are not affected unless you manually adopt the updated role definitions.
[Learn more about permission inheritance](/v2/workspace/roles#permission-inheritance)
### Chart Data via API Keys
You can now query dashboard chart data programmatically using project-scoped API keys. This opens up workflows like pulling chart data into external dashboards, automated reporting, or custom monitoring pipelines.
### Action Required
**The following changes may require action on your part**
* **Custom Python evaluator timeout reduced from 10s to 100ms.** If you have custom Python evaluators that perform heavy operations (large pandas transformations, complex regex on big payloads), they may now time out. Profile and optimize affected evaluators, or split work across multiple lighter evaluators.
* **`POST /v1/events/export` deprecated.** Use `POST /v1/events/search` instead. The old `/export` route still works but will be removed in a future release.
* **`POST /events/model` and `POST /events/model/batch` deprecated.** Use `POST /v1/events` with `event_type="model"` instead. The legacy routes continue to work.
* **Legacy `DELETE /v1/datasets` query-based routes deprecated.** Migrate to the new path-based `DELETE /v1/datasets/{dataset_id}` and `DELETE /v1/datasets/{dataset_id}/datapoints/{datapoint_id}` routes.
### Improvements
* Workspace Admins now receive `workspace.templates.*` permissions on newly created organizations, so they can view and edit workspace-scoped project templates. Existing organizations should add `workspace.templates.*` to the Workspace Admin role in **Settings > Organization > Roles**.
* Scope settings (org, workspace, project) now have a dedicated General tab with edit and delete in one place. Delete confirmation requires typing the scope name.
* New Account Settings tab for updating your display name and viewing your account ID and email. Display name editing is not available when SSO is enabled (your identity provider manages it).
* Datasets page now uses a sortable table layout instead of cards.
* The evaluator detail page now includes an Enabled toggle for quickly enabling or disabling an evaluator without navigating to settings.
* Latest OpenAI, Anthropic, and Gemini models added to the provider config dropdown.
* Your API URL is now displayed on the API Keys page, helpful when working with multi-dataplane deployments.
* Email notifications are now sent when you are added to an organization, workspace, or project.
* OTLP trace batch body limit raised from 10 MB to 50 MB on `/opentelemetry/v1/traces` for large agentic traces.
* Traces table now fits the viewport with pinned pagination for smoother browsing across Discover, experiments, and trace run views.
* Experiment runs list and chart now auto-refresh every 15 seconds while the tab is focused, so in-flight runs update without a manual reload.
* **Tracing integration improvements:**
* [AWS Strands](/v2/integrations/strands) and [AWS Bedrock](/v2/integrations/aws_bedrock) now route inputs and outputs correctly into the Inputs/Outputs panels instead of dumping them to metadata.
* [CrewAI](/v2/integrations/crewai) spans now display named `Crew` identifiers instead of raw UUIDs.
* [PydanticAI](/v2/integrations/pydantic-ai) v3 tool call arguments and results now populate the Inputs/Outputs panels instead of landing in metadata.
* [OpenAI Agents](/v2/integrations/openai-agents) spans now use meaningful names and route inputs and outputs into the correct panels.
* [Azure OpenAI](/v2/integrations/azure_openai) integration now captures inputs and outputs properly.
* [Semantic Kernel](/v2/integrations/semantic-kernel) `invoke_agent` events now show inputs and outputs in the UI instead of only appearing in metadata.
* Multiple browser tabs now coordinate sign-in/sign-out state, fixing intermittent "session expired immediately on login" issues.
### Fixes
* Fixed a timestamp drift of up to 7 hours on session aggregate times in non-UTC environments.
* Fixed `error exists` / `error not exists` trace filters matching every event or none instead of filtering correctly.
* Fixed newline characters in error displays rendering as literal `\n` instead of actual line breaks. Python tracebacks are readable again.
* Fixed boolean-valued evaluator scores not being counted in usage reports.
* Fixed the "All" time period and "Download Report" buttons being disabled in usage reports when legacy events exist alongside current data.
* Fixed trace side view not loading when opening a direct event link with an empty events list.
* Fixed the auth error page not offering a sign-out option, which previously required manual cookie clearing to recover.
* Fixed workspace members not being able to see AI provider settings.
* Fixed experiment run comparisons silently returning empty results when evaluator data spanned multiple event types.
* Fixed dropdown menus being clipped behind sticky table headers.
* Fixed experiment run details returning 500 errors in multi-dataplane deployments when the request was routed to the wrong data plane.
* Fixed the Human Annotations widget failing to save in certain deployment configurations.
* Fixed experiment table row selection and select-all checkboxes not working.
* Fixed `$gte` / `$lte` filter operators being silently ignored on events and sessions queries.
* Fixed session tree views not honoring explicit `parent_id` chains, which could flatten well-defined parent-child structures.
* Fixed evaluator processing holding slots for minutes during backend outages instead of failing fast. Timeouts are now configurable via `PYTHON_METRIC_TIMEOUT_MS` and `LLM_PROXY_TIMEOUT_MS`.
* Fixed auto-disabled evaluators not staying disabled across all service instances.
* Fixed OTLP model and tool spans being incorrectly reclassified as "chain" type when they have child spans.
* Invalid `event_id` and `session_id` values now return clear 400 errors with the expected UUID format instead of failing silently downstream.
* Server-side evaluators no longer error on non-OpenAI providers when `temperature` is configured.
### Security
* Webhook URLs (which may embed tokens) and notification email addresses are no longer logged in plaintext.
* Security patches applied for third-party dependencies (litellm, fast-xml-builder, protobufjs, aiohttp, urllib3).
## Core Platform
### Default Evaluator Sampling Changed to 10%
New evaluators now default to a **10% sampling percentage** instead of 100%. This reduces cost for LLM-based evaluators at high trace volumes. Adjust the sampling percentage in the evaluator settings if you need higher coverage.
## Core Platform
### Faster First Project Setup
New organizations now include a starter workspace and project automatically. You can create an API key and send traces right away, then add more workspaces or projects later when you need separate team boundaries or application environments.
[Learn more about workspaces and projects](/v2/workspace/organization-hierarchy)
## Python SDK
### v1.0.0rc22
* New **OpenAI Agents** integration via OpenInference. Install with `pip install "honeyhive[openinference-openai-agents]"` to trace single-agent runs, multi-agent handoffs, and agents-as-tools flows. [Learn more →](/v2/integrations/openai-agents)
* New **LangChain + LangGraph** integration. Install with `pip install "honeyhive[openinference-langchain]"` (OpenInference) or `pip install "honeyhive[traceloop-langchain]"` (Traceloop). One install covers both LangChain chains/agents and LangGraph `StateGraph` workflows. [LangChain →](/v2/integrations/langchain) | [LangGraph →](/v2/integrations/langgraph)
* New **AWS Strands Agents** integration. Install with `pip install "honeyhive[aws-strands]"`. Strands emits OpenTelemetry spans natively, so the `HoneyHiveTracer` global TracerProvider is picked up automatically without a separate instrumentor. [Learn more →](/v2/integrations/strands)
* Anthropic, LangChain, and AWS Bedrock integration examples and docs refreshed to current model IDs and modern usage patterns. [Anthropic →](/v2/integrations/anthropic) | [LangChain →](/v2/integrations/langchain) | [Bedrock →](/v2/integrations/aws_bedrock)
* Numeric and boolean span attributes now preserve their original types through OTLP export instead of being converted to strings.
* Mixed-library spans in the same batch (e.g. `pydantic-ai` + `httpx`) are now grouped under their correct instrumentation scope, fixing event misclassification.
* Event creation now validates the required `event_type` field at request-construction time, raising `pydantic.ValidationError` instead of a server-side error after the round-trip. Same root cause, different exception type.
### Action Required
**The following changes may require action on your part**
* **OpenTelemetry minimum bumped from 1.20.0 to 1.41.0.** Update `opentelemetry-api`, `opentelemetry-sdk`, and `opentelemetry-exporter-otlp-proto-http` if your environment pins older versions. Traceloop instrumentor floors also raised to >= 0.58.0.
* **Evaluation datasets now use `ground_truth` instead of `ground_truths`.** Update dataset datapoints and evaluator parameters to the singular name so evaluator scores, templates, and the UI can read reference values consistently.
* **Response result fields are now typed Pydantic models instead of dicts.** Affects `client.events.export()` / `.get_by_session_id()`, `client.datapoints.create()` / `.update()`, `client.datasets.create()` / `.update()` / `.delete()`, and `client.metrics.list()` / `get_metric()`. Read nested fields with attribute access: `response.result["insertedIds"][0]` becomes `response.result.insertedIds[0]`. Call `.model_dump()` if you still need the dict form. The full per-endpoint migration table, validation steps, and edge cases live in the [SDK migration skill](https://github.com/honeyhiveai/python-sdk/blob/v1.0.0rc22/.agents/skills/migrate-to-1-0-0rc22/SKILL.md). AI coding assistants can invoke the `migrate-to-1-0-0rc22` skill directly.
## Core Platform
### Annotation Queue Automations
Annotation queues now support filter-based automations. Define filter criteria on a queue, and matching events are automatically routed to it for human review. You can also add events to queues directly from the trace list, making it faster to build review workflows without leaving your debugging context.
[Learn more about annotation queues](/v2/evaluation/annotation-queues)
### AutoGen and Google ADK Tracing
AutoGen and Google ADK traces now ingest correctly over OTLP. If you use either framework, your spans appear in HoneyHive without additional configuration.
[AutoGen integration](/v2/integrations/autogen) | [Google ADK integration](/v2/integrations/google-adk)
### Graph View for OpenAI Agent Traces
The graph view now renders distinct agent nodes and handoff edges for OpenAI agent traces, instead of collapsing all agents into a single node. This makes multi-agent flows easier to follow visually.
[Learn more](/v2/tracing/graph-view)
### Improvements
* Scope creation is simpler: you no longer need to enter a separate unique name when creating an organization, workspace, or project. The display label is all you need.
* Agent names are now consistent across all trace views (tree, trajectory, thread, and event details), with human-readable names from span metadata taking priority over internal IDs.
* Inaccessible organizations, workspaces, and projects now appear as disabled rows in selector tables with a tooltip explaining who to contact for access.
* Usage reports now sort most-recent-first for quicker access to current data.
* The members page scope selector now shows all workspaces across every data plane you have list access to, not just the currently selected parent.
### Fixes
* OTLP-ingested events now preserve the `source` field set in your tracing configuration (e.g., `production`, `staging`) instead of being overwritten.
* Tool schemas are no longer dropped during ingestion for chat completion spans. Tool configurations now display correctly in trace details.
* Admin Center pages now redirect users without access to the home page instead of showing broken content.
* Traceloop-instrumented LangChain spans are no longer silently dropped during OTLP ingestion.
* Malformed session and event IDs now return clear 404 responses instead of 500 errors.
* Automated evaluators now run correctly on events ingested via the API.
### Security
* Custom Python evaluators now block additional filesystem and network access paths for stronger sandbox isolation.
* Security patches applied for third-party dependencies (including CVE-2026-39892).
## Core Platform
### Coding Agent and Multi-Agent Evaluator Templates
12 new LLM evaluator templates are now available across two new categories. **Coding Agent** templates help you evaluate task categorization, work type, complexity, and prompt specificity. **Multi-Agent** templates cover handoff completeness, integration coherence, scope adherence, escalation appropriateness, information sufficiency, role clarity, and retrospective quality. Use these to quickly set up evaluation for your agent applications without writing prompts from scratch.
[Browse evaluator templates](/v2/evaluators/evaluator-templates)
### Action Required
* **OpenAPI spec update: `event_id` and `session_id` now required in create-event responses.** These fields were always returned by the API but were previously marked as optional in the spec. If you generate client code from the OpenAPI spec, regenerate your client to pick up the corrected types.
### Improvements
* Settings pages (Admin Keys, Roles, Templates) now use permission-based access control instead of plan-based gates. Users without the required permission see a clear "no permission" message rather than "Available on Enterprise plan."
## Core Platform
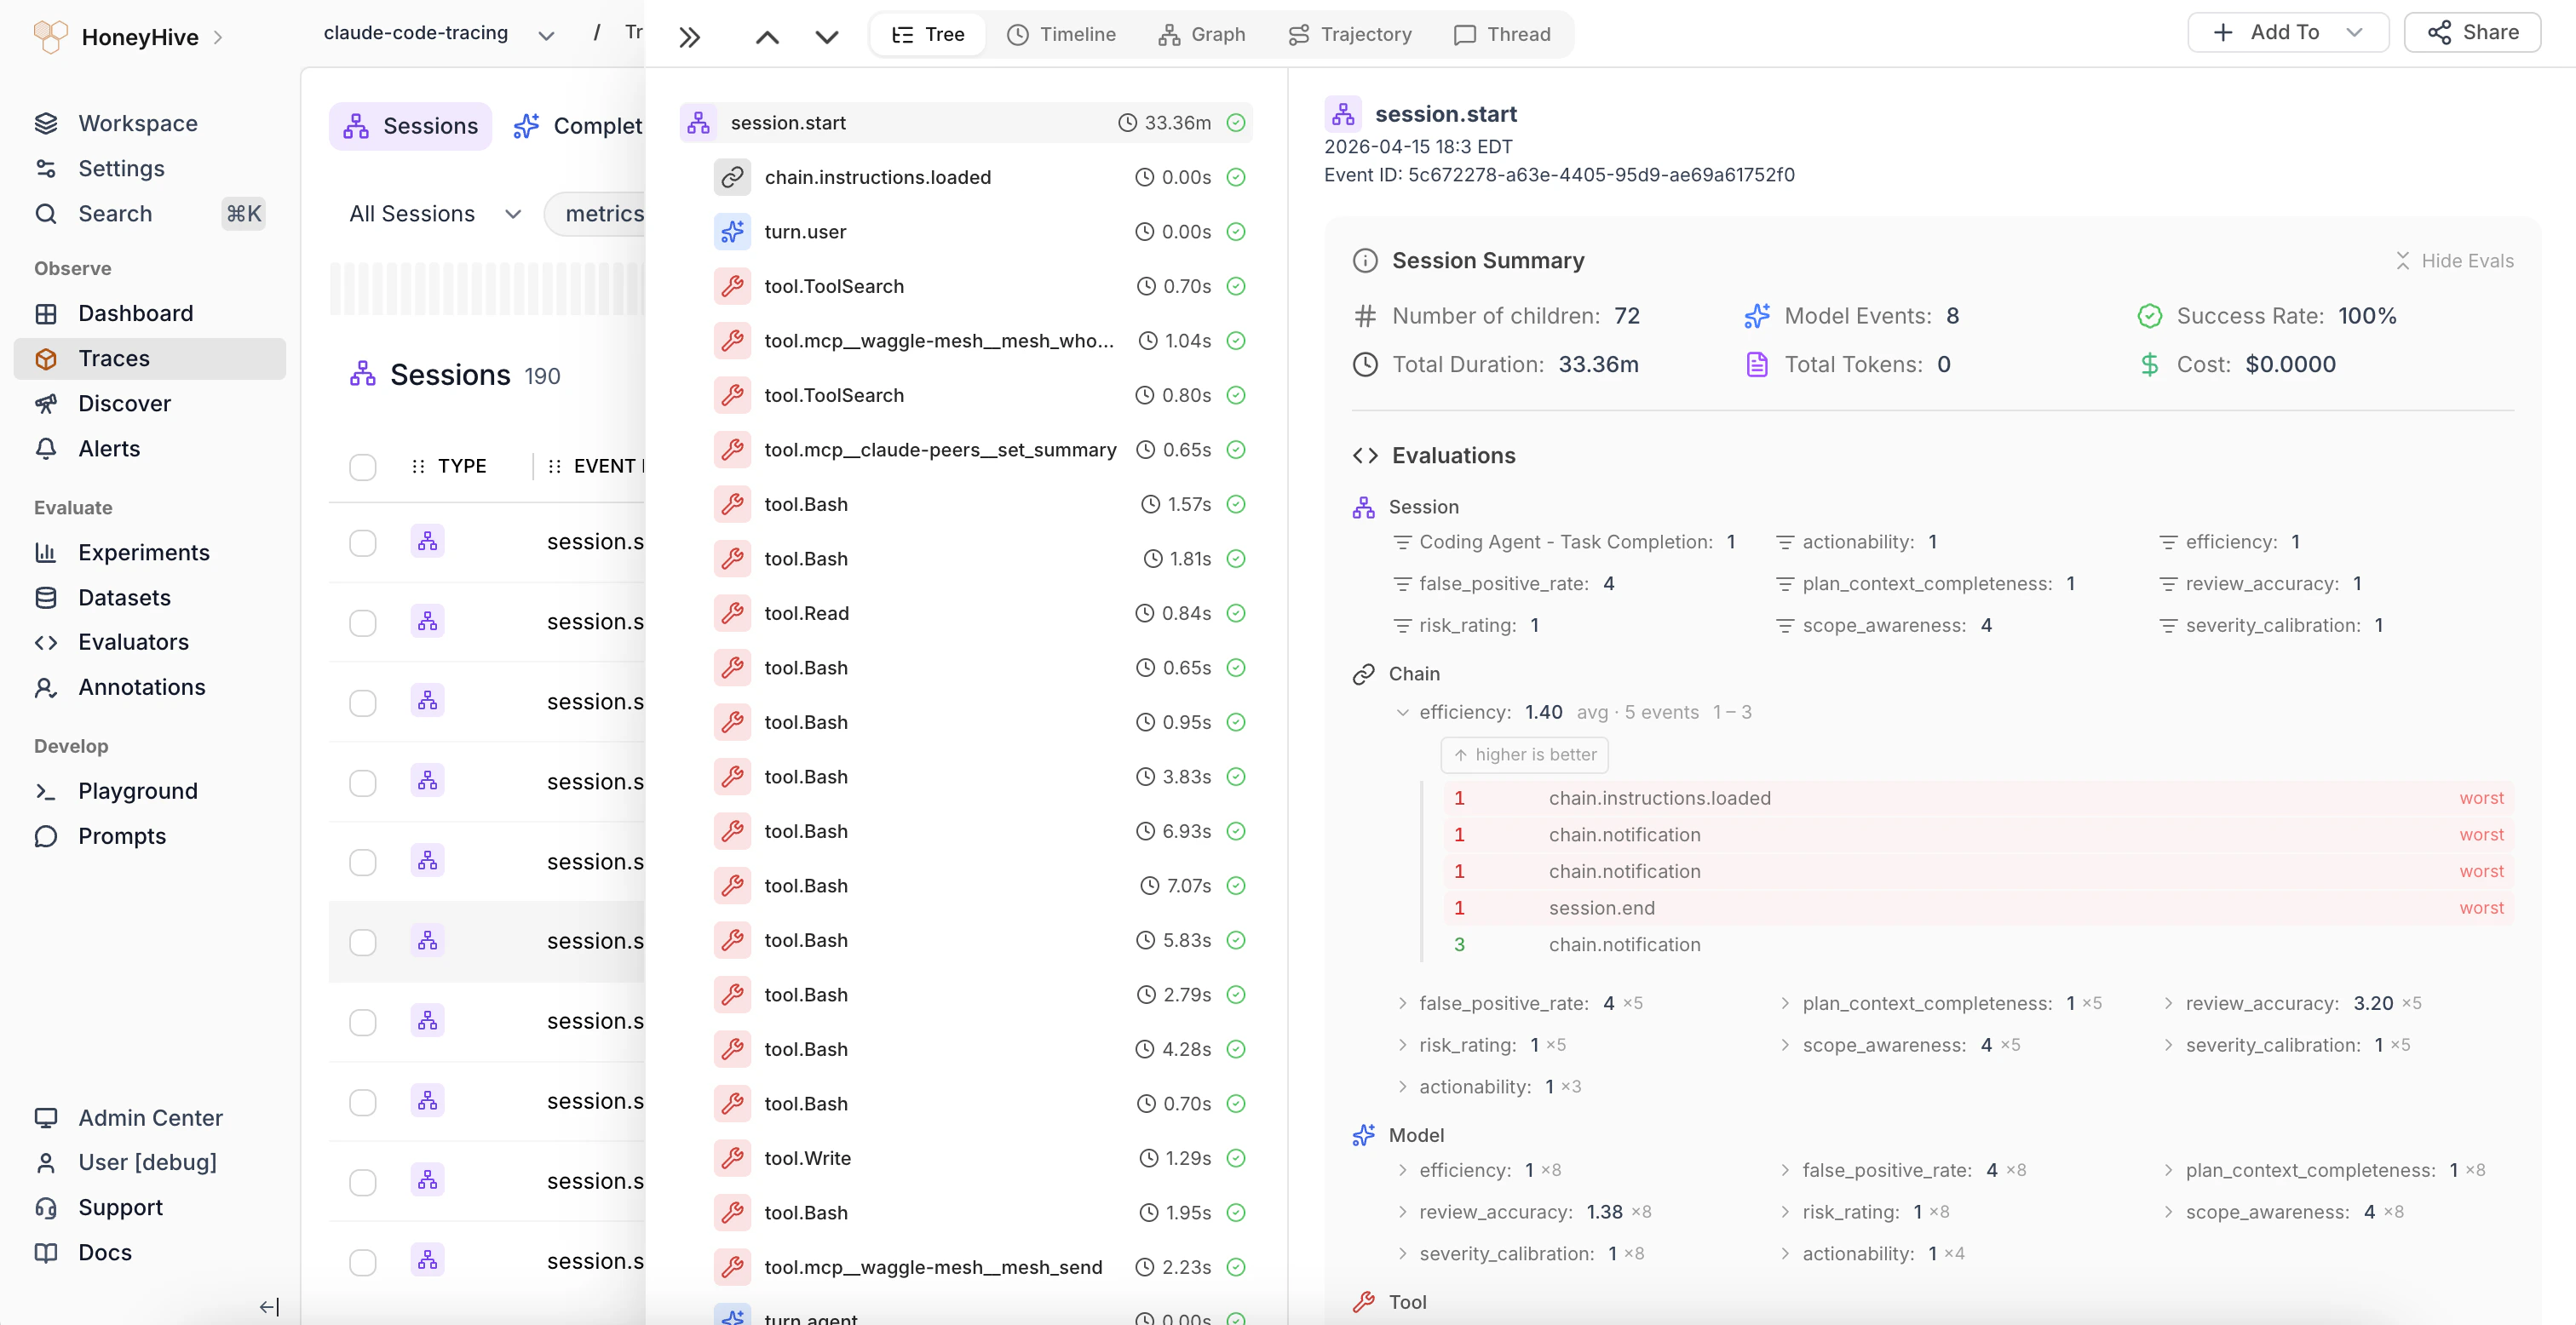
### Session Summary and Trajectory Visualization
The session side view now displays **aggregated evaluator scores and feedback** in the summary panel. When the same evaluator runs on multiple child spans, results are grouped with count, average, min, and max. Click a grouped metric to expand per-span values, color-coded to highlight outliers.
Project and experiment quickstarts now help you get from a fresh project to your first trace or experiment faster, so you can start using HoneyHive sooner.
### Action Required
**The following changes may require action on your part**
* **Workspace Templates permission needed for existing orgs.** To let Workspace Admins view and edit project-creation templates, add `workspace.templates.*` to your workspace admin role under Settings > Organization > Roles. New organizations get this automatically; the manual step is only needed for orgs created before this release. [Learn more about templates](/v2/workspace/templates)
### Improvements
* Evaluators that return categorical or string values now show a histogram of the top 5 values with frequency bars and counts in the session summary panel.
* Page-size selector added to event tables (Traces, Discover, and experiment run views) so you can control how many rows display per page.
* Hover tooltips now appear for long evaluator names in the Automated Evaluations panel.
* Tables across the app (Datasets, Evaluators, Runs, Members, scope selectors, and event tables) now share a consistent experience with unified pagination, sorting, column resizing, and row selection.
### Fixes
* Fixed OTLP/JSON ingestion rejecting valid payloads from JavaScript and TypeScript OpenTelemetry exporters. String-encoded integers, numeric enums, and hex-encoded trace/span IDs are now handled correctly, and malformed payloads return 400 instead of 500.
* Fixed Workspace Admins being unable to access the [Workspace Templates](/v2/workspace/templates) page due to missing default permissions. (See Action Required above for the manual step on existing orgs.)
* Fixed the side view jumping to the top when submitting a star rating in the feedback widget.
## Core Platform
### Project-Scoped URLs
All top-level routes (Traces, Datasets, Experiments, Evaluators, Playground, Prompts, Alerts, Dashboard, and Discover) are now nested under `/p/[projectId]/...`. Every URL now explicitly identifies which project it belongs to, so shared links always open the intended project regardless of who clicks them. Old bookmarks to bare URLs like `/traces` still work and redirect based on your current project cookie, but when sharing links with teammates, use the project-scoped form for accuracy.
### Org Admin Permission Inheritance (HoneyHive Cloud)
Org Admins on HoneyHive Cloud now automatically inherit membership and scope management permissions on all child workspaces and projects. You can manage workspace members, project settings, and scope configurations without needing an explicit role on each one. Self-hosted deployments with custom RBAC configurations are not affected unless you manually adopt the updated role definitions.
[Learn more about permission inheritance](/v2/workspace/roles#permission-inheritance)
### Chart Data via API Keys
You can now query dashboard chart data programmatically using project-scoped API keys. This opens up workflows like pulling chart data into external dashboards, automated reporting, or custom monitoring pipelines.
### Action Required
**The following changes may require action on your part**
* **Custom Python evaluator timeout reduced from 10s to 100ms.** If you have custom Python evaluators that perform heavy operations (large pandas transformations, complex regex on big payloads), they may now time out. Profile and optimize affected evaluators, or split work across multiple lighter evaluators.
* **`POST /v1/events/export` deprecated.** Use `POST /v1/events/search` instead. The old `/export` route still works but will be removed in a future release.
* **`POST /events/model` and `POST /events/model/batch` deprecated.** Use `POST /v1/events` with `event_type="model"` instead. The legacy routes continue to work.
* **Legacy `DELETE /v1/datasets` query-based routes deprecated.** Migrate to the new path-based `DELETE /v1/datasets/{dataset_id}` and `DELETE /v1/datasets/{dataset_id}/datapoints/{datapoint_id}` routes.
### Improvements
* Workspace Admins now receive `workspace.templates.*` permissions on newly created organizations, so they can view and edit workspace-scoped project templates. Existing organizations should add `workspace.templates.*` to the Workspace Admin role in **Settings > Organization > Roles**.
* Scope settings (org, workspace, project) now have a dedicated General tab with edit and delete in one place. Delete confirmation requires typing the scope name.
* New Account Settings tab for updating your display name and viewing your account ID and email. Display name editing is not available when SSO is enabled (your identity provider manages it).
* Datasets page now uses a sortable table layout instead of cards.
* The evaluator detail page now includes an Enabled toggle for quickly enabling or disabling an evaluator without navigating to settings.
* Latest OpenAI, Anthropic, and Gemini models added to the provider config dropdown.
* Your API URL is now displayed on the API Keys page, helpful when working with multi-dataplane deployments.
* Email notifications are now sent when you are added to an organization, workspace, or project.
* OTLP trace batch body limit raised from 10 MB to 50 MB on `/opentelemetry/v1/traces` for large agentic traces.
* Traces table now fits the viewport with pinned pagination for smoother browsing across Discover, experiments, and trace run views.
* Experiment runs list and chart now auto-refresh every 15 seconds while the tab is focused, so in-flight runs update without a manual reload.
* **Tracing integration improvements:**
* [AWS Strands](/v2/integrations/strands) and [AWS Bedrock](/v2/integrations/aws_bedrock) now route inputs and outputs correctly into the Inputs/Outputs panels instead of dumping them to metadata.
* [CrewAI](/v2/integrations/crewai) spans now display named `Crew` identifiers instead of raw UUIDs.
* [PydanticAI](/v2/integrations/pydantic-ai) v3 tool call arguments and results now populate the Inputs/Outputs panels instead of landing in metadata.
* [OpenAI Agents](/v2/integrations/openai-agents) spans now use meaningful names and route inputs and outputs into the correct panels.
* [Azure OpenAI](/v2/integrations/azure_openai) integration now captures inputs and outputs properly.
* [Semantic Kernel](/v2/integrations/semantic-kernel) `invoke_agent` events now show inputs and outputs in the UI instead of only appearing in metadata.
* Multiple browser tabs now coordinate sign-in/sign-out state, fixing intermittent "session expired immediately on login" issues.
### Fixes
* Fixed a timestamp drift of up to 7 hours on session aggregate times in non-UTC environments.
* Fixed `error exists` / `error not exists` trace filters matching every event or none instead of filtering correctly.
* Fixed newline characters in error displays rendering as literal `\n` instead of actual line breaks. Python tracebacks are readable again.
* Fixed boolean-valued evaluator scores not being counted in usage reports.
* Fixed the "All" time period and "Download Report" buttons being disabled in usage reports when legacy events exist alongside current data.
* Fixed trace side view not loading when opening a direct event link with an empty events list.
* Fixed the auth error page not offering a sign-out option, which previously required manual cookie clearing to recover.
* Fixed workspace members not being able to see AI provider settings.
* Fixed experiment run comparisons silently returning empty results when evaluator data spanned multiple event types.
* Fixed dropdown menus being clipped behind sticky table headers.
* Fixed experiment run details returning 500 errors in multi-dataplane deployments when the request was routed to the wrong data plane.
* Fixed the Human Annotations widget failing to save in certain deployment configurations.
* Fixed experiment table row selection and select-all checkboxes not working.
* Fixed `$gte` / `$lte` filter operators being silently ignored on events and sessions queries.
* Fixed session tree views not honoring explicit `parent_id` chains, which could flatten well-defined parent-child structures.
* Fixed evaluator processing holding slots for minutes during backend outages instead of failing fast. Timeouts are now configurable via `PYTHON_METRIC_TIMEOUT_MS` and `LLM_PROXY_TIMEOUT_MS`.
* Fixed auto-disabled evaluators not staying disabled across all service instances.
* Fixed OTLP model and tool spans being incorrectly reclassified as "chain" type when they have child spans.
* Invalid `event_id` and `session_id` values now return clear 400 errors with the expected UUID format instead of failing silently downstream.
* Server-side evaluators no longer error on non-OpenAI providers when `temperature` is configured.
### Security
* Webhook URLs (which may embed tokens) and notification email addresses are no longer logged in plaintext.
* Security patches applied for third-party dependencies (litellm, fast-xml-builder, protobufjs, aiohttp, urllib3).
## Core Platform
### Default Evaluator Sampling Changed to 10%
New evaluators now default to a **10% sampling percentage** instead of 100%. This reduces cost for LLM-based evaluators at high trace volumes. Adjust the sampling percentage in the evaluator settings if you need higher coverage.
## Core Platform
### Faster First Project Setup
New organizations now include a starter workspace and project automatically. You can create an API key and send traces right away, then add more workspaces or projects later when you need separate team boundaries or application environments.
[Learn more about workspaces and projects](/v2/workspace/organization-hierarchy)
## Python SDK
### v1.0.0rc22
* New **OpenAI Agents** integration via OpenInference. Install with `pip install "honeyhive[openinference-openai-agents]"` to trace single-agent runs, multi-agent handoffs, and agents-as-tools flows. [Learn more →](/v2/integrations/openai-agents)
* New **LangChain + LangGraph** integration. Install with `pip install "honeyhive[openinference-langchain]"` (OpenInference) or `pip install "honeyhive[traceloop-langchain]"` (Traceloop). One install covers both LangChain chains/agents and LangGraph `StateGraph` workflows. [LangChain →](/v2/integrations/langchain) | [LangGraph →](/v2/integrations/langgraph)
* New **AWS Strands Agents** integration. Install with `pip install "honeyhive[aws-strands]"`. Strands emits OpenTelemetry spans natively, so the `HoneyHiveTracer` global TracerProvider is picked up automatically without a separate instrumentor. [Learn more →](/v2/integrations/strands)
* Anthropic, LangChain, and AWS Bedrock integration examples and docs refreshed to current model IDs and modern usage patterns. [Anthropic →](/v2/integrations/anthropic) | [LangChain →](/v2/integrations/langchain) | [Bedrock →](/v2/integrations/aws_bedrock)
* Numeric and boolean span attributes now preserve their original types through OTLP export instead of being converted to strings.
* Mixed-library spans in the same batch (e.g. `pydantic-ai` + `httpx`) are now grouped under their correct instrumentation scope, fixing event misclassification.
* Event creation now validates the required `event_type` field at request-construction time, raising `pydantic.ValidationError` instead of a server-side error after the round-trip. Same root cause, different exception type.
### Action Required
**The following changes may require action on your part**
* **OpenTelemetry minimum bumped from 1.20.0 to 1.41.0.** Update `opentelemetry-api`, `opentelemetry-sdk`, and `opentelemetry-exporter-otlp-proto-http` if your environment pins older versions. Traceloop instrumentor floors also raised to >= 0.58.0.
* **Evaluation datasets now use `ground_truth` instead of `ground_truths`.** Update dataset datapoints and evaluator parameters to the singular name so evaluator scores, templates, and the UI can read reference values consistently.
* **Response result fields are now typed Pydantic models instead of dicts.** Affects `client.events.export()` / `.get_by_session_id()`, `client.datapoints.create()` / `.update()`, `client.datasets.create()` / `.update()` / `.delete()`, and `client.metrics.list()` / `get_metric()`. Read nested fields with attribute access: `response.result["insertedIds"][0]` becomes `response.result.insertedIds[0]`. Call `.model_dump()` if you still need the dict form. The full per-endpoint migration table, validation steps, and edge cases live in the [SDK migration skill](https://github.com/honeyhiveai/python-sdk/blob/v1.0.0rc22/.agents/skills/migrate-to-1-0-0rc22/SKILL.md). AI coding assistants can invoke the `migrate-to-1-0-0rc22` skill directly.
## Core Platform
### Annotation Queue Automations
Annotation queues now support filter-based automations. Define filter criteria on a queue, and matching events are automatically routed to it for human review. You can also add events to queues directly from the trace list, making it faster to build review workflows without leaving your debugging context.
[Learn more about annotation queues](/v2/evaluation/annotation-queues)
### AutoGen and Google ADK Tracing
AutoGen and Google ADK traces now ingest correctly over OTLP. If you use either framework, your spans appear in HoneyHive without additional configuration.
[AutoGen integration](/v2/integrations/autogen) | [Google ADK integration](/v2/integrations/google-adk)
### Graph View for OpenAI Agent Traces
The graph view now renders distinct agent nodes and handoff edges for OpenAI agent traces, instead of collapsing all agents into a single node. This makes multi-agent flows easier to follow visually.
[Learn more](/v2/tracing/graph-view)
### Improvements
* Scope creation is simpler: you no longer need to enter a separate unique name when creating an organization, workspace, or project. The display label is all you need.
* Agent names are now consistent across all trace views (tree, trajectory, thread, and event details), with human-readable names from span metadata taking priority over internal IDs.
* Inaccessible organizations, workspaces, and projects now appear as disabled rows in selector tables with a tooltip explaining who to contact for access.
* Usage reports now sort most-recent-first for quicker access to current data.
* The members page scope selector now shows all workspaces across every data plane you have list access to, not just the currently selected parent.
### Fixes
* OTLP-ingested events now preserve the `source` field set in your tracing configuration (e.g., `production`, `staging`) instead of being overwritten.
* Tool schemas are no longer dropped during ingestion for chat completion spans. Tool configurations now display correctly in trace details.
* Admin Center pages now redirect users without access to the home page instead of showing broken content.
* Traceloop-instrumented LangChain spans are no longer silently dropped during OTLP ingestion.
* Malformed session and event IDs now return clear 404 responses instead of 500 errors.
* Automated evaluators now run correctly on events ingested via the API.
### Security
* Custom Python evaluators now block additional filesystem and network access paths for stronger sandbox isolation.
* Security patches applied for third-party dependencies (including CVE-2026-39892).
## Core Platform
### Coding Agent and Multi-Agent Evaluator Templates
12 new LLM evaluator templates are now available across two new categories. **Coding Agent** templates help you evaluate task categorization, work type, complexity, and prompt specificity. **Multi-Agent** templates cover handoff completeness, integration coherence, scope adherence, escalation appropriateness, information sufficiency, role clarity, and retrospective quality. Use these to quickly set up evaluation for your agent applications without writing prompts from scratch.
[Browse evaluator templates](/v2/evaluators/evaluator-templates)
### Action Required
* **OpenAPI spec update: `event_id` and `session_id` now required in create-event responses.** These fields were always returned by the API but were previously marked as optional in the spec. If you generate client code from the OpenAPI spec, regenerate your client to pick up the corrected types.
### Improvements
* Settings pages (Admin Keys, Roles, Templates) now use permission-based access control instead of plan-based gates. Users without the required permission see a clear "no permission" message rather than "Available on Enterprise plan."
## Core Platform
### Session Summary and Trajectory Visualization
The session side view now displays **aggregated evaluator scores and feedback** in the summary panel. When the same evaluator runs on multiple child spans, results are grouped with count, average, min, and max. Click a grouped metric to expand per-span values, color-coded to highlight outliers.
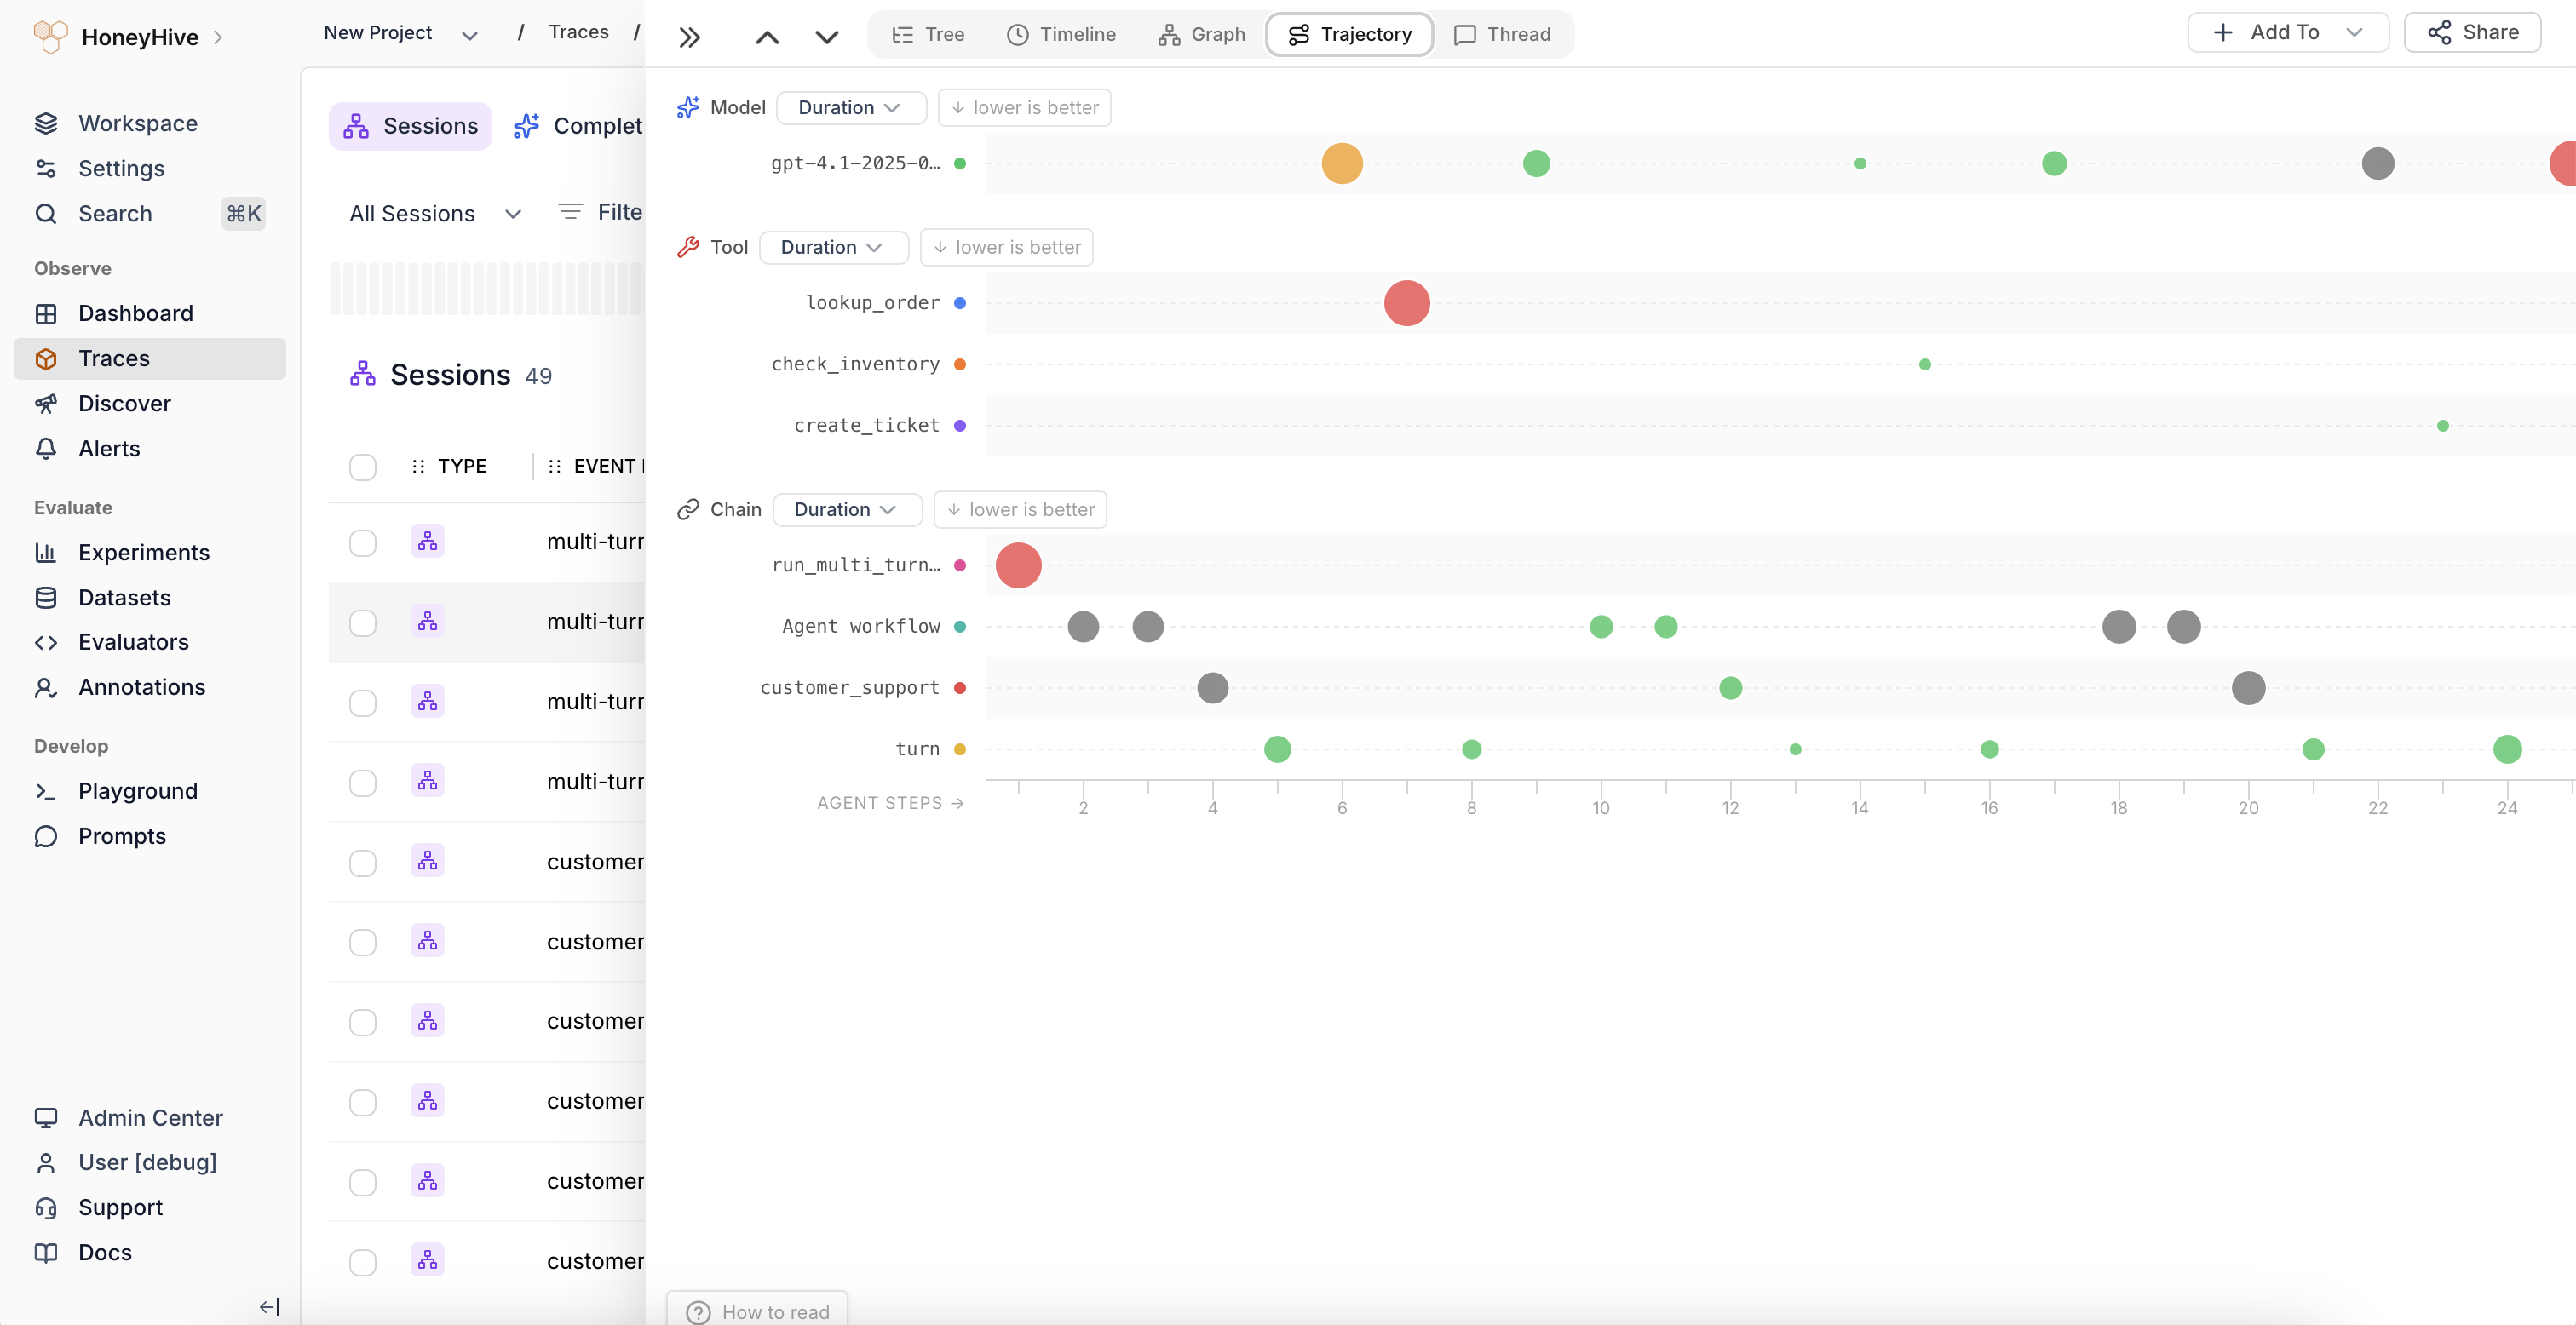
 A new **Trajectory tab** provides a visual fingerprint of agent sessions as a bubble chart. Each span appears as a bubble on a category-by-step grid, with bubble size encoding the selected metric (duration, cost, or evaluator scores) and color indicating relative performance. Useful for spotting behavioral patterns and anomalies across agent steps.
 [Explore your traces →](/v2/tracing/ui-flows#session-side-view)
## Python SDK
### v1.0.0rc21
* New **Claude Agent SDK** integration via OpenInference. Install with `pip install "honeyhive[openinference-claude-agent-sdk]"` to trace `query` calls, tool invocations, and multi-turn agent flows.
* New **LiteLLM** integration via OpenInference. Install with `pip install "honeyhive[openinference-litellm]"` to trace `completion`, `acompletion`, and `embedding` calls across all LiteLLM-supported providers. [Learn more →](/v2/integrations/litellm)
* New `skip_backend_session_creation` flag on `HoneyHiveTracer.init()`. When initializing a tracer with an existing `session_id`, set this to `True` to skip the synchronous session creation call during init. Useful for attaching spans to a session created by another service or a prior tracer run. [Learn more →](/v2/tracing/tracer-initialization#skipping-init-time-session-creation)
### Fixes
* `session_name` auto-detection now correctly identifies the caller script name instead of returning internal SDK filenames.
## Core Platform
### Usage Dashboard
A new **Usage** page in Organization Settings gives you visibility into your event consumption. View monthly and quarterly event counts, enrichment metrics (events with computed evaluator scores), cumulative QTD/YTD totals, and export reports as JSON or CSV. The detail view for each period includes an event type breakdown and a printable report.
[Explore your traces →](/v2/tracing/ui-flows#session-side-view)
## Python SDK
### v1.0.0rc21
* New **Claude Agent SDK** integration via OpenInference. Install with `pip install "honeyhive[openinference-claude-agent-sdk]"` to trace `query` calls, tool invocations, and multi-turn agent flows.
* New **LiteLLM** integration via OpenInference. Install with `pip install "honeyhive[openinference-litellm]"` to trace `completion`, `acompletion`, and `embedding` calls across all LiteLLM-supported providers. [Learn more →](/v2/integrations/litellm)
* New `skip_backend_session_creation` flag on `HoneyHiveTracer.init()`. When initializing a tracer with an existing `session_id`, set this to `True` to skip the synchronous session creation call during init. Useful for attaching spans to a session created by another service or a prior tracer run. [Learn more →](/v2/tracing/tracer-initialization#skipping-init-time-session-creation)
### Fixes
* `session_name` auto-detection now correctly identifies the caller script name instead of returning internal SDK filenames.
## Core Platform
### Usage Dashboard
A new **Usage** page in Organization Settings gives you visibility into your event consumption. View monthly and quarterly event counts, enrichment metrics (events with computed evaluator scores), cumulative QTD/YTD totals, and export reports as JSON or CSV. The detail view for each period includes an event type breakdown and a printable report.
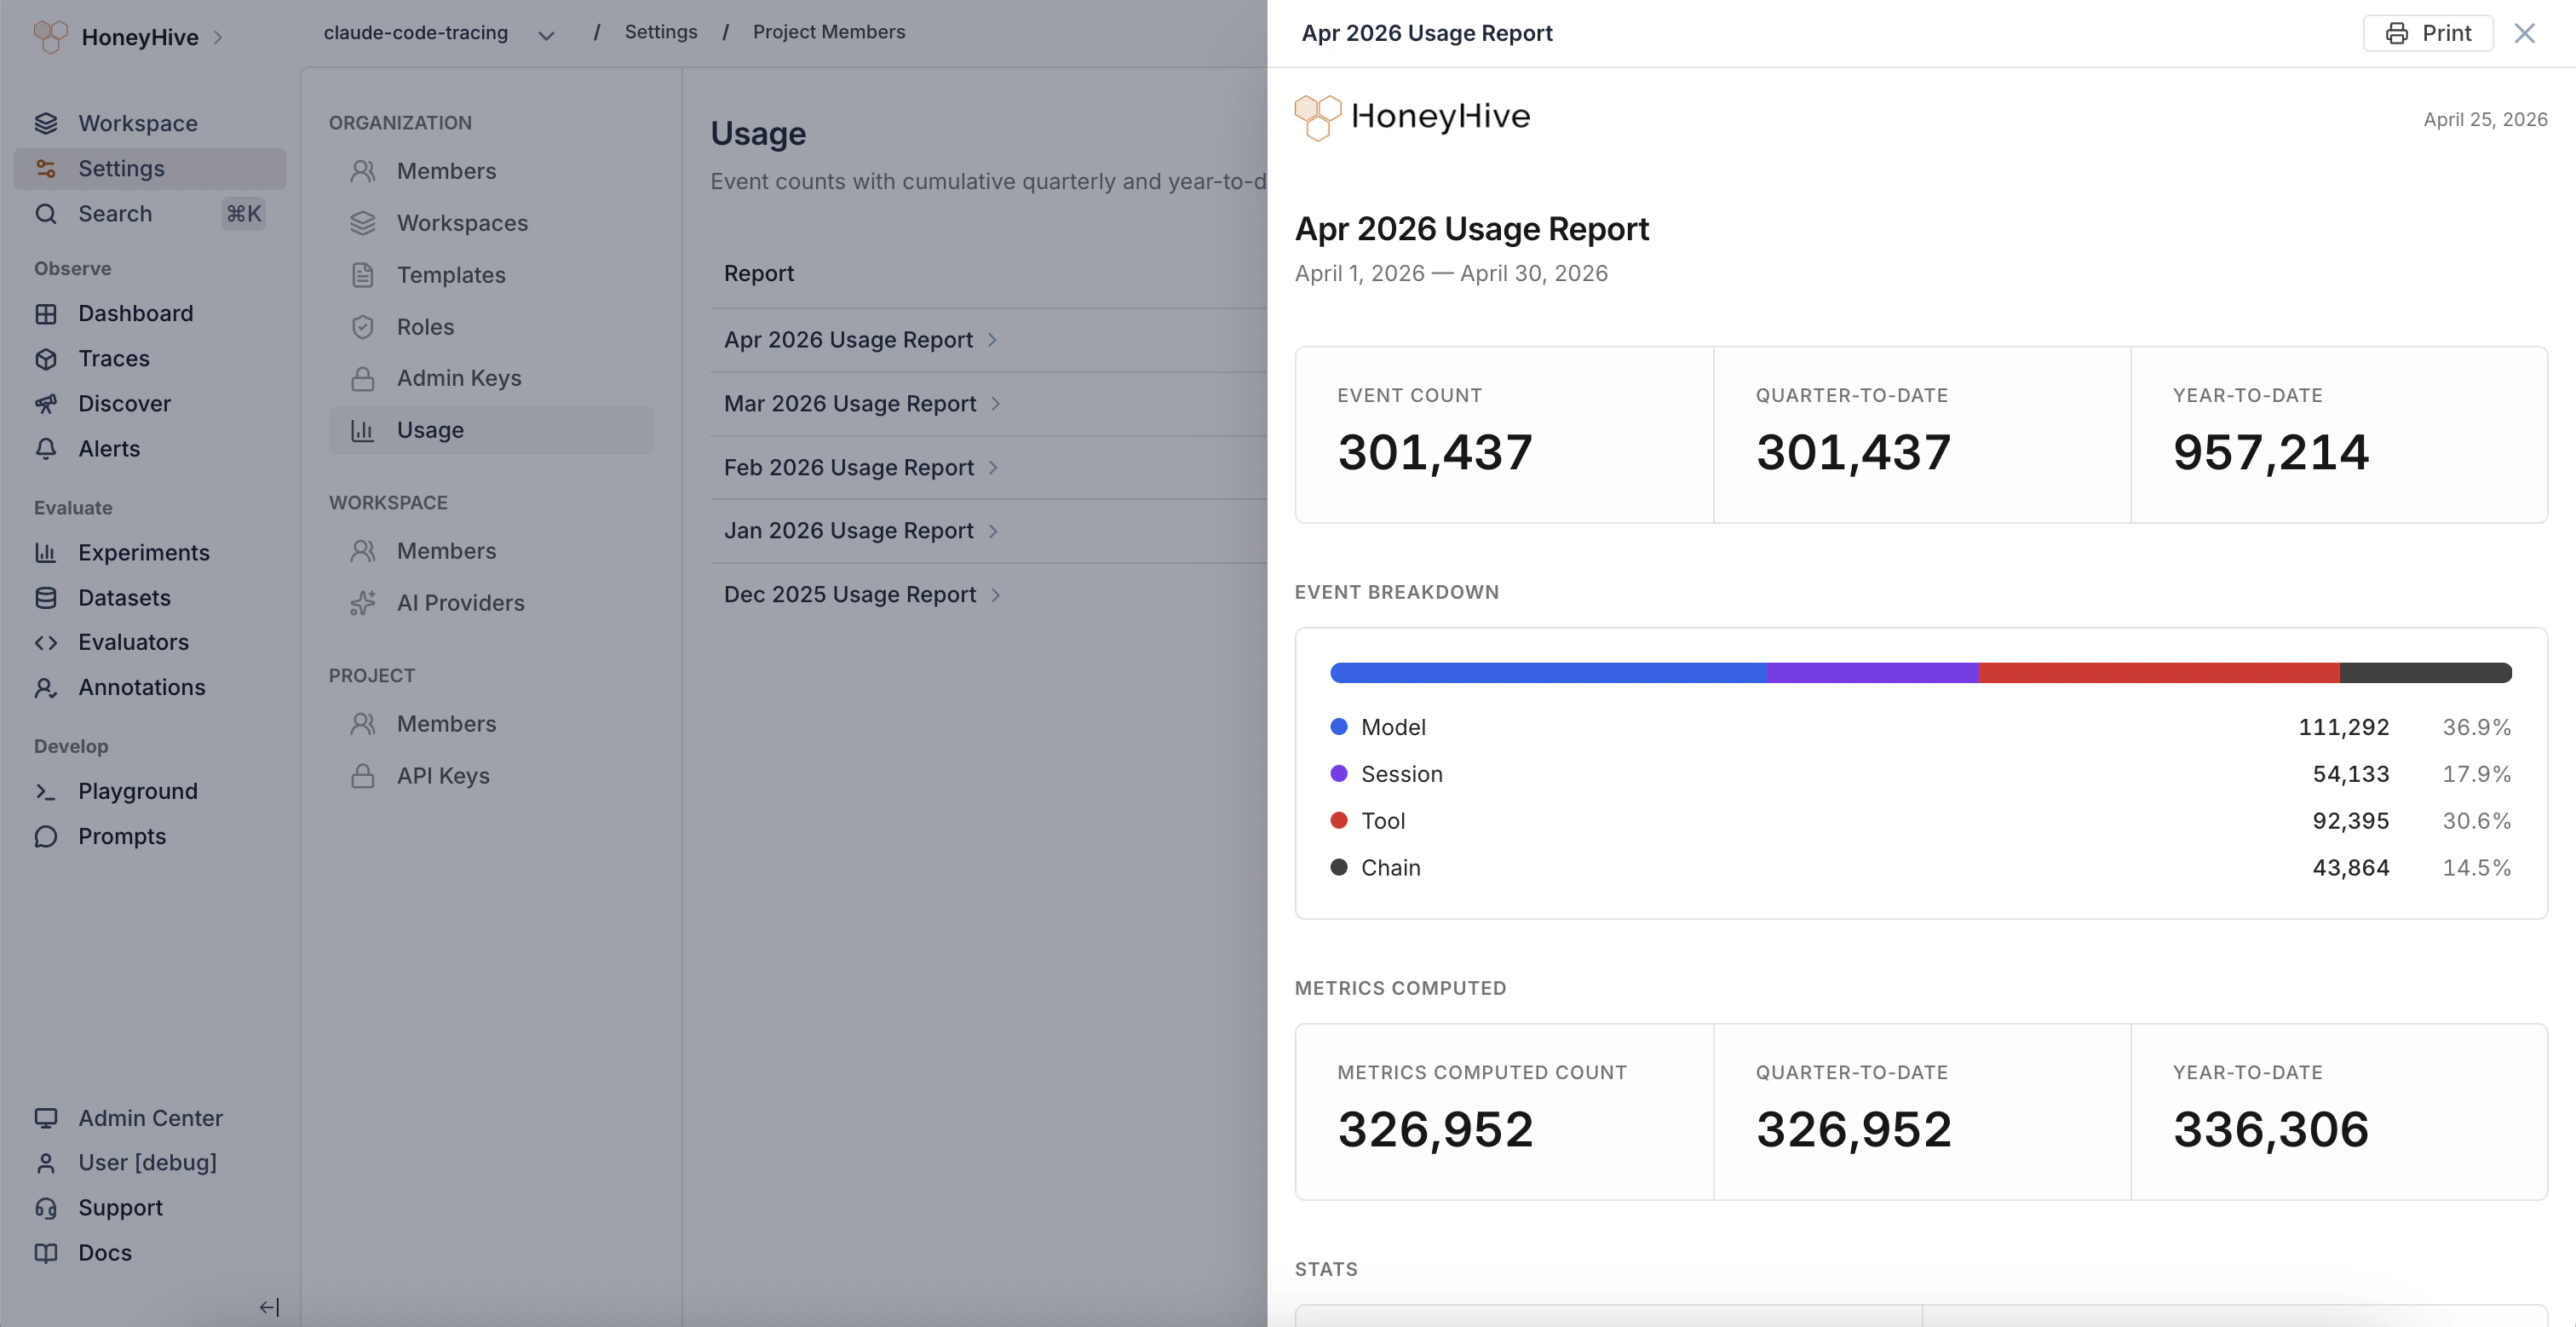 Requires the `org.analytics.query` permission.
[Learn more about usage reporting](/v2/workspace/usage)
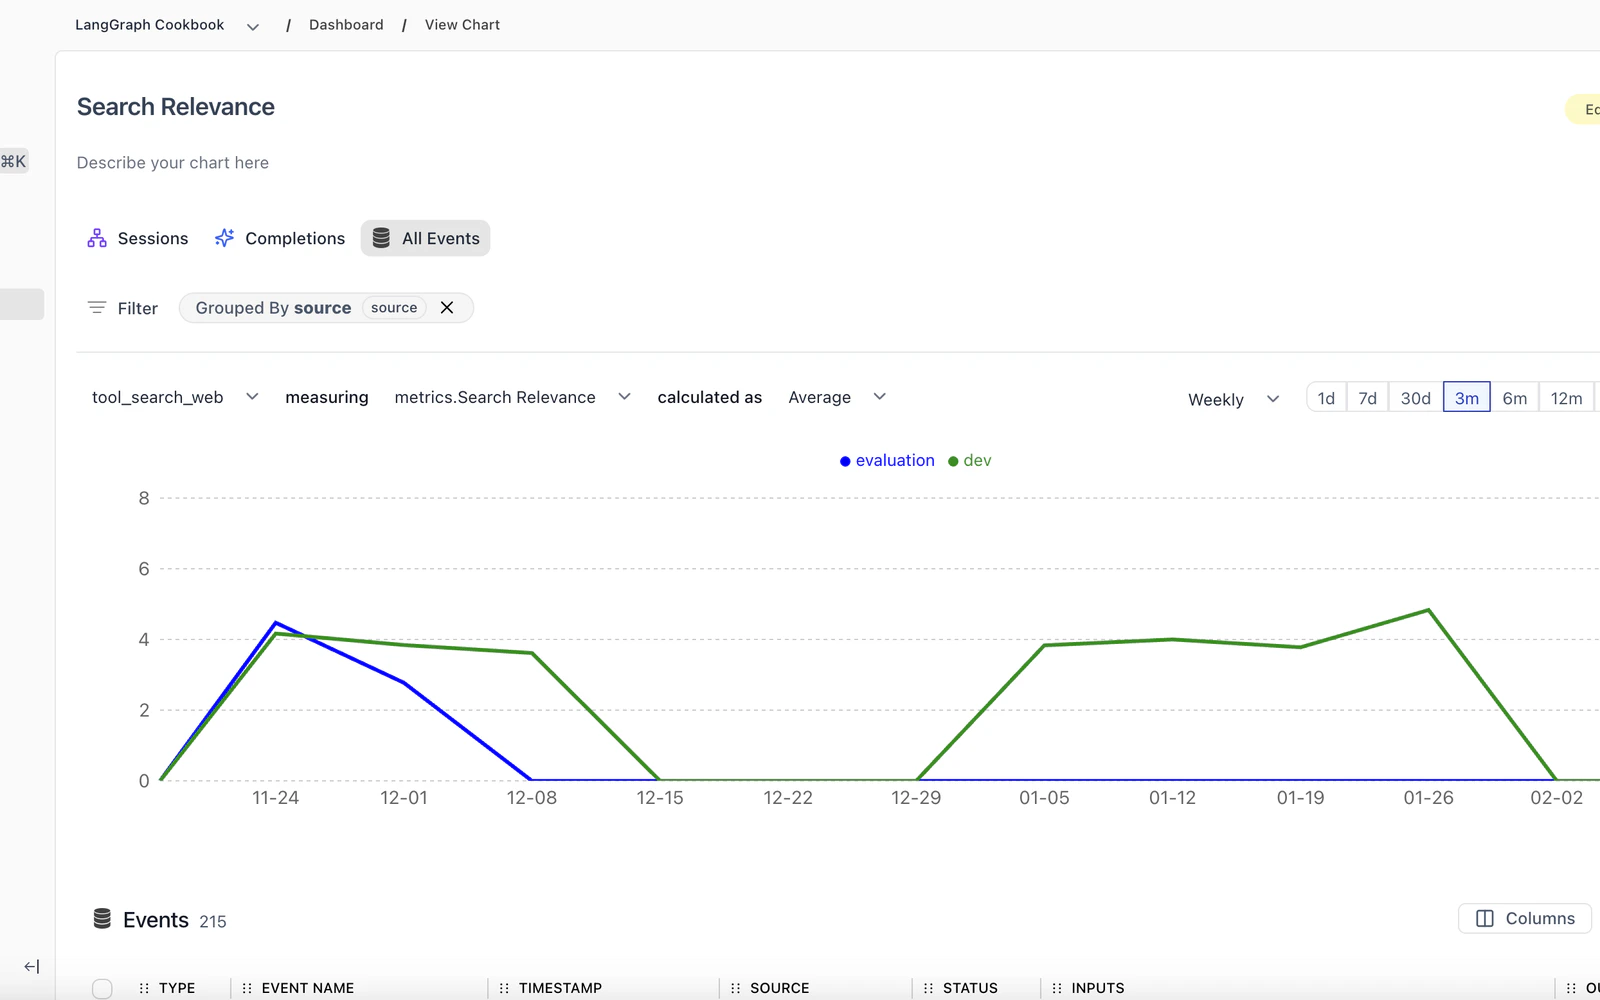
### Searchable Evaluator Dropdown in Traces
The evaluator metric dropdown in the trace side view now supports search and keyboard navigation, making it faster to find specific metrics when you have many configured.
## Python SDK
### Session Reuse Without Init-Time API Call
* New `skip_backend_session_creation` flag on `HoneyHiveTracer.init()`. When initializing a tracer with an existing `session_id`, set this to `True` to skip the synchronous backend session creation call during init.
[Learn more about tracer initialization](/v2/tracing/tracer-initialization#skipping-init-time-session-creation)
## Core Platform
### Jump from Alerts to Discover
When an alert triggers, you can now navigate directly to the Discover page with the alert's filters, metric, and aggregation pre-applied. Instead of manually recreating the query to investigate what caused a trigger, one click takes you straight to the relevant data.
Requires the `org.analytics.query` permission.
[Learn more about usage reporting](/v2/workspace/usage)
### Searchable Evaluator Dropdown in Traces
The evaluator metric dropdown in the trace side view now supports search and keyboard navigation, making it faster to find specific metrics when you have many configured.
## Python SDK
### Session Reuse Without Init-Time API Call
* New `skip_backend_session_creation` flag on `HoneyHiveTracer.init()`. When initializing a tracer with an existing `session_id`, set this to `True` to skip the synchronous backend session creation call during init.
[Learn more about tracer initialization](/v2/tracing/tracer-initialization#skipping-init-time-session-creation)
## Core Platform
### Jump from Alerts to Discover
When an alert triggers, you can now navigate directly to the Discover page with the alert's filters, metric, and aggregation pre-applied. Instead of manually recreating the query to investigate what caused a trigger, one click takes you straight to the relevant data.
 [Learn more about alerts](/v2/monitoring/alerts/alerts_overview)
### Visual Tool Configuration in Traces
Tool definitions in the trace side view now render as collapsible, labeled pills instead of raw JSON. The display supports OpenAI, Anthropic, Google Gemini, and AWS Bedrock tool formats, making it much easier to inspect tool configurations at a glance when debugging across providers.
[Learn more about alerts](/v2/monitoring/alerts/alerts_overview)
### Visual Tool Configuration in Traces
Tool definitions in the trace side view now render as collapsible, labeled pills instead of raw JSON. The display supports OpenAI, Anthropic, Google Gemini, and AWS Bedrock tool formats, making it much easier to inspect tool configurations at a glance when debugging across providers.
 ### Improvements
* The intent identification [evaluator template](/v2/evaluators/evaluator-templates) now includes an Intent Taxonomy section where you can define your application-specific intents for more precise classification.
* **Playground and Prompts have new URLs.** `/studio/playground` is now `/playground` and `/studio/library` is now `/prompts`. Old URLs redirect automatically.
* Settings and Admin Center tabs have been reorganized, and "API Keys" has been renamed to "Admin Keys" in the Settings sidebar.
* Browser tab titles now display descriptive names for Admin Center sub-pages.
* "Metrics" references in page titles have been updated to "Evaluators" to match current terminology.
* Self-hosted (federated) Docker images are now available for ARM64 architecture in addition to AMD64.
### Fixes
* Fixed 500 errors on the schema and events endpoints when field names contained special characters like `/`, `[`, or `]`. These now return proper validation errors.
* Fixed inconsistent event type values between the events list and session detail endpoints.
* Fixed non-chat data incorrectly rendering as chat messages, and a layout overflow in the trace side view tool call display.
## Core Platform
### Traces (formerly Log Store)
The "Log Store" section has been renamed to **Traces** across the platform to better reflect its purpose: viewing and analyzing your application traces. All routes have changed from `/datastore/*` to `/traces/*`.
### Action Required
**The following changes may require action on your part**
* **Log Store routes renamed to Traces.** All `/datastore/*` URLs now point to `/traces/*`. Update any bookmarks, saved links, or integrations that reference the old paths.
### Improvements
* Filter values in the events table now lazy-load for faster initial page loads with large datasets.
### Fixes
* Fixed alerts not firing when configured with "All Tools" as the event filter.
* Fixed alerts returning incorrect results for session-level aggregate fields like cost, duration, and tokens.
* Fixed the evaluator "Enabled" toggle resetting the evaluator's description and filter configuration.
* Fixed a crash when rendering empty or malformed code blocks in trace views.
* Fixed shared deep links ignoring the date range in the URL, which caused "No events found" for older events.
* Fixed model name sometimes showing as "unknown" on agent and chain spans.
### Security
* Security patches applied for third-party dependencies (including CVE-2026-32887).
## Core Platform
### Action Required
**The following changes may require action on your part**
* **Navigation routes renamed.** Navigation routes in the dashboard now match their page names for consistency. Previously bookmarked URLs will need to be updated.
### Improvements
* The trace detail view now shows additional metadata, including session-level metrics and evaluator scores, inline for quicker inspection.
* Tool call input JSON in the trace view now auto-expands up to two levels and renders faster with syntax highlighting for easier inspection.
### Fixes
* Fixed incorrect token counts and durations displayed in the session side view.
* Fixed event data being lost during partial event updates via the ingestion API.
* Fixed parent-child hierarchy inconsistencies in session traces and exported event data.
* Fixed agent names incorrectly propagating to parent spans when processing ADK chain events.
* Fixed the Registered Data Planes list overflowing when many data planes are configured; it now scrolls properly.
* Fixed log pagination not resetting when switching between projects.
* Fixed self-invite on the members page triggering an unnecessary session reauthorization.
* Resolved connection stability issues that could require service restarts in some deployments.
### Security
* Custom metrics API error responses now sanitize internal details to prevent information leakage.
## Python SDK
### v1.0.0rc20
* New `span_name_filters` parameter on `HoneyHiveTracer.init()` to include or exclude spans by name prefix, filtering out noisy framework internals
* Spans now export asynchronously in batches via a background thread by default, improving tracing performance. Use `disable_batch=True` to preserve synchronous export for Lambda/serverless environments.
## Python SDK
### v1.0.0rc19
* Export operations (`export()`, `export_async()`, `get_by_session_id()`) no longer time out on large result sets. The default read timeout is now 5 minutes instead of 5 seconds.
* New `HH_EXPORT_TIMEOUT_SECONDS` environment variable to override the default export timeout for extremely large exports or constrained network environments
## Core Platform
### Alerts on Self-Hosted Deployments
Alerting is now available for self-hosted HoneyHive deployments. Set up aggregate and drift alerts to monitor key metrics across your AI applications, just like on the cloud offering. Email delivery for alert notifications is coming soon.
[Learn more about alerts](/v2/monitoring/alerts/alerts_overview)
### Custom Experiment Run IDs
You can now pass your own `run_id` when creating experiment runs via the API. This makes it easier to link HoneyHive experiments to your internal CI pipelines, test suites, or tracking systems.
### Provider Secrets Management
A new settings page lets you manage LLM provider keys per workspace. Configure your OpenAI, Anthropic, and other provider credentials directly from **Settings > Workspace**, with encryption at rest.
[Learn more about provider keys](/v2/workspace/provider-keys)
### Action Required
**The following changes may require action on your part**
* **Datasets PUT endpoint now replaces datapoints.** `PUT /datasets` now replaces the datapoint list instead of merging, aligning with expected PUT behavior. Use `POST /datasets/{dataset_id}/datapoints` to append datapoints, or send the full list with PUT.
* **`/commit` API route deprecated.** Use `/metric_version` instead. The `/commit` route will be removed in a future release.
### Improvements
* Dashboard chart controls now respect your role permissions, so you only see actions you're authorized to perform.
* A session expiry warning now appears before your session times out, giving you a chance to save your work.
* Duplicate dataset names are now rejected with a clear validation error.
* Datapoints now include a content hash for automatic deduplication.
* Users in multi-dataplane deployments can now select which data plane to use when creating a workspace.
* Improved support for OpenTelemetry GenAI semantic conventions, including Pydantic AI and Google ADK traces.
* Thread View now displays actual agent names instead of generic labels, making it easier to follow multi-agent conversations.
### Fixes
* Fixed filtering issues when working with large numbers of items.
* Fixed Dashboard Y-axis labels displaying incorrectly for large values.
* Fixed evaluator editor error messages to be more descriptive and actionable.
* Fixed experiment run ID filter not accepting comma-separated values.
* Fixed save flow issues in Playground and Prompts.
* Fixed Thread View not handling non-string message content.
* Fixed an infinite loading state on the experiment compare-with view.
* Fixed UI layering issue on the alerts detail page.
* Fixed file uploads remaining enabled after submission, which could cause duplicates.
### Security
* Custom Python evaluators now run in a sandboxed environment with execution timeouts and restricted system access for safer metric evaluation. Existing custom evaluators that rely on network calls, filesystem writes, or uncommon imports may need to be updated.
* Request body size limits are now enforced per route to prevent memory issues.
* Sensitive tokens and keys are no longer included in log output.
* Security patches applied for permission pattern handling and email validation.
## Python SDK
### v1.0.0rc18
* Large query batching: list operations like `datapoints.list()` and `experiments.list_runs()` now automatically batch when exceeding 100 items, merging results transparently. No API changes needed, existing code works as before without silent truncation or HTTP errors on large lists.
* SDK identification headers (`hh-sdk-version`, `hh-sdk-language`, `hh-sdk-package`) sent on all HTTP requests for better debugging and support diagnostics
## Core Platform
### Introducing Workspaces
HoneyHive now organizes your account into three levels: **Organization > Workspace > Project**. Workspaces are a new layer between your organization and projects, designed to map to how your company actually operates - one workspace per business unit, team, or department. Each workspace gets its own AI provider keys, access controls, and data boundaries, so the ML platform team, product team, and compliance team can all work independently under one organization.
```mermaid theme={null}
graph TD
Org["Organization"]
WS1["Workspace A"]
WS2["Workspace B"]
P1["Project 1"]
P2["Project 2"]
P3["Project 3"]
P4["Project 4"]
Org --> WS1
Org --> WS2
WS1 --> P1
WS1 --> P2
WS2 --> P3
WS2 --> P4
```
A new **org/workspace switcher** replaces the logo in the top navigation, letting you move between organizations and workspaces in two clicks.
[Learn more about the organization hierarchy](/v2/workspace/organization-hierarchy)
### Workspace-Scoped AI Provider Keys
AI provider keys have moved from the **organization level** down to the **workspace level**. Configure your OpenAI, Anthropic, Azure OpenAI, Bedrock, Gemini, or Vertex AI credentials per workspace in **Settings > Workspace > AI Providers**.
This tightens your security posture and unlocks per-team cost attribution:
* **Smaller blast radius** - A compromised key only affects one workspace, not your entire organization. Workspace Admins manage their own keys without needing org-level access.
* **Cost attribution by team** - Each workspace uses its own provider keys, so API spend maps directly to the business unit, department, or team that owns the workspace. No more splitting a shared org bill across teams.
* **Right provider for the right team** - One team can use Azure OpenAI to meet compliance requirements while another runs on AWS Bedrock. Each workspace's provider configuration is fully independent.
[Learn more about provider keys](/v2/workspace/provider-keys)
### Enterprise-Grade Role-Based Access Control
A new permission system replaces the previous four-role hierarchy (`Org Admin > Project Admin > Project Member > Org Member`) with independent roles at each scope level and 100+ granular permissions.
Permissions no longer inherit across levels. An Org Admin must be explicitly added to a workspace and project to access its data. Each scope is independently controlled.
Both membership and a role with the right permissions are required to access any resource. Neither condition alone is sufficient.
Workspace Admins and Members join Org and Project roles as the new middle layer. Control who can manage AI provider keys, create projects, and invite team members within a workspace.
Define custom roles with granular permission sets that match your team's specific access requirements. The platform supports 100+ individual permissions across all scope levels.
This entry describes the February 2026 RBAC launch behavior. HoneyHive Cloud later added Org Admin permission inheritance for membership and scope management permissions.
The UI now shows a **Permission Denied** state when a user attempts an action outside their role, rather than silently failing or hiding features.
[Learn more about roles and permissions](/v2/workspace/roles)
### Introducing Organization Templates
Enterprise organizations can now define **templates** that control which evaluators and charts are auto-created when new workspaces and projects are created. Instead of every team starting from scratch or copy-pasting setup from another project, Org Admins configure a standard set of evaluators and monitoring charts once, and they automatically populate when new workspaces and projects are created across the organization.
This gives platform teams a way to enforce consistency at scale - standardize quality metrics across business units, ensure every new project ships with the right monitoring dashboards, and reduce onboarding time for teams spinning up new AI applications.
Org Admins define templates via a YAML manifest in **Settings > Organization > Templates**. Every new project starts with the evaluators and monitoring charts you specify - ready to go from day one.
Organization Templates require the **Enterprise** plan.
[Learn more about organization templates](/v2/workspace/templates)
### LLM Evaluators with Workspace Provider Defaults
LLM evaluators now pull from your workspace's configured AI provider keys instead of org-level credentials. Default provider and model values are pre-selected based on your workspace configuration, so evaluators work out of the box as soon as a provider key is set up.
[Learn more about LLM evaluators](/v2/evaluators/llm)
### Other Improvements
* Visibility toggle on input fields and improved dialog interactions
* ClickHouse query performance improvements
* Log Store UI fixes
* Security-related fixes
* Form validation improvements
## Python SDK
### v1.0.0rc17
* Git context automatically stamped on experiment runs (commit hash, branch, author, remote URL, dirty status)
* Custom `run_id` support in `evaluate()` for using your own identifiers
* Auto-infer `is_evaluation=True` when `dataset_id`, `datapoint_id`, and `run_id` are all provided, preventing silent loss of evaluation context
* `export_async()` now retries on transient HTTP errors (502, 503, 504), matching `export()` behavior
* Debug logging for `get_by_session_id` and export flows (entry/exit, HTTP metadata, empty result diagnostics)
* Removed non-functional `include_datapoints` query param
* Synced OpenAPI spec and removed defunct Tools API client
* Fixed single-item list query param serialization causing 400 errors
### v1.0.0rc16
* Fixed import errors and `AttributeError` in events and context modules
* Events API fixes: ordering, project deprecation handling, `enrich_span` event ID resolution
* Corrected `evaluate()` docstrings to match actual function signature
### v1.0.0rc15
* New `flush()` method on `HoneyHiveTracer` for explicitly flushing pending spans before application shutdown
* New `get_by_session_id()` method on Events API for retrieving all events for a given session using the Data Plane export endpoint
* `enrich_span()` now supports `update_event_id` parameter for overriding a span's event\_id attribute without making API calls
* Events returned in chronological order by default; `project` parameter deprecated in favor of project-scoped API keys
* Pydantic models now preserve extra fields from API responses (`extra="allow"`), preventing data loss when backend returns additional fields
### v1.0.0rc9
* Auto-generated type-safe v1 API client from OpenAPI spec with full Pydantic models for all requests/responses, sync and async methods, and new endpoint support (batch events, experiment results/comparison, project CRUD)
* Backwards-compatible API aliases: all API classes support both new (`list()`, `create()`, `get()`) and legacy (`list_datasets()`, `create_dataset()`) method names
* OTLP HTTP/JSON export is now the default format (changed from `http/protobuf`), configurable via `HH_OTLP_PROTOCOL` or `OTEL_EXPORTER_OTLP_PROTOCOL` environment variables
* `evaluate()` now accepts an `instrumentors` parameter to auto-instrument third-party libraries (OpenAI, Anthropic, Google ADK, LangChain, etc.) per datapoint
* `evaluate()` now accepts async functions, automatically detected and executed with `asyncio.run()` inside worker threads
* Typed Pydantic models for experiment results (`MetricDetail`, `DatapointResult`, `DatapointMetric`)
* Fixed metrics table printing empty values after `evaluate()` by aligning with backend's `details` array format
* Fixed `enrich_session()` silently failing when called without explicit parameters
## Python SDK
### v1.0.0rc5
* Metric schema updated for backend parity: new type enums (`PYTHON`/`LLM`/`HUMAN`/`COMPOSITE`), `categorical` return type, and new fields (`sampling_percentage`, `scale`, `categories`, `filters`)
* Enhanced datapoints filtering with `dataset_id` and `dataset_name` parameters; legacy `dataset` parameter auto-detects ID vs. name
* `EventsAPI.list_events()` now accepts a single `EventFilter` or a list, converting automatically
* Simplified distributed tracing setup with `with_distributed_trace_context()` context manager (reduces server-side boilerplate from \~65 lines to 1 line)
* Fixed `@trace` decorator overwriting distributed trace baggage (`session_id`, `project`, `source`) instead of preserving it
* Configurable OpenTelemetry span limits via `TracerConfig` or environment variables (`HH_MAX_ATTRIBUTES`, `HH_MAX_EVENTS`, `HH_MAX_LINKS`)
* Automatic preservation of critical HoneyHive attributes (`session_id`, `event_type`, `event_name`, `source`) when spans approach the attribute limit
* Fixed session ID initialization when explicitly providing a `session_id` to `HoneyHiveTracer.init()`
## Core Platform
### Experiments Dashboard
Visualize metric trends across all your experiments in a single unified view.
### Improvements
* The intent identification [evaluator template](/v2/evaluators/evaluator-templates) now includes an Intent Taxonomy section where you can define your application-specific intents for more precise classification.
* **Playground and Prompts have new URLs.** `/studio/playground` is now `/playground` and `/studio/library` is now `/prompts`. Old URLs redirect automatically.
* Settings and Admin Center tabs have been reorganized, and "API Keys" has been renamed to "Admin Keys" in the Settings sidebar.
* Browser tab titles now display descriptive names for Admin Center sub-pages.
* "Metrics" references in page titles have been updated to "Evaluators" to match current terminology.
* Self-hosted (federated) Docker images are now available for ARM64 architecture in addition to AMD64.
### Fixes
* Fixed 500 errors on the schema and events endpoints when field names contained special characters like `/`, `[`, or `]`. These now return proper validation errors.
* Fixed inconsistent event type values between the events list and session detail endpoints.
* Fixed non-chat data incorrectly rendering as chat messages, and a layout overflow in the trace side view tool call display.
## Core Platform
### Traces (formerly Log Store)
The "Log Store" section has been renamed to **Traces** across the platform to better reflect its purpose: viewing and analyzing your application traces. All routes have changed from `/datastore/*` to `/traces/*`.
### Action Required
**The following changes may require action on your part**
* **Log Store routes renamed to Traces.** All `/datastore/*` URLs now point to `/traces/*`. Update any bookmarks, saved links, or integrations that reference the old paths.
### Improvements
* Filter values in the events table now lazy-load for faster initial page loads with large datasets.
### Fixes
* Fixed alerts not firing when configured with "All Tools" as the event filter.
* Fixed alerts returning incorrect results for session-level aggregate fields like cost, duration, and tokens.
* Fixed the evaluator "Enabled" toggle resetting the evaluator's description and filter configuration.
* Fixed a crash when rendering empty or malformed code blocks in trace views.
* Fixed shared deep links ignoring the date range in the URL, which caused "No events found" for older events.
* Fixed model name sometimes showing as "unknown" on agent and chain spans.
### Security
* Security patches applied for third-party dependencies (including CVE-2026-32887).
## Core Platform
### Action Required
**The following changes may require action on your part**
* **Navigation routes renamed.** Navigation routes in the dashboard now match their page names for consistency. Previously bookmarked URLs will need to be updated.
### Improvements
* The trace detail view now shows additional metadata, including session-level metrics and evaluator scores, inline for quicker inspection.
* Tool call input JSON in the trace view now auto-expands up to two levels and renders faster with syntax highlighting for easier inspection.
### Fixes
* Fixed incorrect token counts and durations displayed in the session side view.
* Fixed event data being lost during partial event updates via the ingestion API.
* Fixed parent-child hierarchy inconsistencies in session traces and exported event data.
* Fixed agent names incorrectly propagating to parent spans when processing ADK chain events.
* Fixed the Registered Data Planes list overflowing when many data planes are configured; it now scrolls properly.
* Fixed log pagination not resetting when switching between projects.
* Fixed self-invite on the members page triggering an unnecessary session reauthorization.
* Resolved connection stability issues that could require service restarts in some deployments.
### Security
* Custom metrics API error responses now sanitize internal details to prevent information leakage.
## Python SDK
### v1.0.0rc20
* New `span_name_filters` parameter on `HoneyHiveTracer.init()` to include or exclude spans by name prefix, filtering out noisy framework internals
* Spans now export asynchronously in batches via a background thread by default, improving tracing performance. Use `disable_batch=True` to preserve synchronous export for Lambda/serverless environments.
## Python SDK
### v1.0.0rc19
* Export operations (`export()`, `export_async()`, `get_by_session_id()`) no longer time out on large result sets. The default read timeout is now 5 minutes instead of 5 seconds.
* New `HH_EXPORT_TIMEOUT_SECONDS` environment variable to override the default export timeout for extremely large exports or constrained network environments
## Core Platform
### Alerts on Self-Hosted Deployments
Alerting is now available for self-hosted HoneyHive deployments. Set up aggregate and drift alerts to monitor key metrics across your AI applications, just like on the cloud offering. Email delivery for alert notifications is coming soon.
[Learn more about alerts](/v2/monitoring/alerts/alerts_overview)
### Custom Experiment Run IDs
You can now pass your own `run_id` when creating experiment runs via the API. This makes it easier to link HoneyHive experiments to your internal CI pipelines, test suites, or tracking systems.
### Provider Secrets Management
A new settings page lets you manage LLM provider keys per workspace. Configure your OpenAI, Anthropic, and other provider credentials directly from **Settings > Workspace**, with encryption at rest.
[Learn more about provider keys](/v2/workspace/provider-keys)
### Action Required
**The following changes may require action on your part**
* **Datasets PUT endpoint now replaces datapoints.** `PUT /datasets` now replaces the datapoint list instead of merging, aligning with expected PUT behavior. Use `POST /datasets/{dataset_id}/datapoints` to append datapoints, or send the full list with PUT.
* **`/commit` API route deprecated.** Use `/metric_version` instead. The `/commit` route will be removed in a future release.
### Improvements
* Dashboard chart controls now respect your role permissions, so you only see actions you're authorized to perform.
* A session expiry warning now appears before your session times out, giving you a chance to save your work.
* Duplicate dataset names are now rejected with a clear validation error.
* Datapoints now include a content hash for automatic deduplication.
* Users in multi-dataplane deployments can now select which data plane to use when creating a workspace.
* Improved support for OpenTelemetry GenAI semantic conventions, including Pydantic AI and Google ADK traces.
* Thread View now displays actual agent names instead of generic labels, making it easier to follow multi-agent conversations.
### Fixes
* Fixed filtering issues when working with large numbers of items.
* Fixed Dashboard Y-axis labels displaying incorrectly for large values.
* Fixed evaluator editor error messages to be more descriptive and actionable.
* Fixed experiment run ID filter not accepting comma-separated values.
* Fixed save flow issues in Playground and Prompts.
* Fixed Thread View not handling non-string message content.
* Fixed an infinite loading state on the experiment compare-with view.
* Fixed UI layering issue on the alerts detail page.
* Fixed file uploads remaining enabled after submission, which could cause duplicates.
### Security
* Custom Python evaluators now run in a sandboxed environment with execution timeouts and restricted system access for safer metric evaluation. Existing custom evaluators that rely on network calls, filesystem writes, or uncommon imports may need to be updated.
* Request body size limits are now enforced per route to prevent memory issues.
* Sensitive tokens and keys are no longer included in log output.
* Security patches applied for permission pattern handling and email validation.
## Python SDK
### v1.0.0rc18
* Large query batching: list operations like `datapoints.list()` and `experiments.list_runs()` now automatically batch when exceeding 100 items, merging results transparently. No API changes needed, existing code works as before without silent truncation or HTTP errors on large lists.
* SDK identification headers (`hh-sdk-version`, `hh-sdk-language`, `hh-sdk-package`) sent on all HTTP requests for better debugging and support diagnostics
## Core Platform
### Introducing Workspaces
HoneyHive now organizes your account into three levels: **Organization > Workspace > Project**. Workspaces are a new layer between your organization and projects, designed to map to how your company actually operates - one workspace per business unit, team, or department. Each workspace gets its own AI provider keys, access controls, and data boundaries, so the ML platform team, product team, and compliance team can all work independently under one organization.
```mermaid theme={null}
graph TD
Org["Organization"]
WS1["Workspace A"]
WS2["Workspace B"]
P1["Project 1"]
P2["Project 2"]
P3["Project 3"]
P4["Project 4"]
Org --> WS1
Org --> WS2
WS1 --> P1
WS1 --> P2
WS2 --> P3
WS2 --> P4
```
A new **org/workspace switcher** replaces the logo in the top navigation, letting you move between organizations and workspaces in two clicks.
[Learn more about the organization hierarchy](/v2/workspace/organization-hierarchy)
### Workspace-Scoped AI Provider Keys
AI provider keys have moved from the **organization level** down to the **workspace level**. Configure your OpenAI, Anthropic, Azure OpenAI, Bedrock, Gemini, or Vertex AI credentials per workspace in **Settings > Workspace > AI Providers**.
This tightens your security posture and unlocks per-team cost attribution:
* **Smaller blast radius** - A compromised key only affects one workspace, not your entire organization. Workspace Admins manage their own keys without needing org-level access.
* **Cost attribution by team** - Each workspace uses its own provider keys, so API spend maps directly to the business unit, department, or team that owns the workspace. No more splitting a shared org bill across teams.
* **Right provider for the right team** - One team can use Azure OpenAI to meet compliance requirements while another runs on AWS Bedrock. Each workspace's provider configuration is fully independent.
[Learn more about provider keys](/v2/workspace/provider-keys)
### Enterprise-Grade Role-Based Access Control
A new permission system replaces the previous four-role hierarchy (`Org Admin > Project Admin > Project Member > Org Member`) with independent roles at each scope level and 100+ granular permissions.
Permissions no longer inherit across levels. An Org Admin must be explicitly added to a workspace and project to access its data. Each scope is independently controlled.
Both membership and a role with the right permissions are required to access any resource. Neither condition alone is sufficient.
Workspace Admins and Members join Org and Project roles as the new middle layer. Control who can manage AI provider keys, create projects, and invite team members within a workspace.
Define custom roles with granular permission sets that match your team's specific access requirements. The platform supports 100+ individual permissions across all scope levels.
This entry describes the February 2026 RBAC launch behavior. HoneyHive Cloud later added Org Admin permission inheritance for membership and scope management permissions.
The UI now shows a **Permission Denied** state when a user attempts an action outside their role, rather than silently failing or hiding features.
[Learn more about roles and permissions](/v2/workspace/roles)
### Introducing Organization Templates
Enterprise organizations can now define **templates** that control which evaluators and charts are auto-created when new workspaces and projects are created. Instead of every team starting from scratch or copy-pasting setup from another project, Org Admins configure a standard set of evaluators and monitoring charts once, and they automatically populate when new workspaces and projects are created across the organization.
This gives platform teams a way to enforce consistency at scale - standardize quality metrics across business units, ensure every new project ships with the right monitoring dashboards, and reduce onboarding time for teams spinning up new AI applications.
Org Admins define templates via a YAML manifest in **Settings > Organization > Templates**. Every new project starts with the evaluators and monitoring charts you specify - ready to go from day one.
Organization Templates require the **Enterprise** plan.
[Learn more about organization templates](/v2/workspace/templates)
### LLM Evaluators with Workspace Provider Defaults
LLM evaluators now pull from your workspace's configured AI provider keys instead of org-level credentials. Default provider and model values are pre-selected based on your workspace configuration, so evaluators work out of the box as soon as a provider key is set up.
[Learn more about LLM evaluators](/v2/evaluators/llm)
### Other Improvements
* Visibility toggle on input fields and improved dialog interactions
* ClickHouse query performance improvements
* Log Store UI fixes
* Security-related fixes
* Form validation improvements
## Python SDK
### v1.0.0rc17
* Git context automatically stamped on experiment runs (commit hash, branch, author, remote URL, dirty status)
* Custom `run_id` support in `evaluate()` for using your own identifiers
* Auto-infer `is_evaluation=True` when `dataset_id`, `datapoint_id`, and `run_id` are all provided, preventing silent loss of evaluation context
* `export_async()` now retries on transient HTTP errors (502, 503, 504), matching `export()` behavior
* Debug logging for `get_by_session_id` and export flows (entry/exit, HTTP metadata, empty result diagnostics)
* Removed non-functional `include_datapoints` query param
* Synced OpenAPI spec and removed defunct Tools API client
* Fixed single-item list query param serialization causing 400 errors
### v1.0.0rc16
* Fixed import errors and `AttributeError` in events and context modules
* Events API fixes: ordering, project deprecation handling, `enrich_span` event ID resolution
* Corrected `evaluate()` docstrings to match actual function signature
### v1.0.0rc15
* New `flush()` method on `HoneyHiveTracer` for explicitly flushing pending spans before application shutdown
* New `get_by_session_id()` method on Events API for retrieving all events for a given session using the Data Plane export endpoint
* `enrich_span()` now supports `update_event_id` parameter for overriding a span's event\_id attribute without making API calls
* Events returned in chronological order by default; `project` parameter deprecated in favor of project-scoped API keys
* Pydantic models now preserve extra fields from API responses (`extra="allow"`), preventing data loss when backend returns additional fields
### v1.0.0rc9
* Auto-generated type-safe v1 API client from OpenAPI spec with full Pydantic models for all requests/responses, sync and async methods, and new endpoint support (batch events, experiment results/comparison, project CRUD)
* Backwards-compatible API aliases: all API classes support both new (`list()`, `create()`, `get()`) and legacy (`list_datasets()`, `create_dataset()`) method names
* OTLP HTTP/JSON export is now the default format (changed from `http/protobuf`), configurable via `HH_OTLP_PROTOCOL` or `OTEL_EXPORTER_OTLP_PROTOCOL` environment variables
* `evaluate()` now accepts an `instrumentors` parameter to auto-instrument third-party libraries (OpenAI, Anthropic, Google ADK, LangChain, etc.) per datapoint
* `evaluate()` now accepts async functions, automatically detected and executed with `asyncio.run()` inside worker threads
* Typed Pydantic models for experiment results (`MetricDetail`, `DatapointResult`, `DatapointMetric`)
* Fixed metrics table printing empty values after `evaluate()` by aligning with backend's `details` array format
* Fixed `enrich_session()` silently failing when called without explicit parameters
## Python SDK
### v1.0.0rc5
* Metric schema updated for backend parity: new type enums (`PYTHON`/`LLM`/`HUMAN`/`COMPOSITE`), `categorical` return type, and new fields (`sampling_percentage`, `scale`, `categories`, `filters`)
* Enhanced datapoints filtering with `dataset_id` and `dataset_name` parameters; legacy `dataset` parameter auto-detects ID vs. name
* `EventsAPI.list_events()` now accepts a single `EventFilter` or a list, converting automatically
* Simplified distributed tracing setup with `with_distributed_trace_context()` context manager (reduces server-side boilerplate from \~65 lines to 1 line)
* Fixed `@trace` decorator overwriting distributed trace baggage (`session_id`, `project`, `source`) instead of preserving it
* Configurable OpenTelemetry span limits via `TracerConfig` or environment variables (`HH_MAX_ATTRIBUTES`, `HH_MAX_EVENTS`, `HH_MAX_LINKS`)
* Automatic preservation of critical HoneyHive attributes (`session_id`, `event_type`, `event_name`, `source`) when spans approach the attribute limit
* Fixed session ID initialization when explicitly providing a `session_id` to `HoneyHiveTracer.init()`
## Core Platform
### Experiments Dashboard
Visualize metric trends across all your experiments in a single unified view.
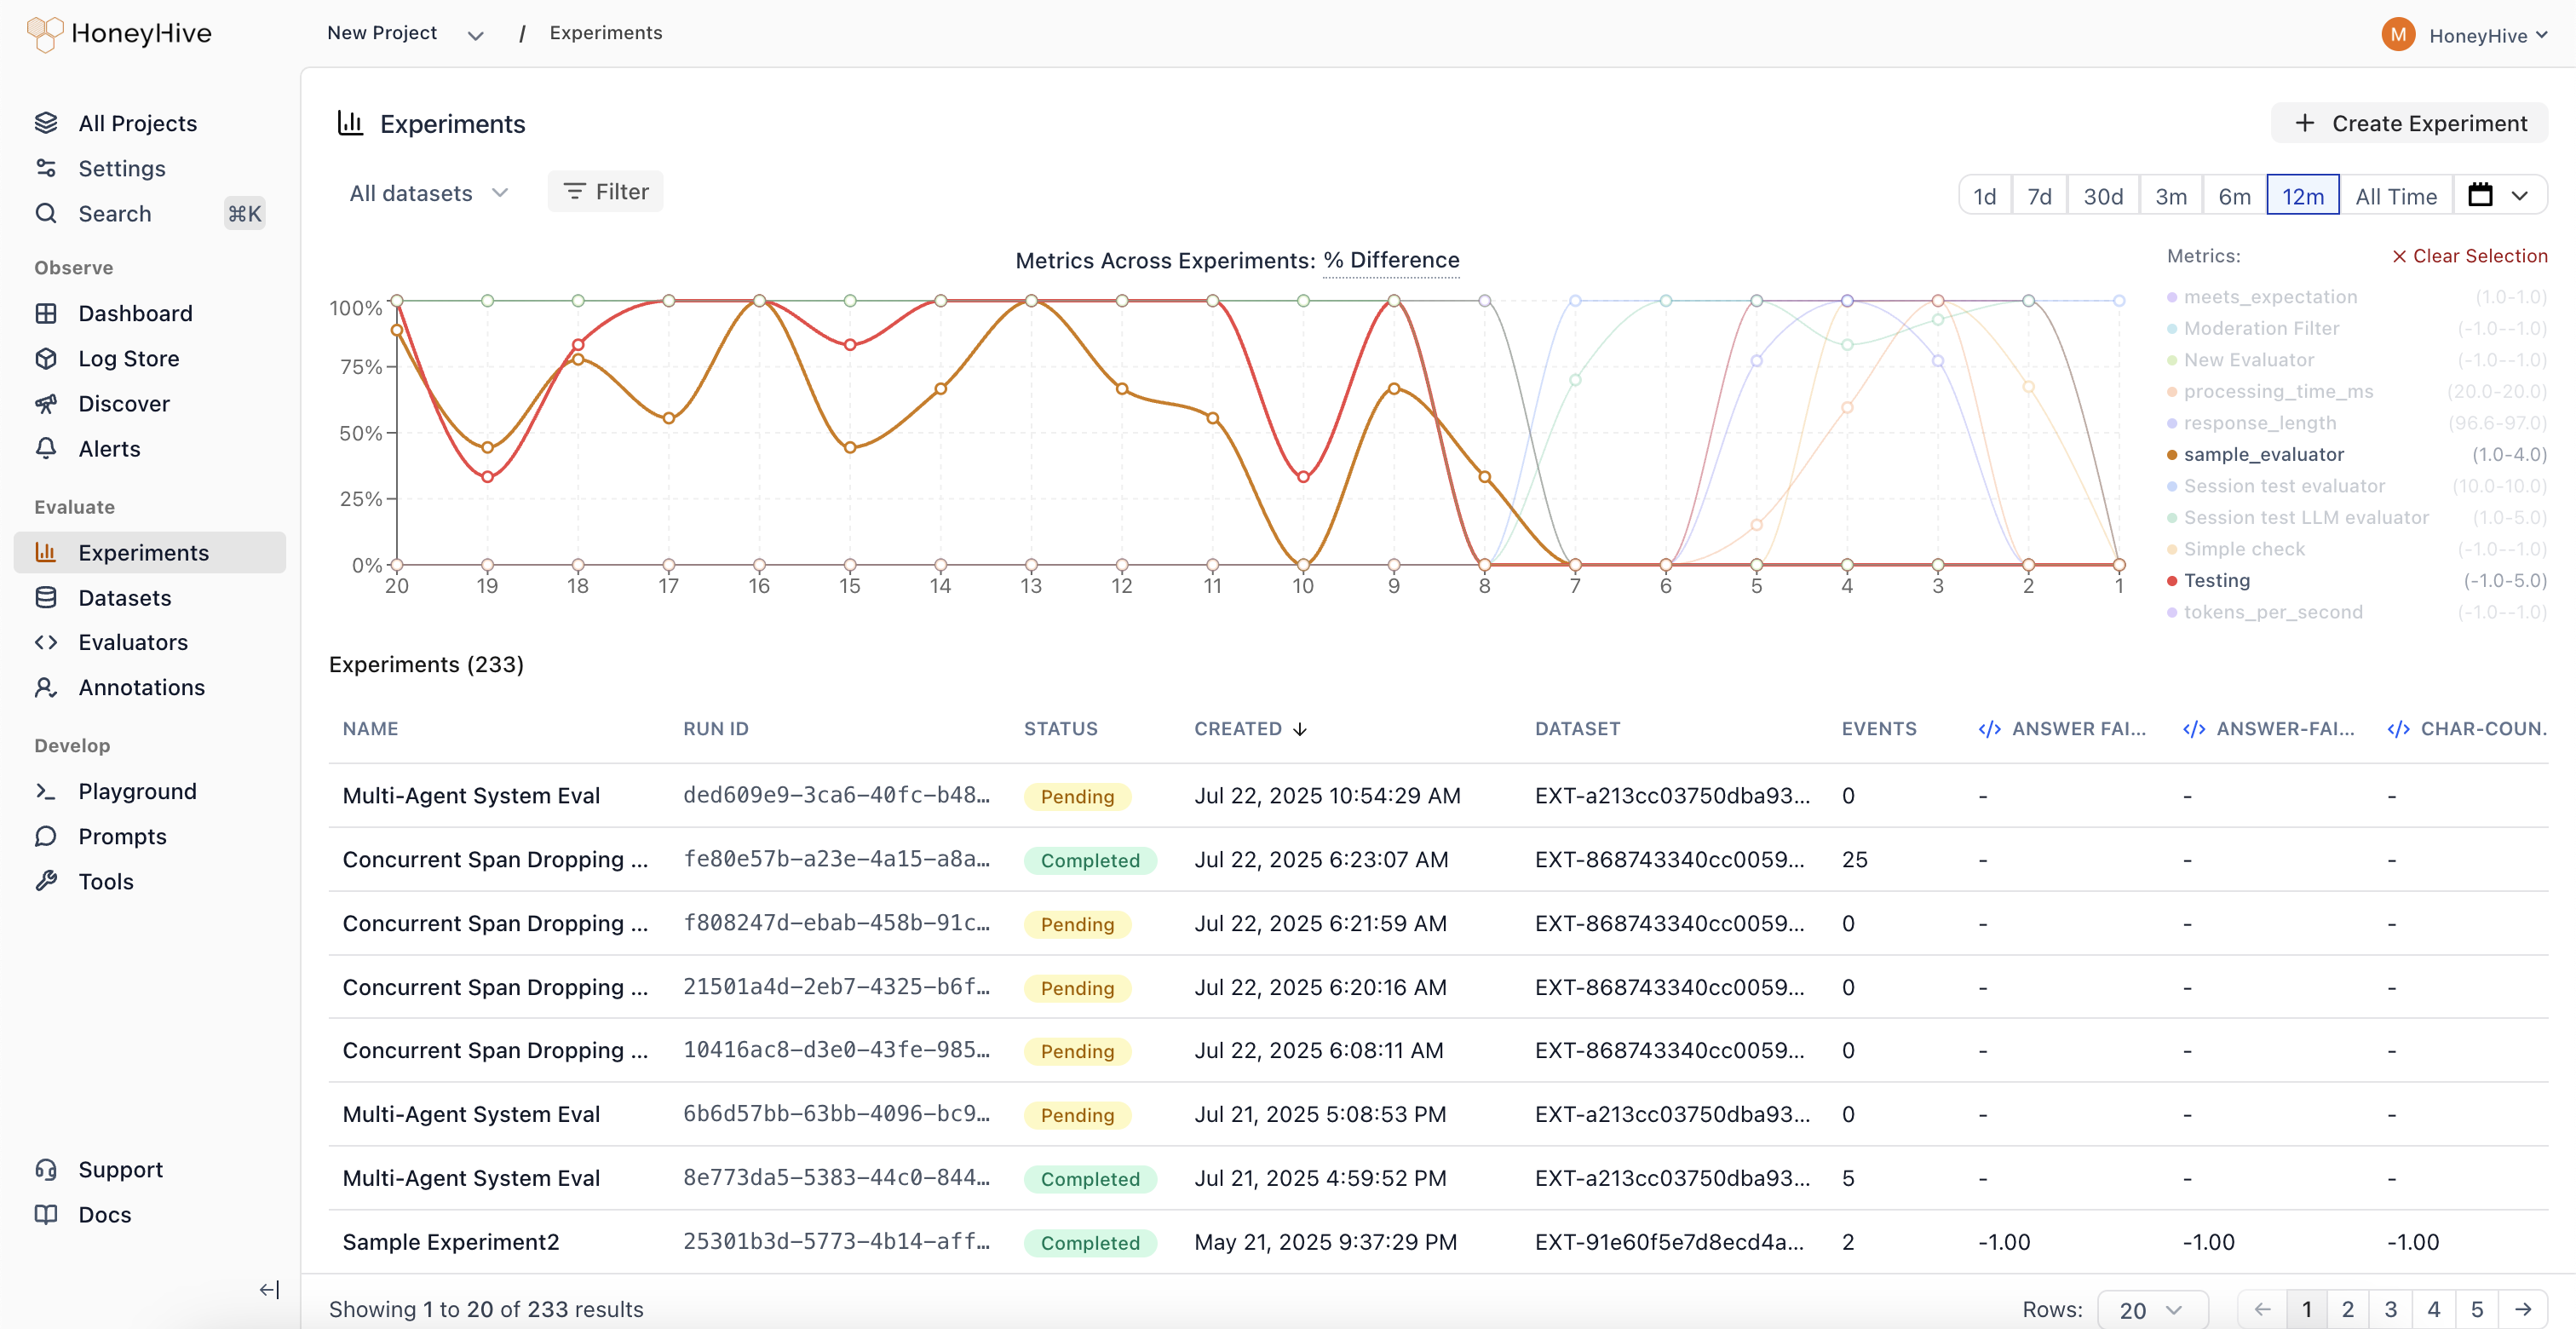 The new Experiments dashboard provides comprehensive visibility into how changes affect your AI application's quality over time:
View and compare metrics across 100+ experiments simultaneously. See results from experiments using different prompts, models, and retrieval parameters side-by-side.
Identify when changes negatively impact your application's quality metrics. Metric trends make it easy to spot regressions at a glance.
Track how sweeps across different configurations (prompts, models, retrieval parameters) impact performance over time.
Analyze experiment results without jumping between individual experiment pages. All your experiment data in one place for faster, data-driven decision making.
[Try it today →](https://app.us.honeyhive.ai/)
### Annotation Queues
Automated trace collection and streamlined human evaluation workflows.
The new Experiments dashboard provides comprehensive visibility into how changes affect your AI application's quality over time:
View and compare metrics across 100+ experiments simultaneously. See results from experiments using different prompts, models, and retrieval parameters side-by-side.
Identify when changes negatively impact your application's quality metrics. Metric trends make it easy to spot regressions at a glance.
Track how sweeps across different configurations (prompts, models, retrieval parameters) impact performance over time.
Analyze experiment results without jumping between individual experiment pages. All your experiment data in one place for faster, data-driven decision making.
[Try it today →](https://app.us.honeyhive.ai/)
### Annotation Queues
Automated trace collection and streamlined human evaluation workflows.
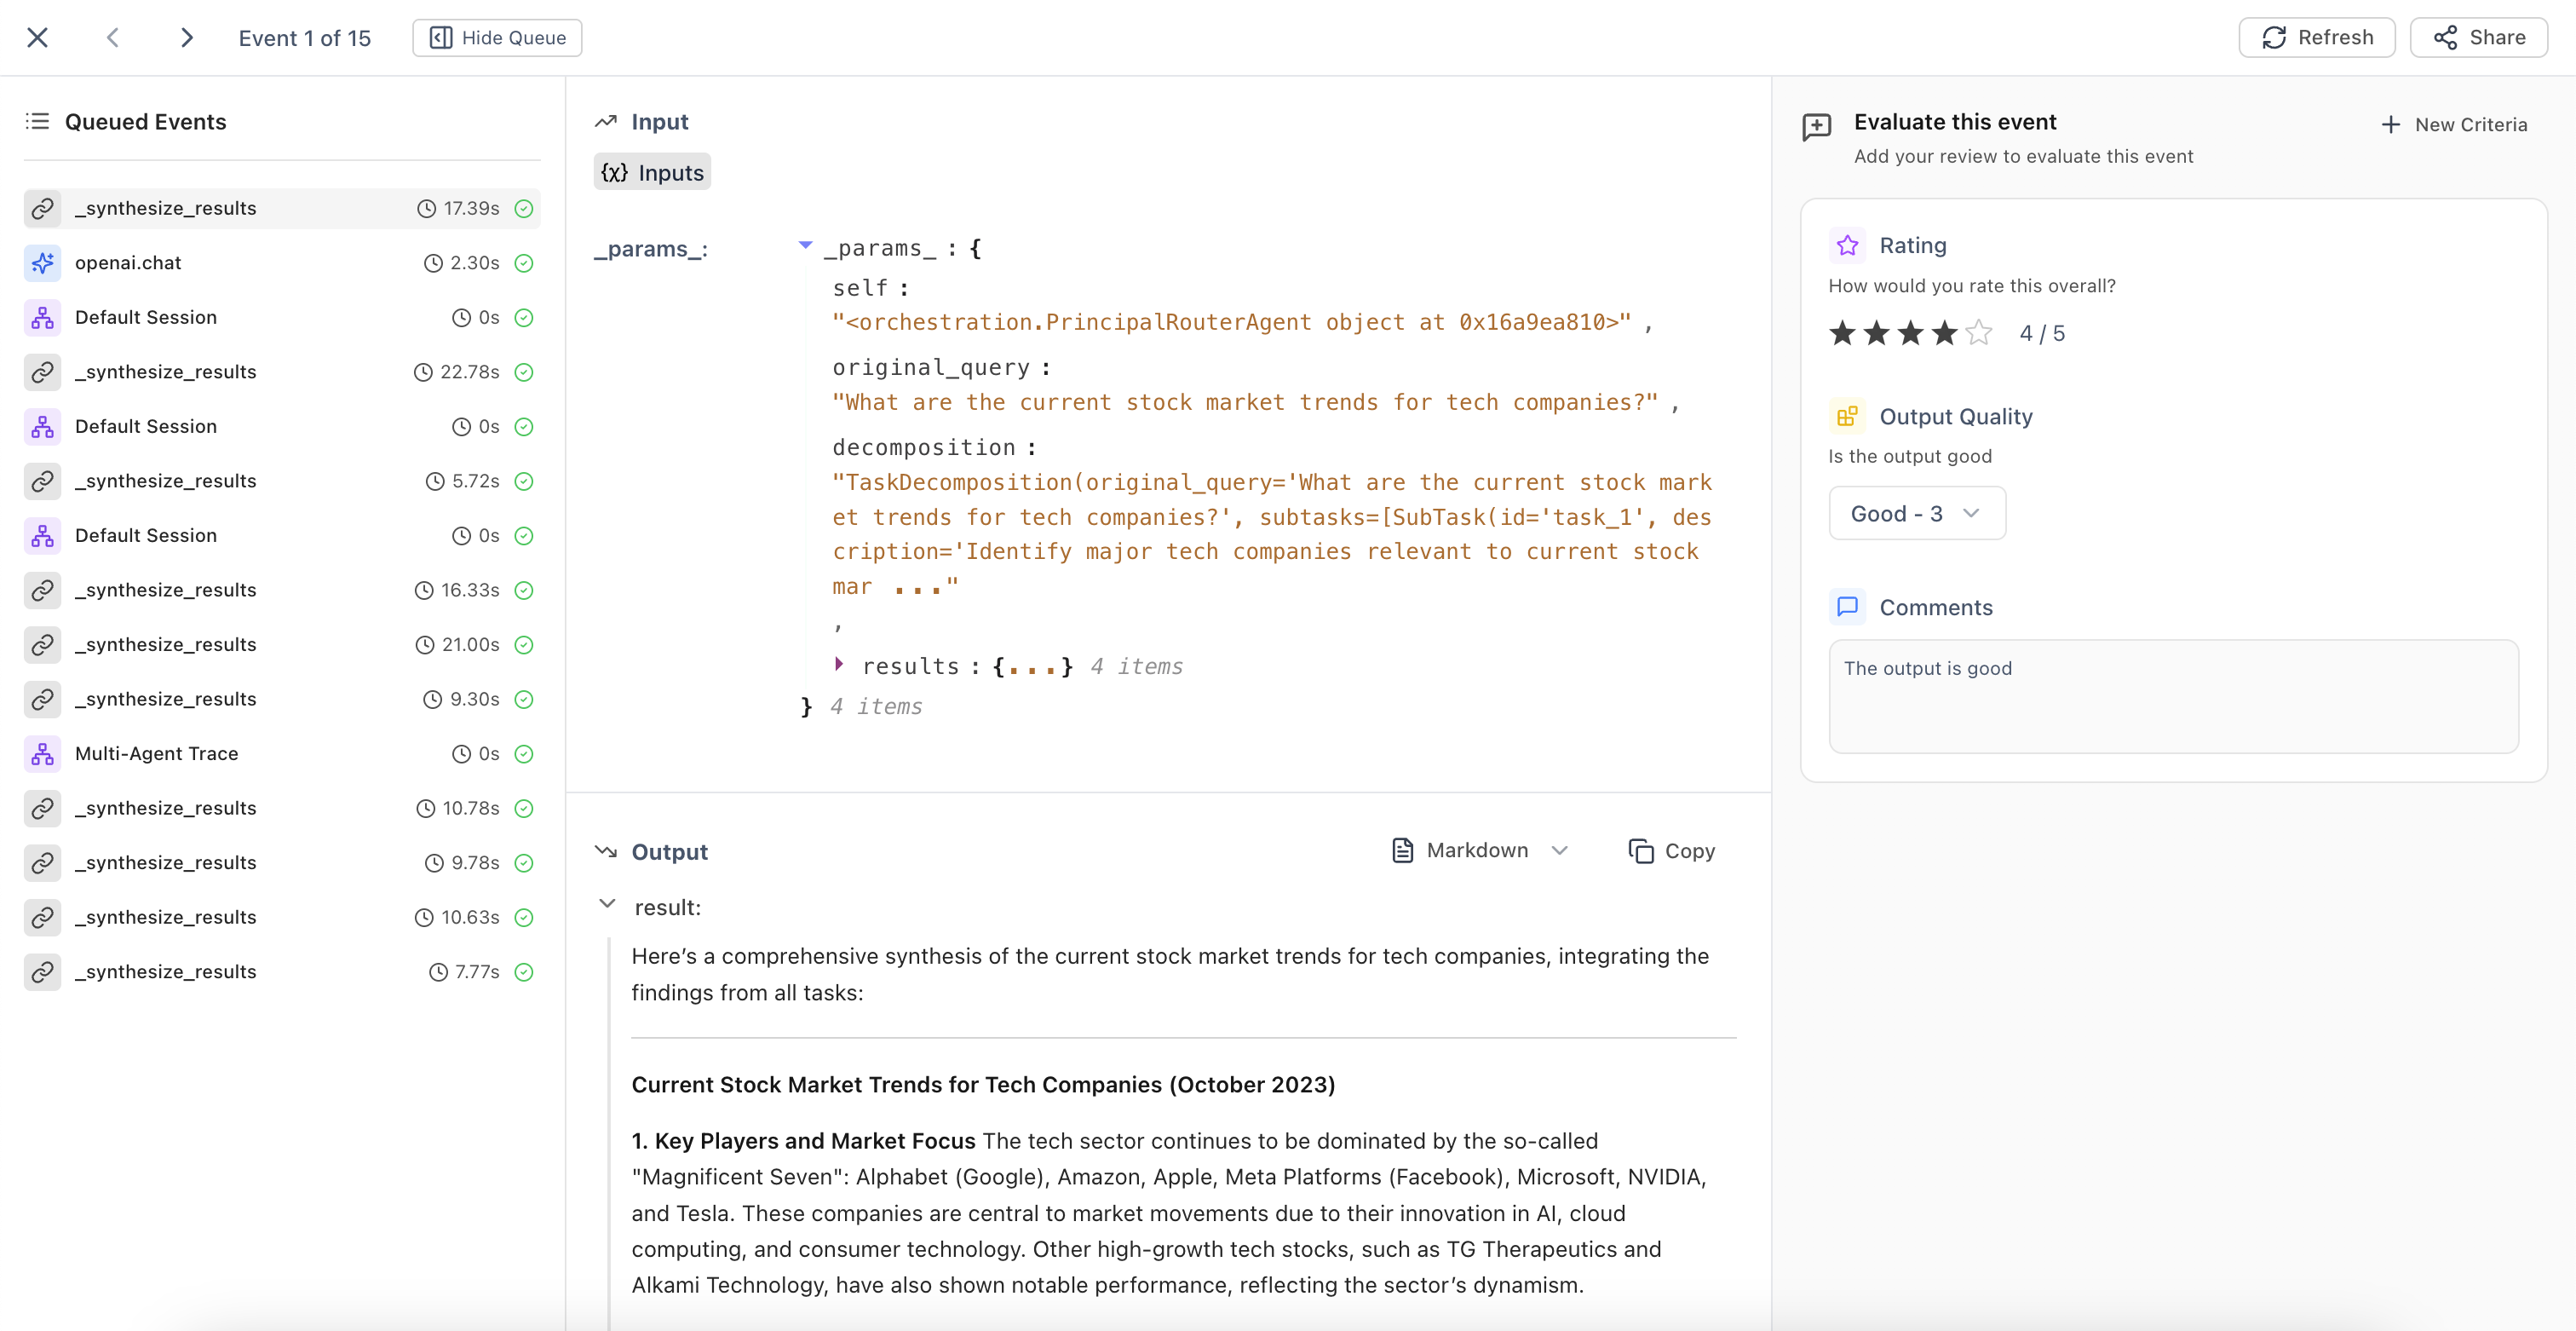 Configure filters to automatically add traces matching specific criteria to annotation queues. The system continuously runs in the background, identifying traces that need human review.
Domain experts can evaluate traces based on predefined criteria fields. Use ← → arrow keys for quick navigation between events during high-volume annotation tasks.
Build high-quality datasets and maintain consistent human oversight of your AI applications with organized evaluation workflows.
### Improved Evaluators UX
Configure filters to automatically add traces matching specific criteria to annotation queues. The system continuously runs in the background, identifying traces that need human review.
Domain experts can evaluate traces based on predefined criteria fields. Use ← → arrow keys for quick navigation between events during high-volume annotation tasks.
Build high-quality datasets and maintain consistent human oversight of your AI applications with organized evaluation workflows.
### Improved Evaluators UX
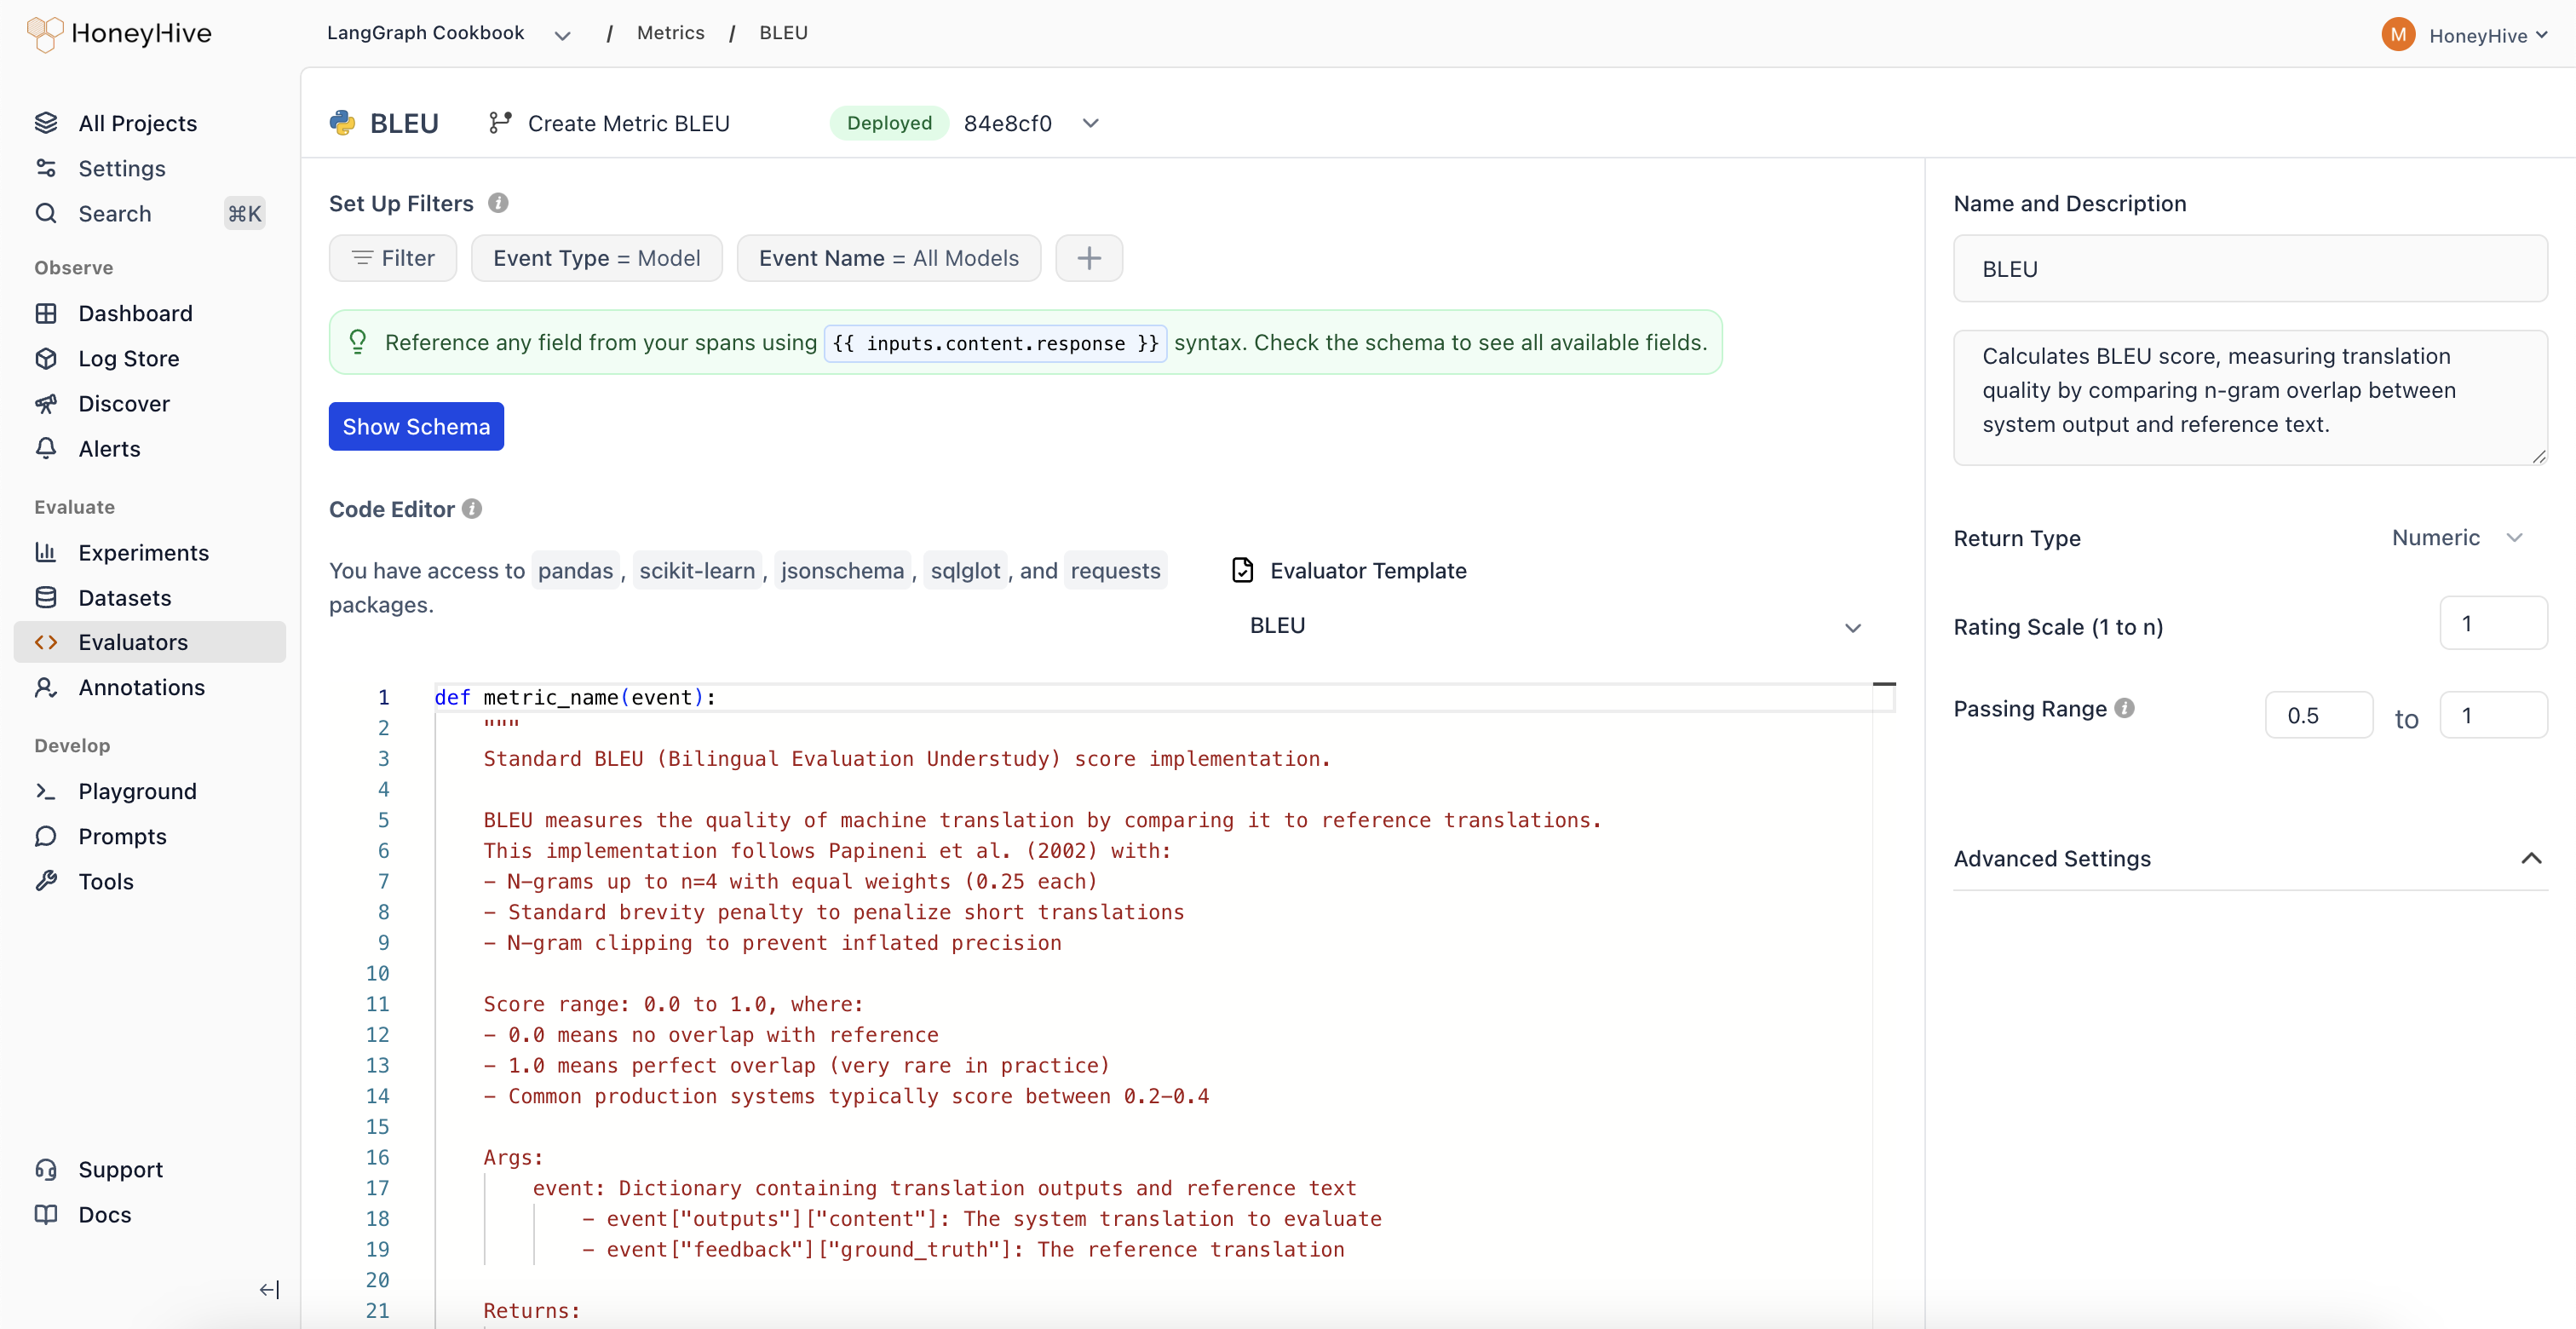 Redesigned evaluator creation interface that combines evaluator configuration and editor into a single unified view.
Configure evaluator parameters and edit evaluation logic in one place, eliminating the need to switch between multiple views. This streamlined workflow reduces context switching when creating and managing metrics.
### New Evaluator Templates
Expanded evaluator templates library with 11 new pre-built templates for common evaluation patterns.
| Category | Evaluators |
| -------------------------- | ---------------------------------------------------------------------------------------------------------------- |
| **Agent Evaluation** | • Chain-of-Thought Faithfulness
Redesigned evaluator creation interface that combines evaluator configuration and editor into a single unified view.
Configure evaluator parameters and edit evaluation logic in one place, eliminating the need to switch between multiple views. This streamlined workflow reduces context switching when creating and managing metrics.
### New Evaluator Templates
Expanded evaluator templates library with 11 new pre-built templates for common evaluation patterns.
| Category | Evaluators |
| -------------------------- | ---------------------------------------------------------------------------------------------------------------- |
| **Agent Evaluation** | • Chain-of-Thought Faithfulness
• Plan Coverage
• Trajectory Plan Faithfulness
• Failure Recovery |
| **Safety** | • Policy Compliance
• Harm Avoidance |
| **RAG** | • Context Coverage |
| **Text Evaluation** | • Tone Appropriateness |
| **Translation** | • Translation Fluency |
| **Code Generation** | • Compilation Success |
| **Classification Metrics** | • Precision/Recall/F1 Metrics |
Quick-start your evaluations with production-ready templates that follow best practices for various AI application use cases.
## Core Platform
### Improved Review Mode
Enhanced context indicators in Review Mode that clearly show which output type you're evaluating.
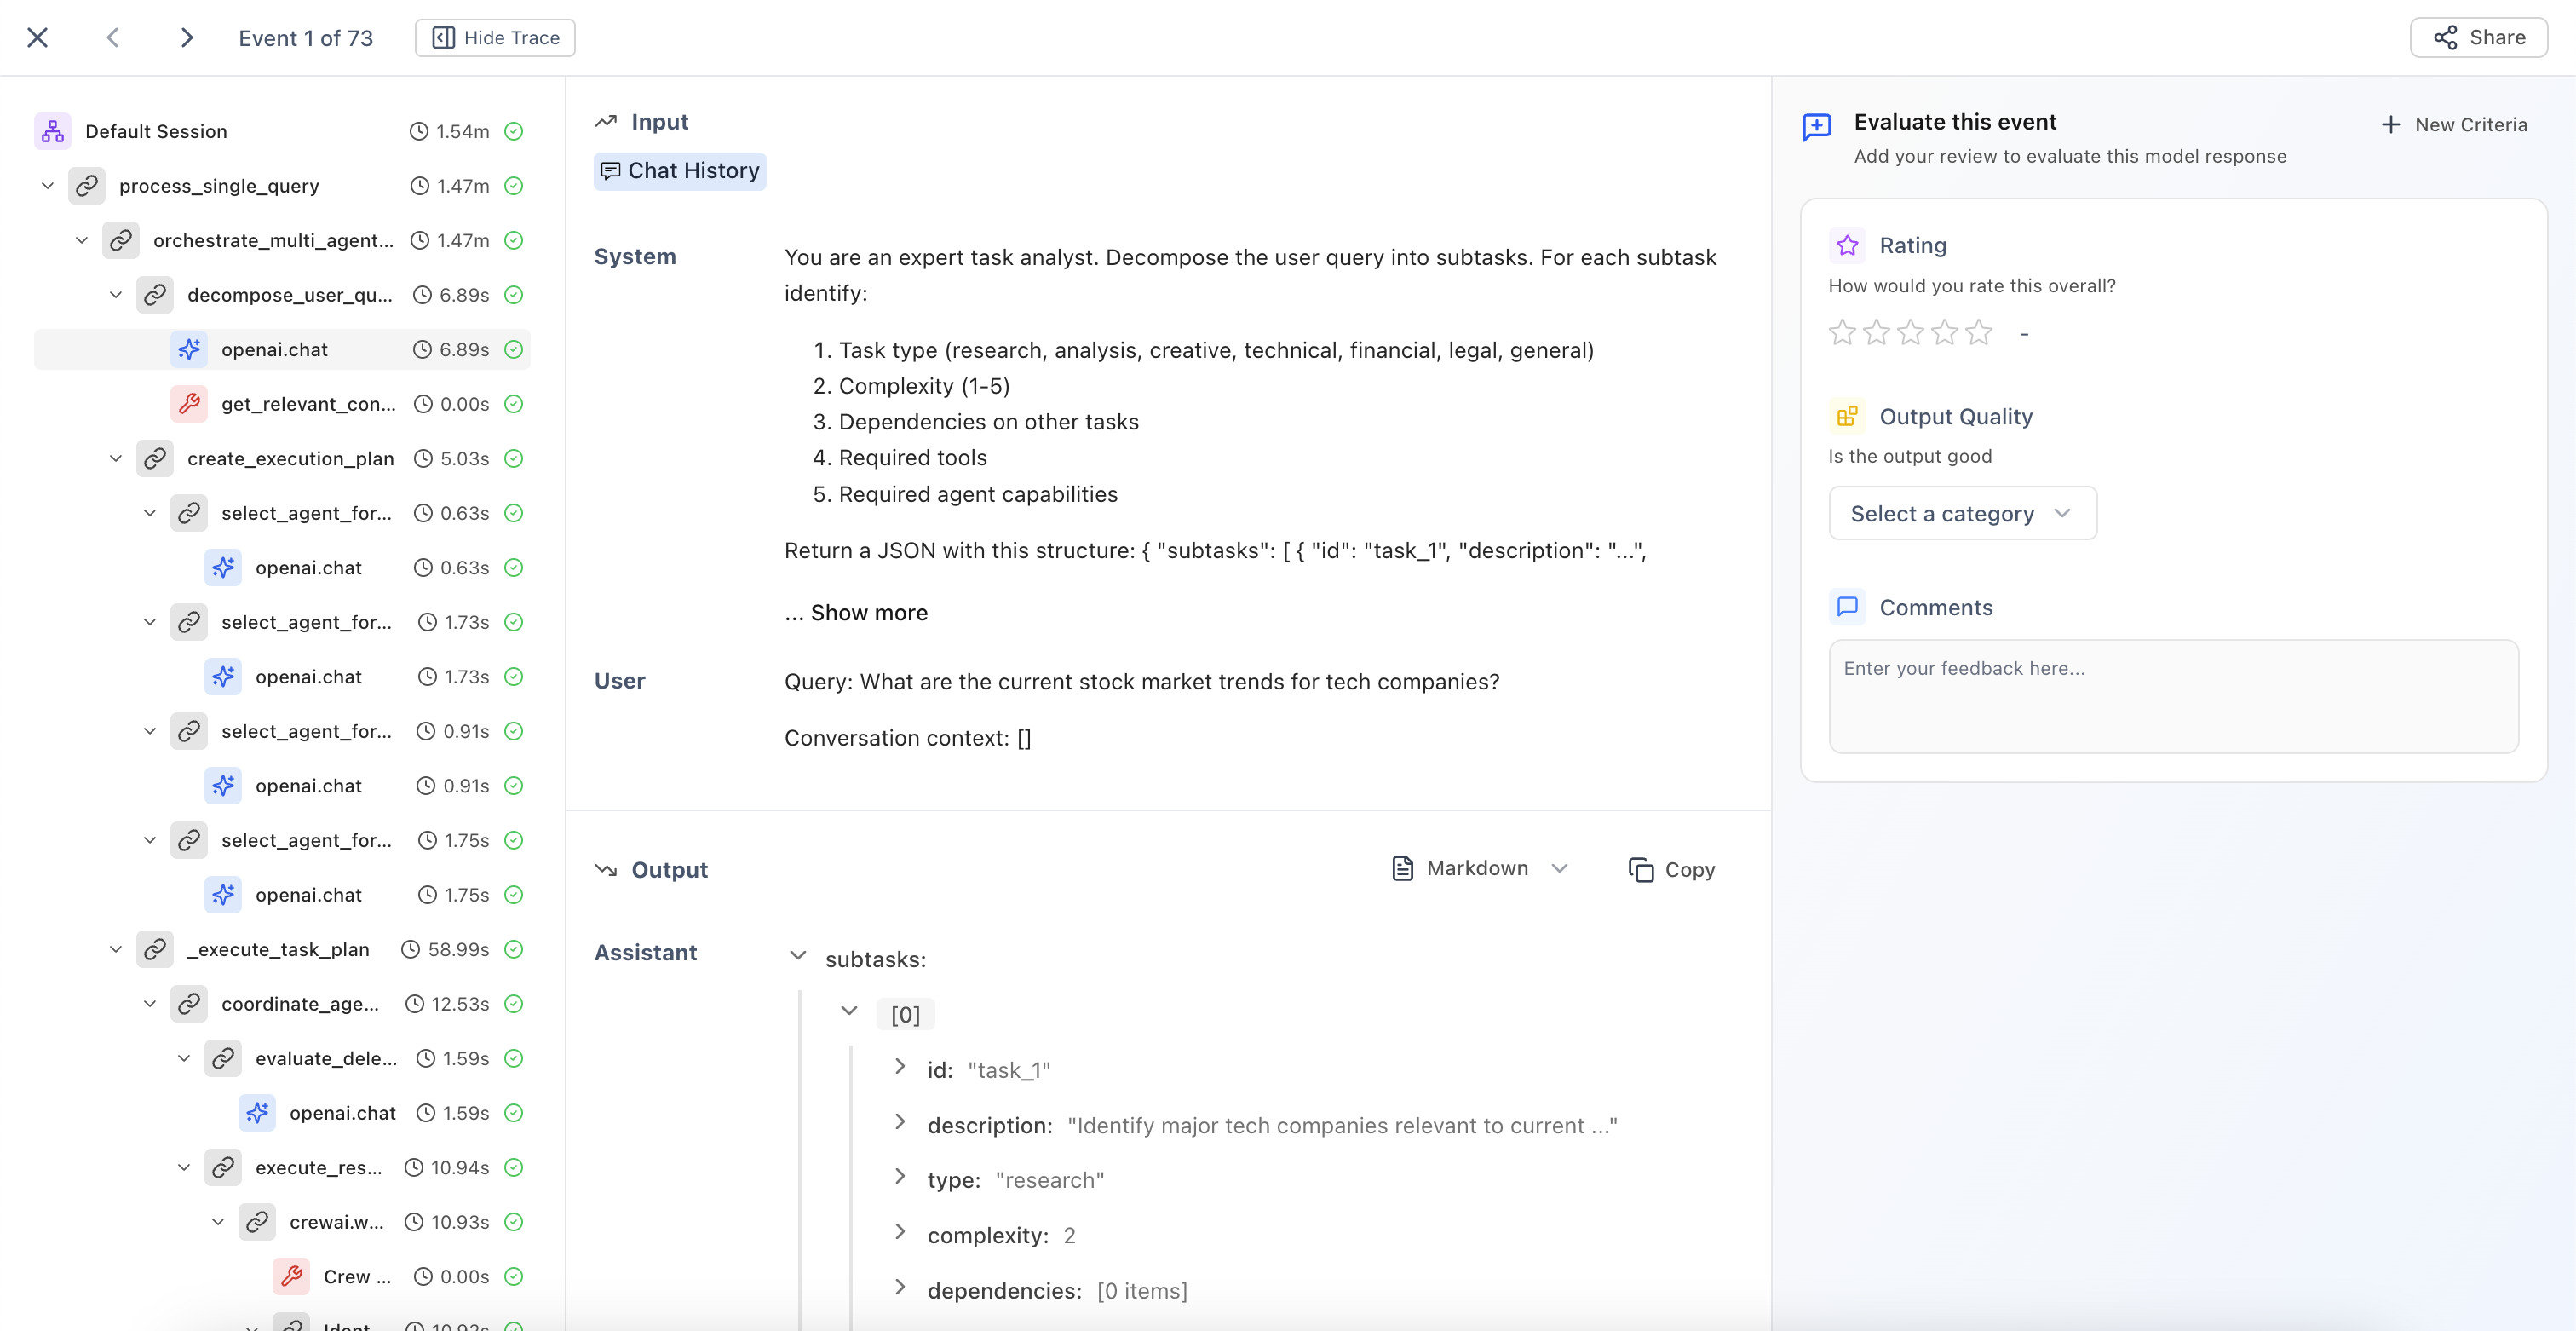 The UI now explicitly indicates whether you're providing reviews on:
Evaluate individual LLM responses with clear context about the model being reviewed.
Review end-to-end agent interactions and complete conversation flows.
Assess function and API call results with full execution context.
Analyze multi-step process results and complex execution paths.
This improved clarity helps domain experts provide more accurate and consistent feedback when working with complex multi-agent systems.
### Categorical Evaluators
New evaluator type that enables classification-based human evaluation with custom scoring.
The UI now explicitly indicates whether you're providing reviews on:
Evaluate individual LLM responses with clear context about the model being reviewed.
Review end-to-end agent interactions and complete conversation flows.
Assess function and API call results with full execution context.
Analyze multi-step process results and complex execution paths.
This improved clarity helps domain experts provide more accurate and consistent feedback when working with complex multi-agent systems.
### Categorical Evaluators
New evaluator type that enables classification-based human evaluation with custom scoring.
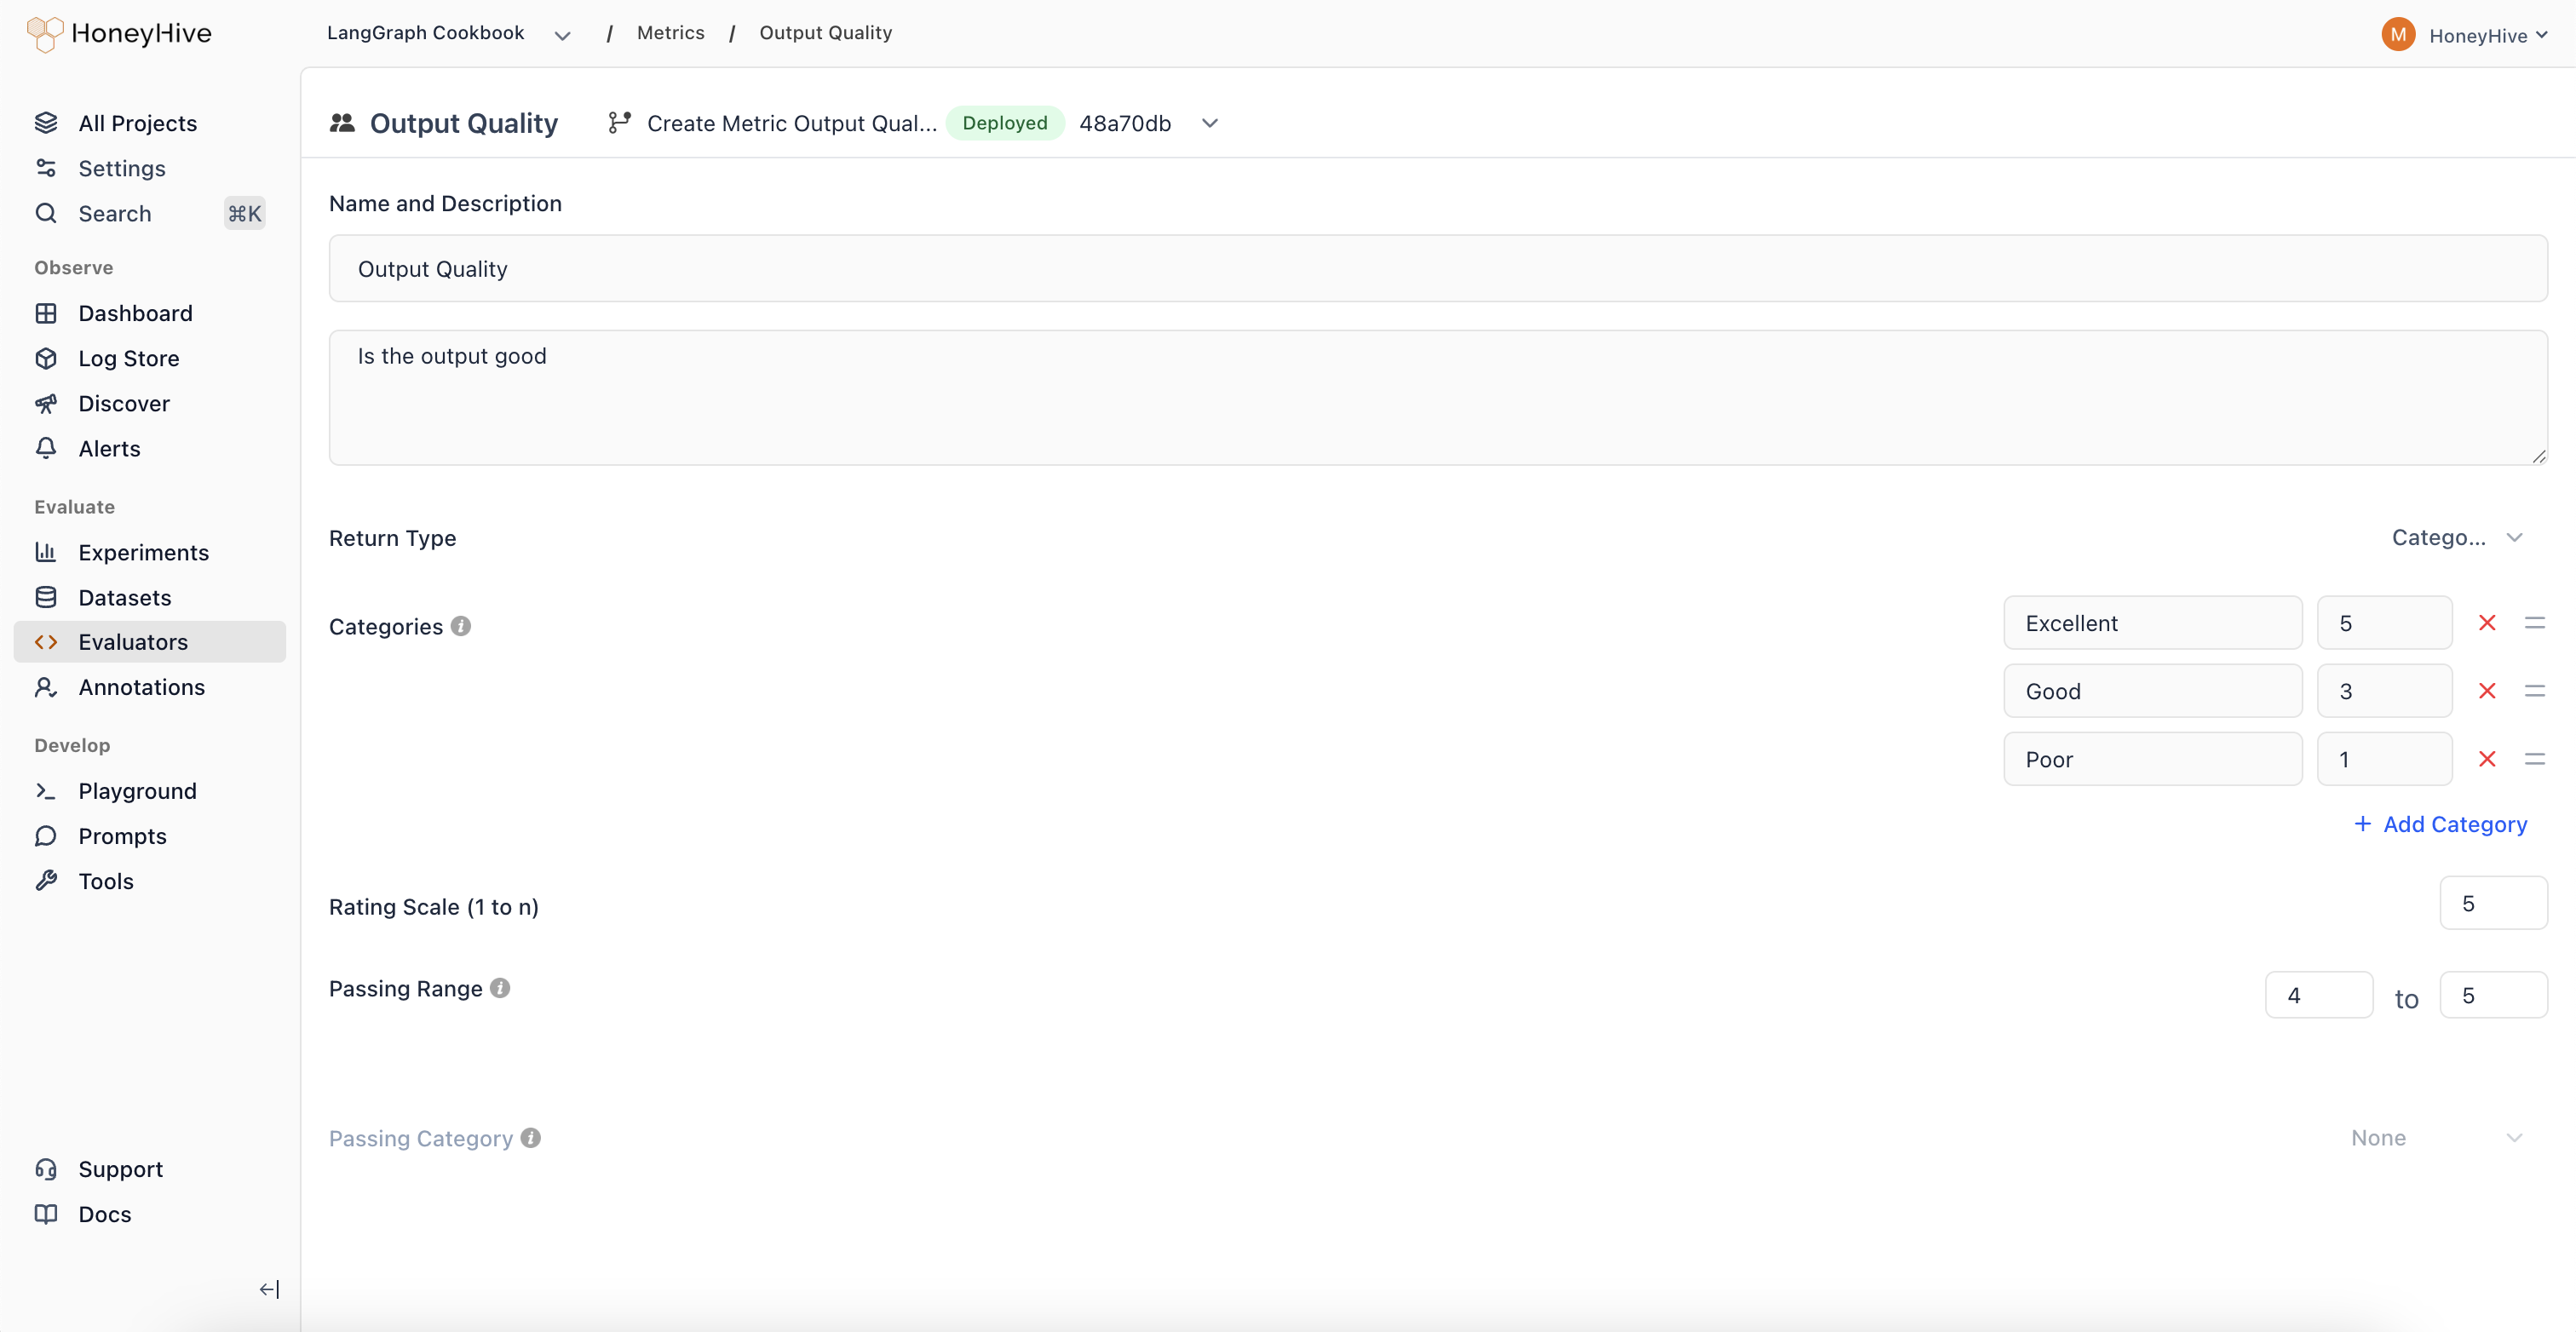 Define custom categorical labels and assign specific scores to each category.
Create binary classifications with associated scores for clear go/no-go decisions.
Track when outputs shift from high-scoring to low-scoring categories over time.
Define multiple categories representing different quality levels or response types.
Categorical evaluators provide more structured and interpretable evaluation results compared to purely numeric scores, making it easier to identify specific failure modes in your AI applications.
## Core Platform
### Thread View
New visualization mode that displays all LLM events and chat history in a unified, chronological timeline.
Define custom categorical labels and assign specific scores to each category.
Create binary classifications with associated scores for clear go/no-go decisions.
Track when outputs shift from high-scoring to low-scoring categories over time.
Define multiple categories representing different quality levels or response types.
Categorical evaluators provide more structured and interpretable evaluation results compared to purely numeric scores, making it easier to identify specific failure modes in your AI applications.
## Core Platform
### Thread View
New visualization mode that displays all LLM events and chat history in a unified, chronological timeline.
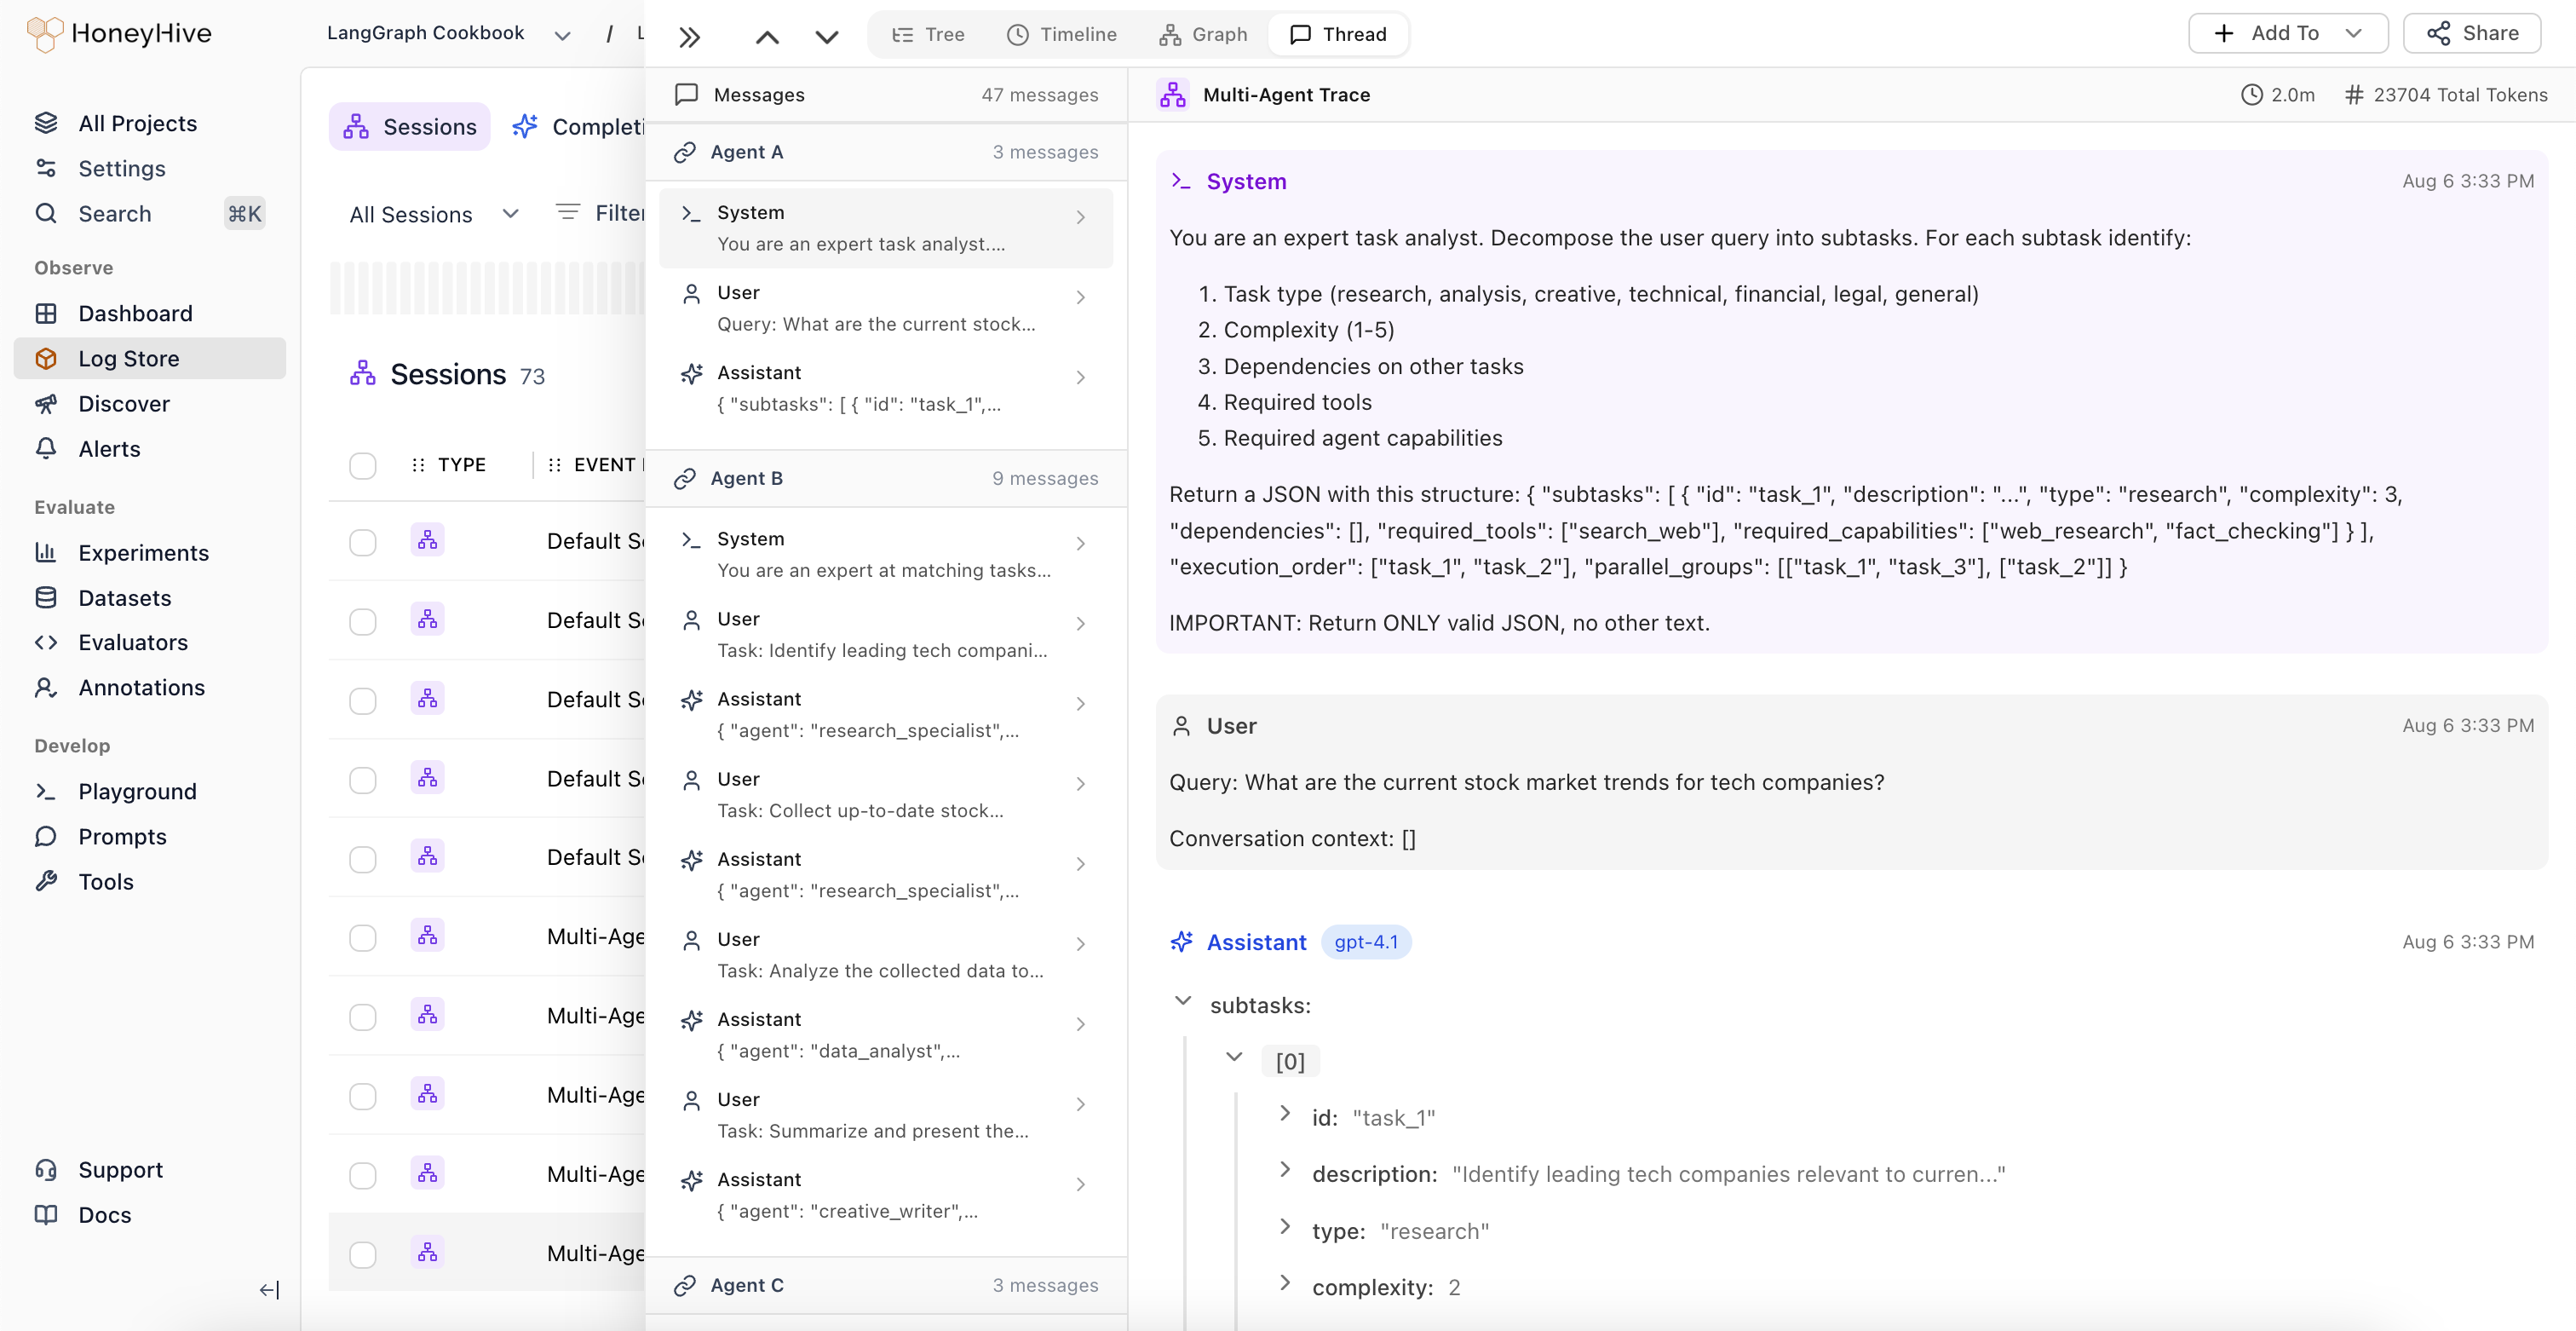 View all LLM events alongside complete chat history in a single interface. Understand the full context of multi-turn conversations without navigating through nested spans.
The system automatically identifies when control passes between different LLM workflows or agents, highlighting transition points in complex multi-agent systems.
Domain experts can provide feedback at the session level, which is automatically applied to the root span (session event) in the trace.
### Improved Graph View
Major enhancements to Graph View with automatic node deduplication and new analytical features.
View all LLM events alongside complete chat history in a single interface. Understand the full context of multi-turn conversations without navigating through nested spans.
The system automatically identifies when control passes between different LLM workflows or agents, highlighting transition points in complex multi-agent systems.
Domain experts can provide feedback at the session level, which is automatically applied to the root span (session event) in the trace.
### Improved Graph View
Major enhancements to Graph View with automatic node deduplication and new analytical features.
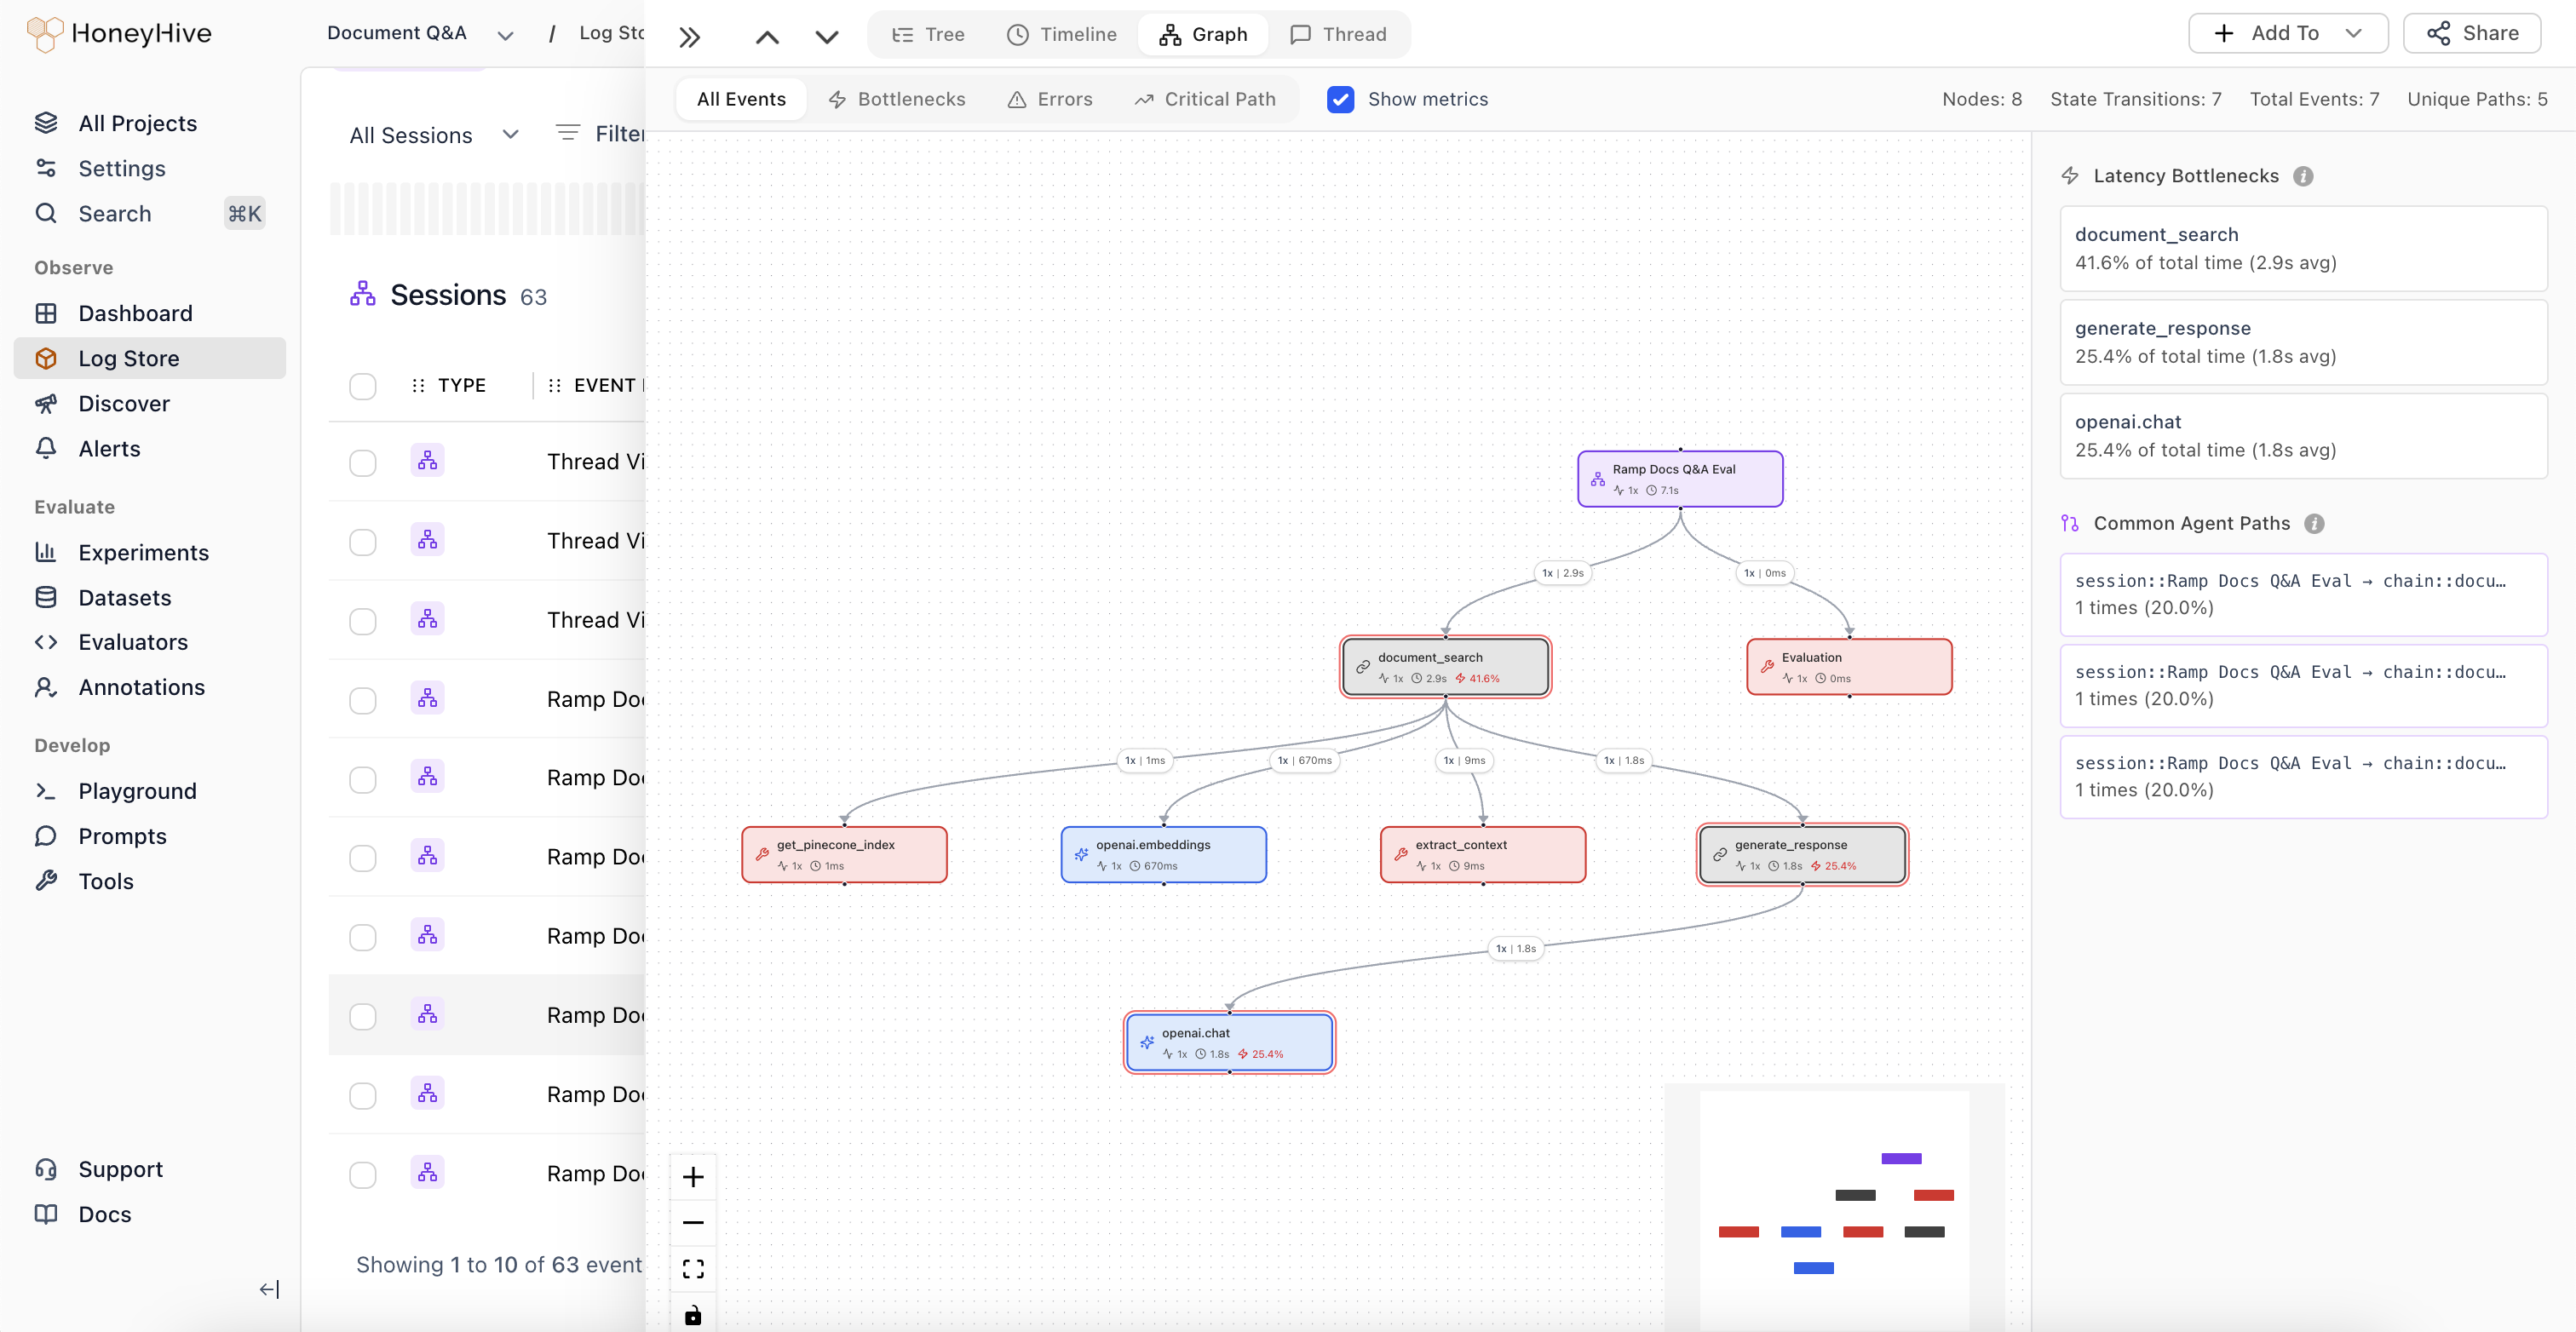 The graph now intelligently deduplicates nodes, simplifying visualization of complex agent trajectories.
View total number of nodes, state transitions, and structural complexity metrics for your agent workflows.
Edge thickness represents execution frequency, making common paths immediately visible.
Identify which nodes are causing performance issues in your agent workflows.
Visualize the most frequent paths through your agent's decision tree to understand typical execution patterns.
### [Introducing Alerts](/v2/monitoring/alerts/alerts_overview)
Monitor key metrics and get notified when behavior changes in your AI applications.
The graph now intelligently deduplicates nodes, simplifying visualization of complex agent trajectories.
View total number of nodes, state transitions, and structural complexity metrics for your agent workflows.
Edge thickness represents execution frequency, making common paths immediately visible.
Identify which nodes are causing performance issues in your agent workflows.
Visualize the most frequent paths through your agent's decision tree to understand typical execution patterns.
### [Introducing Alerts](/v2/monitoring/alerts/alerts_overview)
Monitor key metrics and get notified when behavior changes in your AI applications.
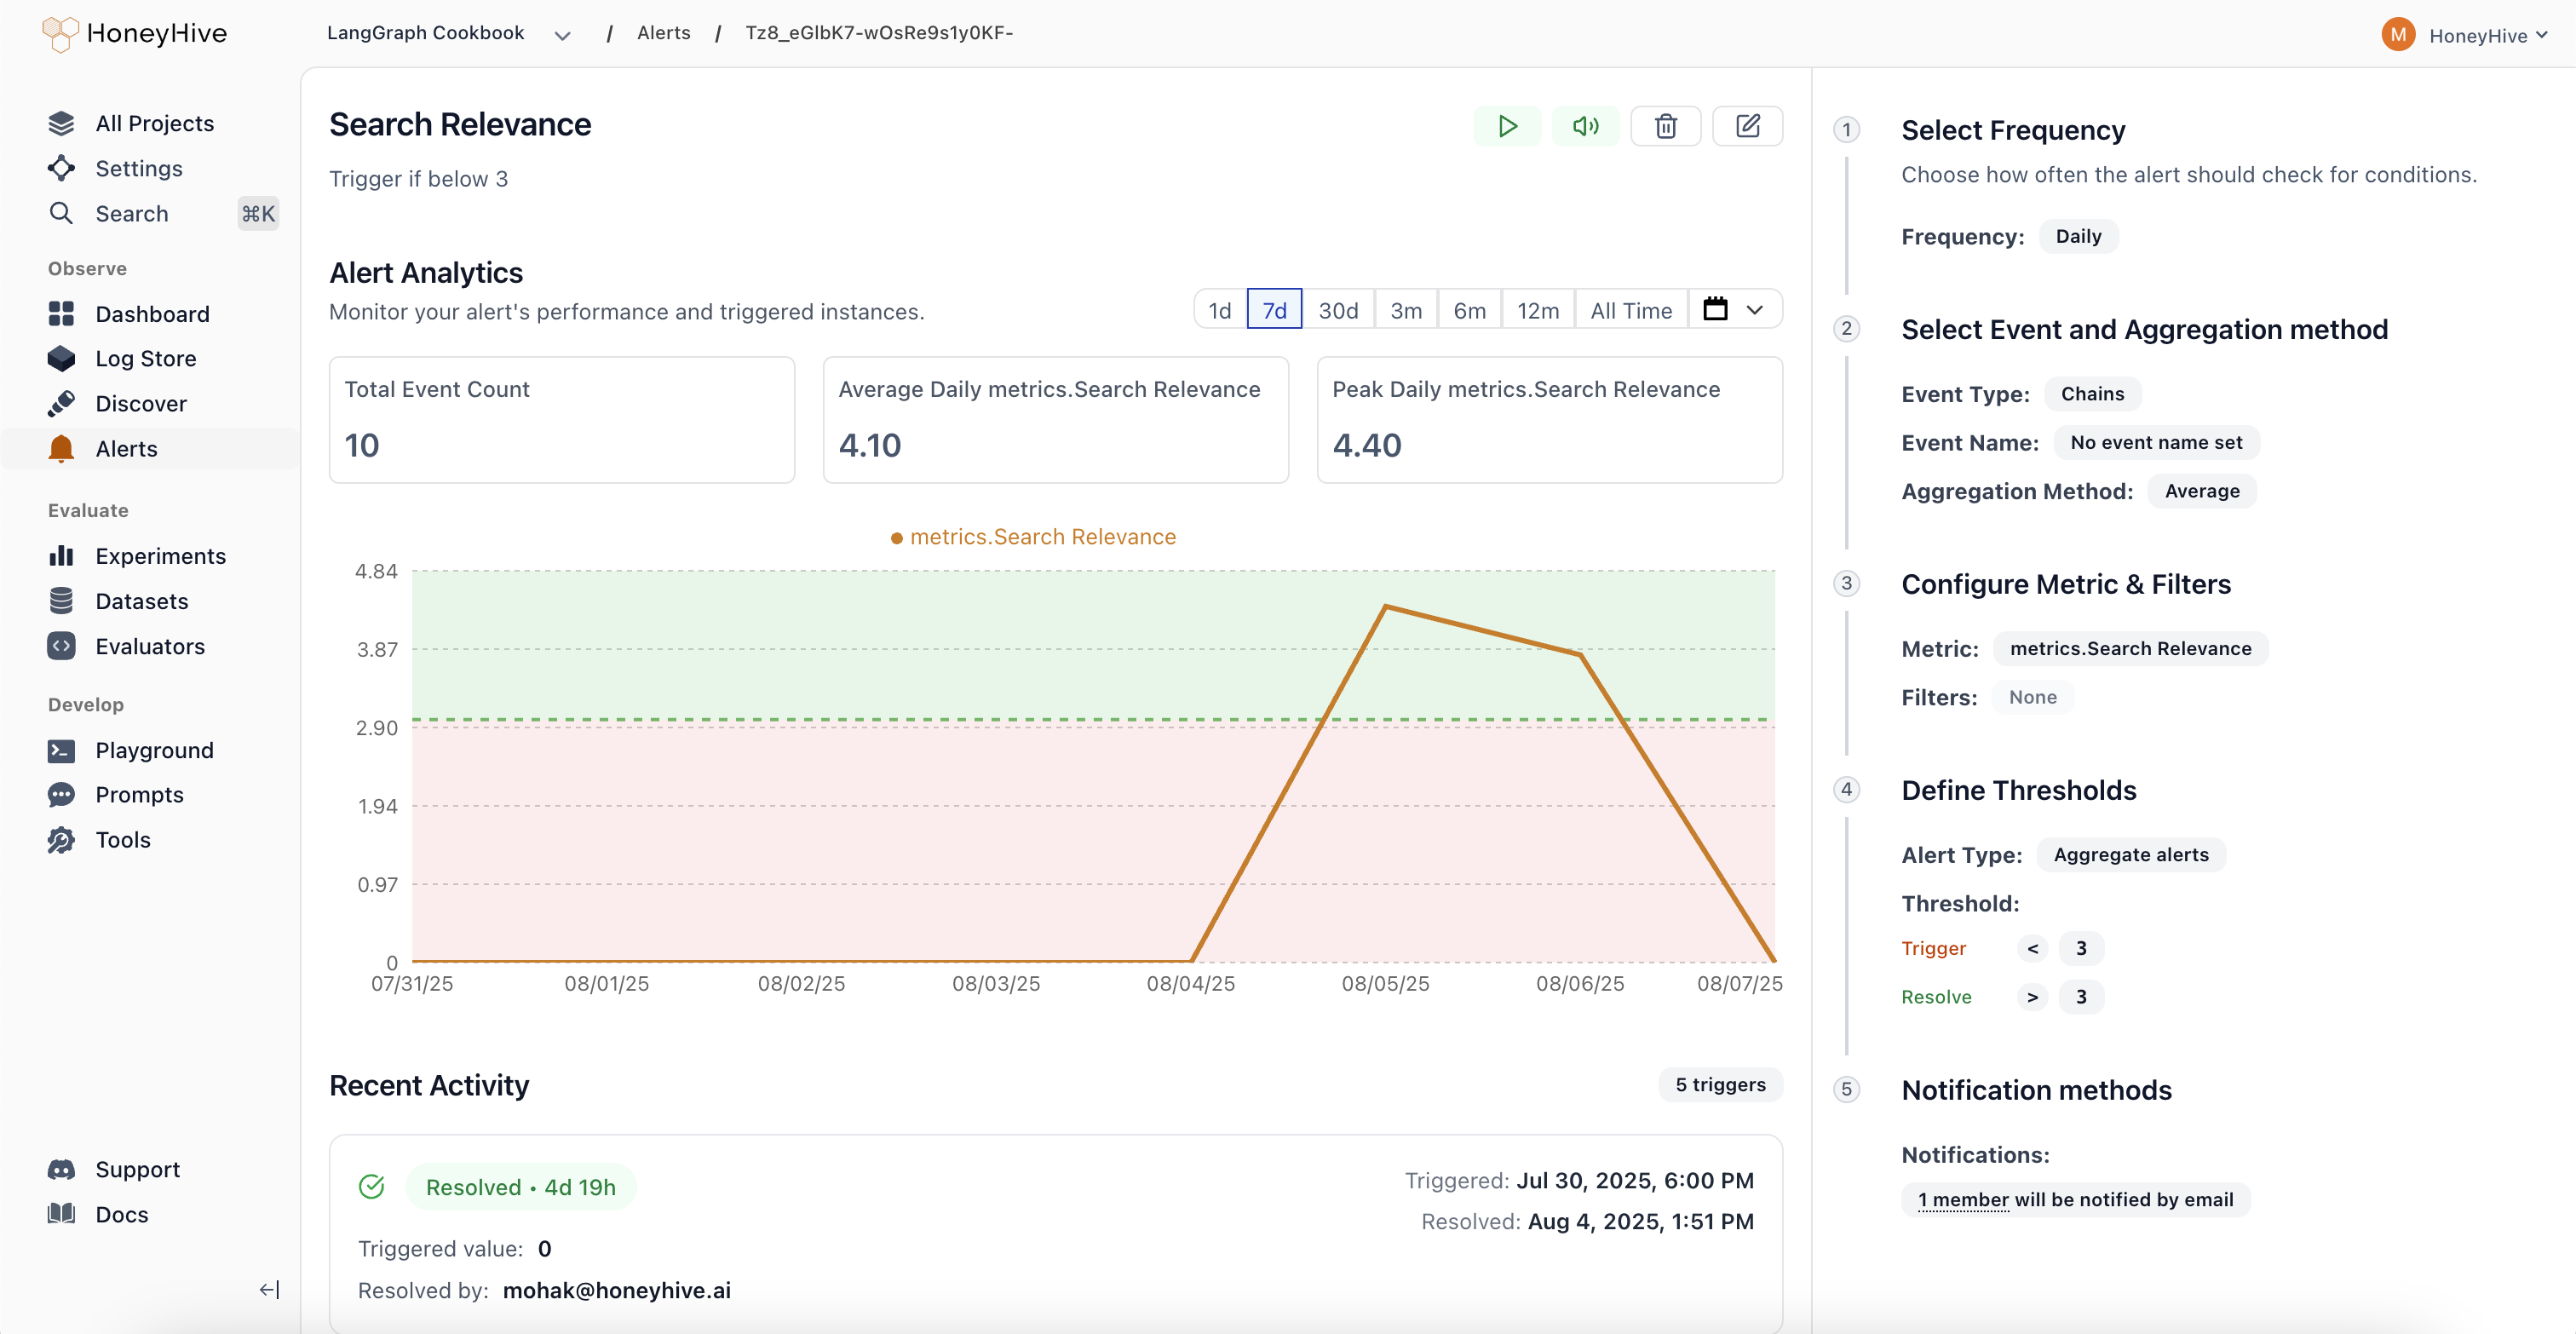 1. **Comprehensive Monitoring:**
Track performance metrics (latency, error rate), quality scores from evaluators, cost and usage patterns, plus any custom fields from your events or sessions. Get visibility into what matters most for your AI applications.
2. **Smart Alert Types:**
**Aggregate Alerts** trigger when metrics cross absolute thresholds, while **Drift Alerts** detect when current performance deviates from previous periods by a configurable percentage. Choose the right detection method for your use case.
3. **Flexible Scheduling:**
Configure alerts to run hourly, daily, weekly, or monthly based on your monitoring needs. Set custom evaluation windows to balance responsiveness with noise reduction.
4. **Streamlined Workflow:**
Real-time preview charts show exactly what your alert will monitor, guided configuration in the right panel walks you through setup, and a recent activity feed tracks alert history. Manage alert states (Active, Triggered, Resolved, Paused, Muted) directly from each alert's detail page.
### Evaluator Templates Gallery
Quick-start your evaluations with pre-built templates organized by use case: Agent Trajectory, Tool Selection, RAG, Summarization, Translation, Structured Output, Code Generation, Performance, Safety, and Traditional NLP.
1. **Comprehensive Monitoring:**
Track performance metrics (latency, error rate), quality scores from evaluators, cost and usage patterns, plus any custom fields from your events or sessions. Get visibility into what matters most for your AI applications.
2. **Smart Alert Types:**
**Aggregate Alerts** trigger when metrics cross absolute thresholds, while **Drift Alerts** detect when current performance deviates from previous periods by a configurable percentage. Choose the right detection method for your use case.
3. **Flexible Scheduling:**
Configure alerts to run hourly, daily, weekly, or monthly based on your monitoring needs. Set custom evaluation windows to balance responsiveness with noise reduction.
4. **Streamlined Workflow:**
Real-time preview charts show exactly what your alert will monitor, guided configuration in the right panel walks you through setup, and a recent activity feed tracks alert history. Manage alert states (Active, Triggered, Resolved, Paused, Muted) directly from each alert's detail page.
### Evaluator Templates Gallery
Quick-start your evaluations with pre-built templates organized by use case: Agent Trajectory, Tool Selection, RAG, Summarization, Translation, Structured Output, Code Generation, Performance, Safety, and Traditional NLP.
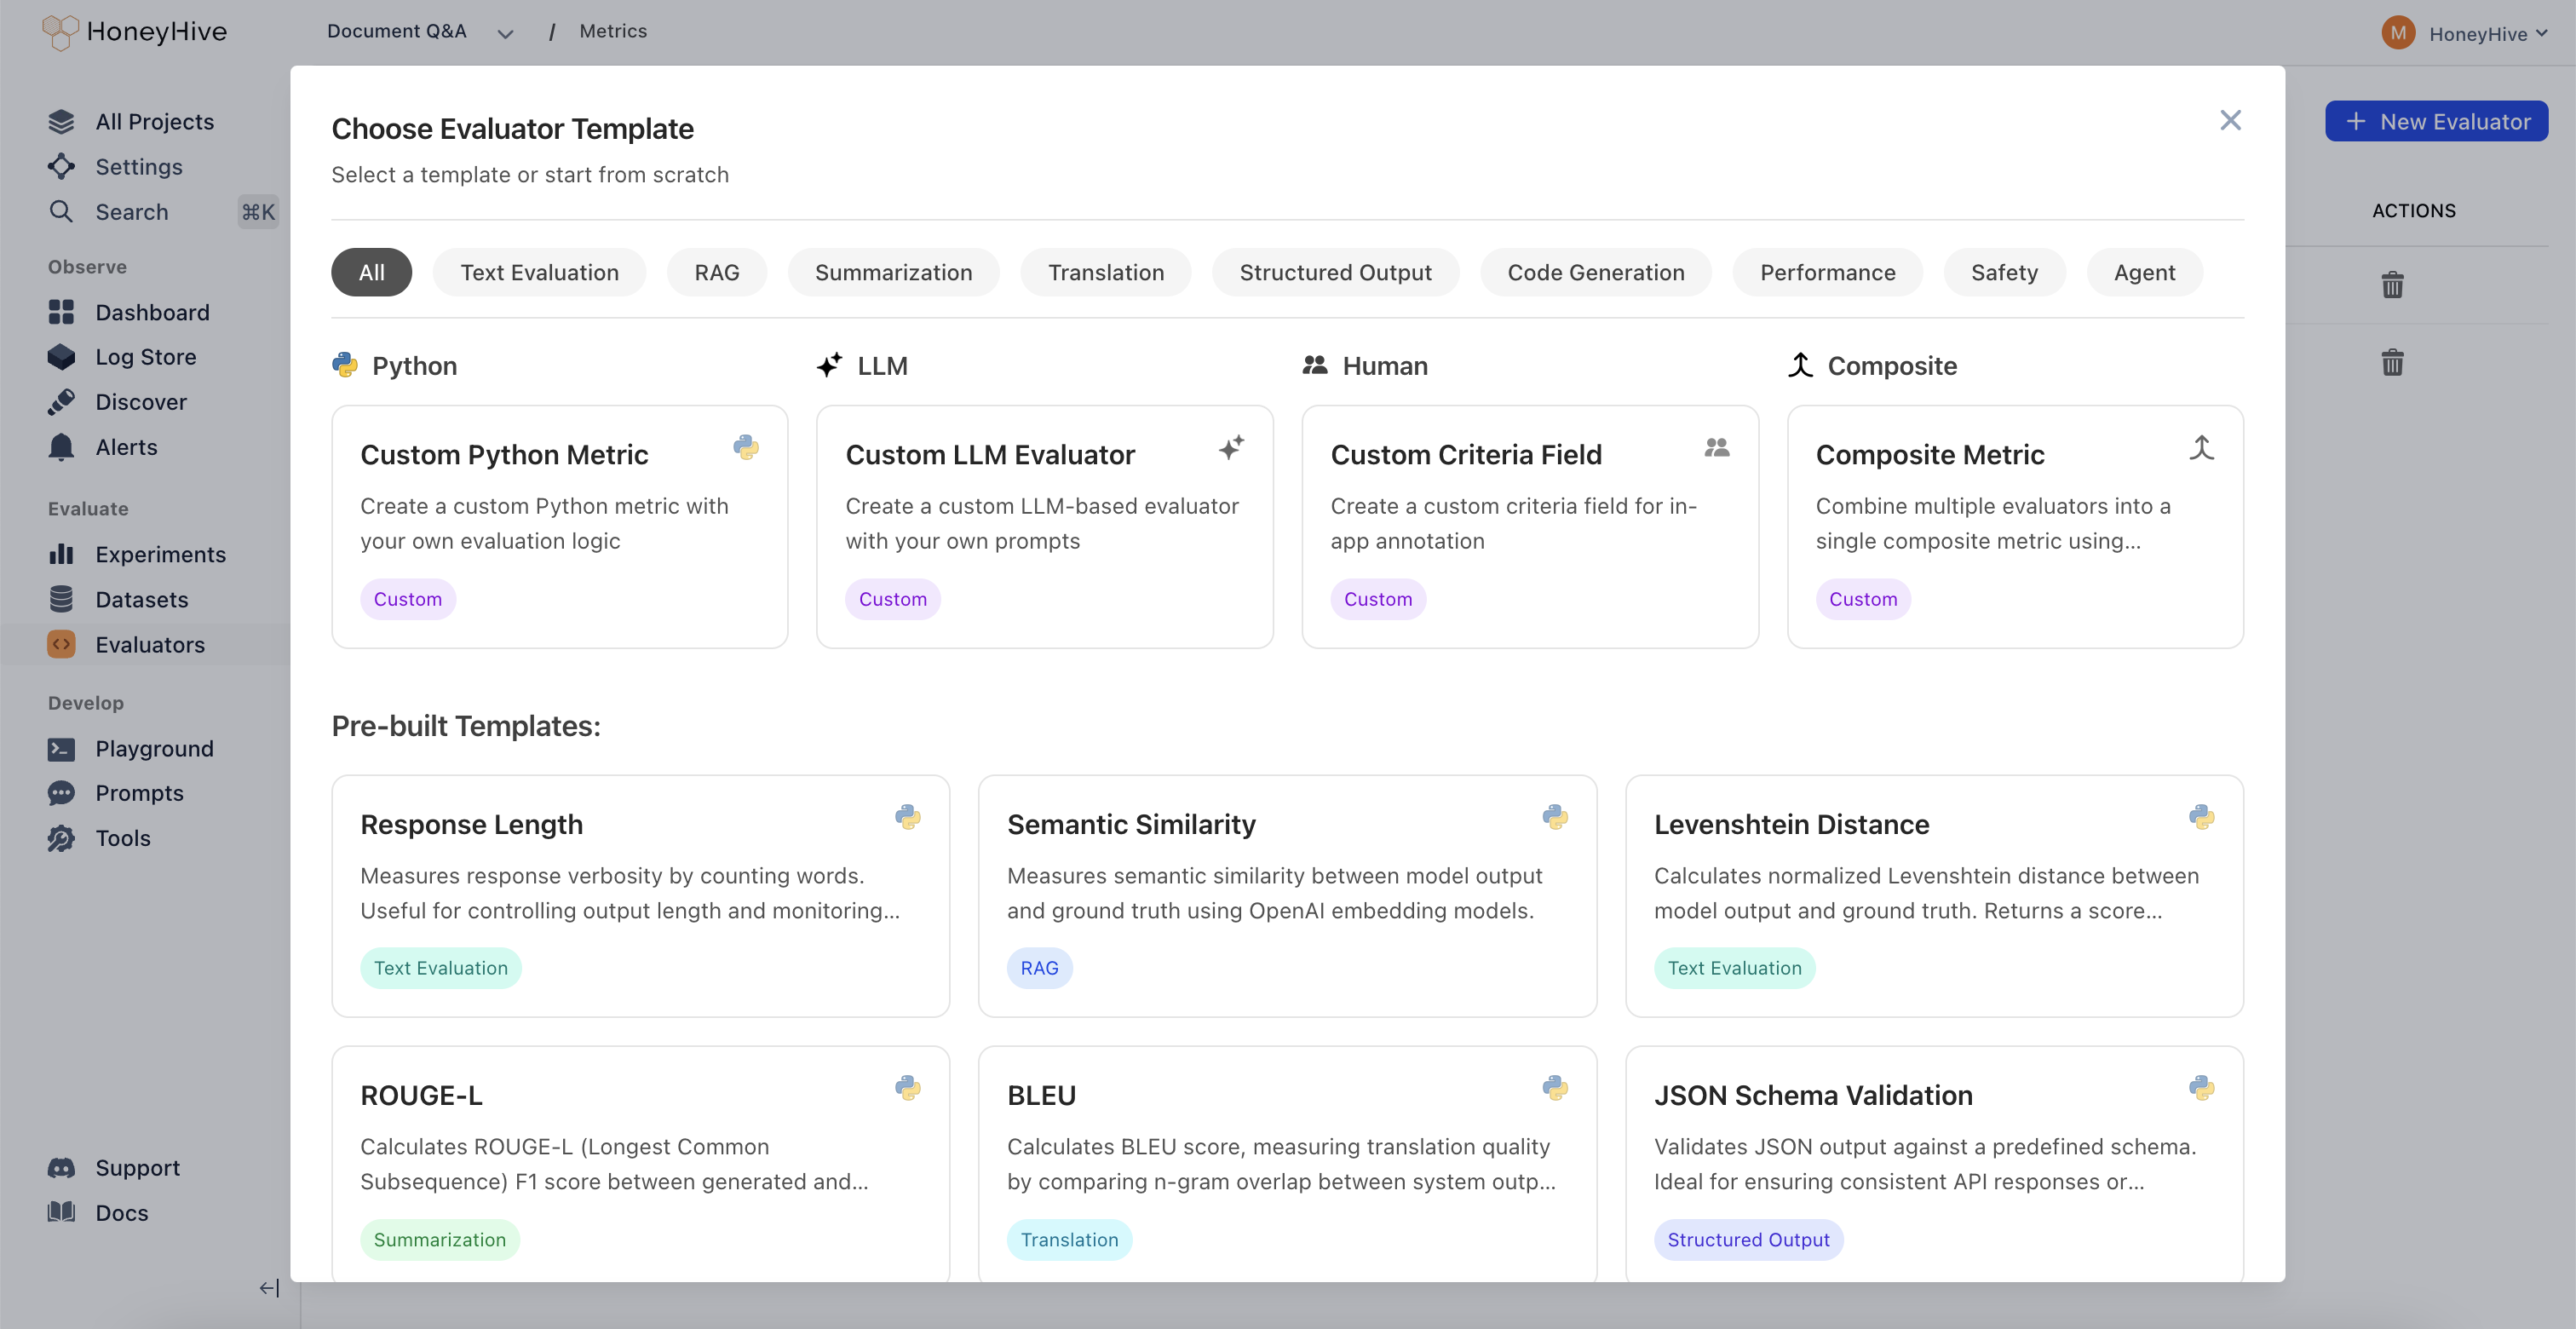 ## Core Platform
### New Trace Visualization Modes
1. **Session Summaries and New Tree View:**
Unified view of metrics, evaluations, and feedback across all spans in an agent session. Get a comprehensive overview without jumping between individual spans to understand overall session performance.
## Core Platform
### New Trace Visualization Modes
1. **Session Summaries and New Tree View:**
Unified view of metrics, evaluations, and feedback across all spans in an agent session. Get a comprehensive overview without jumping between individual spans to understand overall session performance.
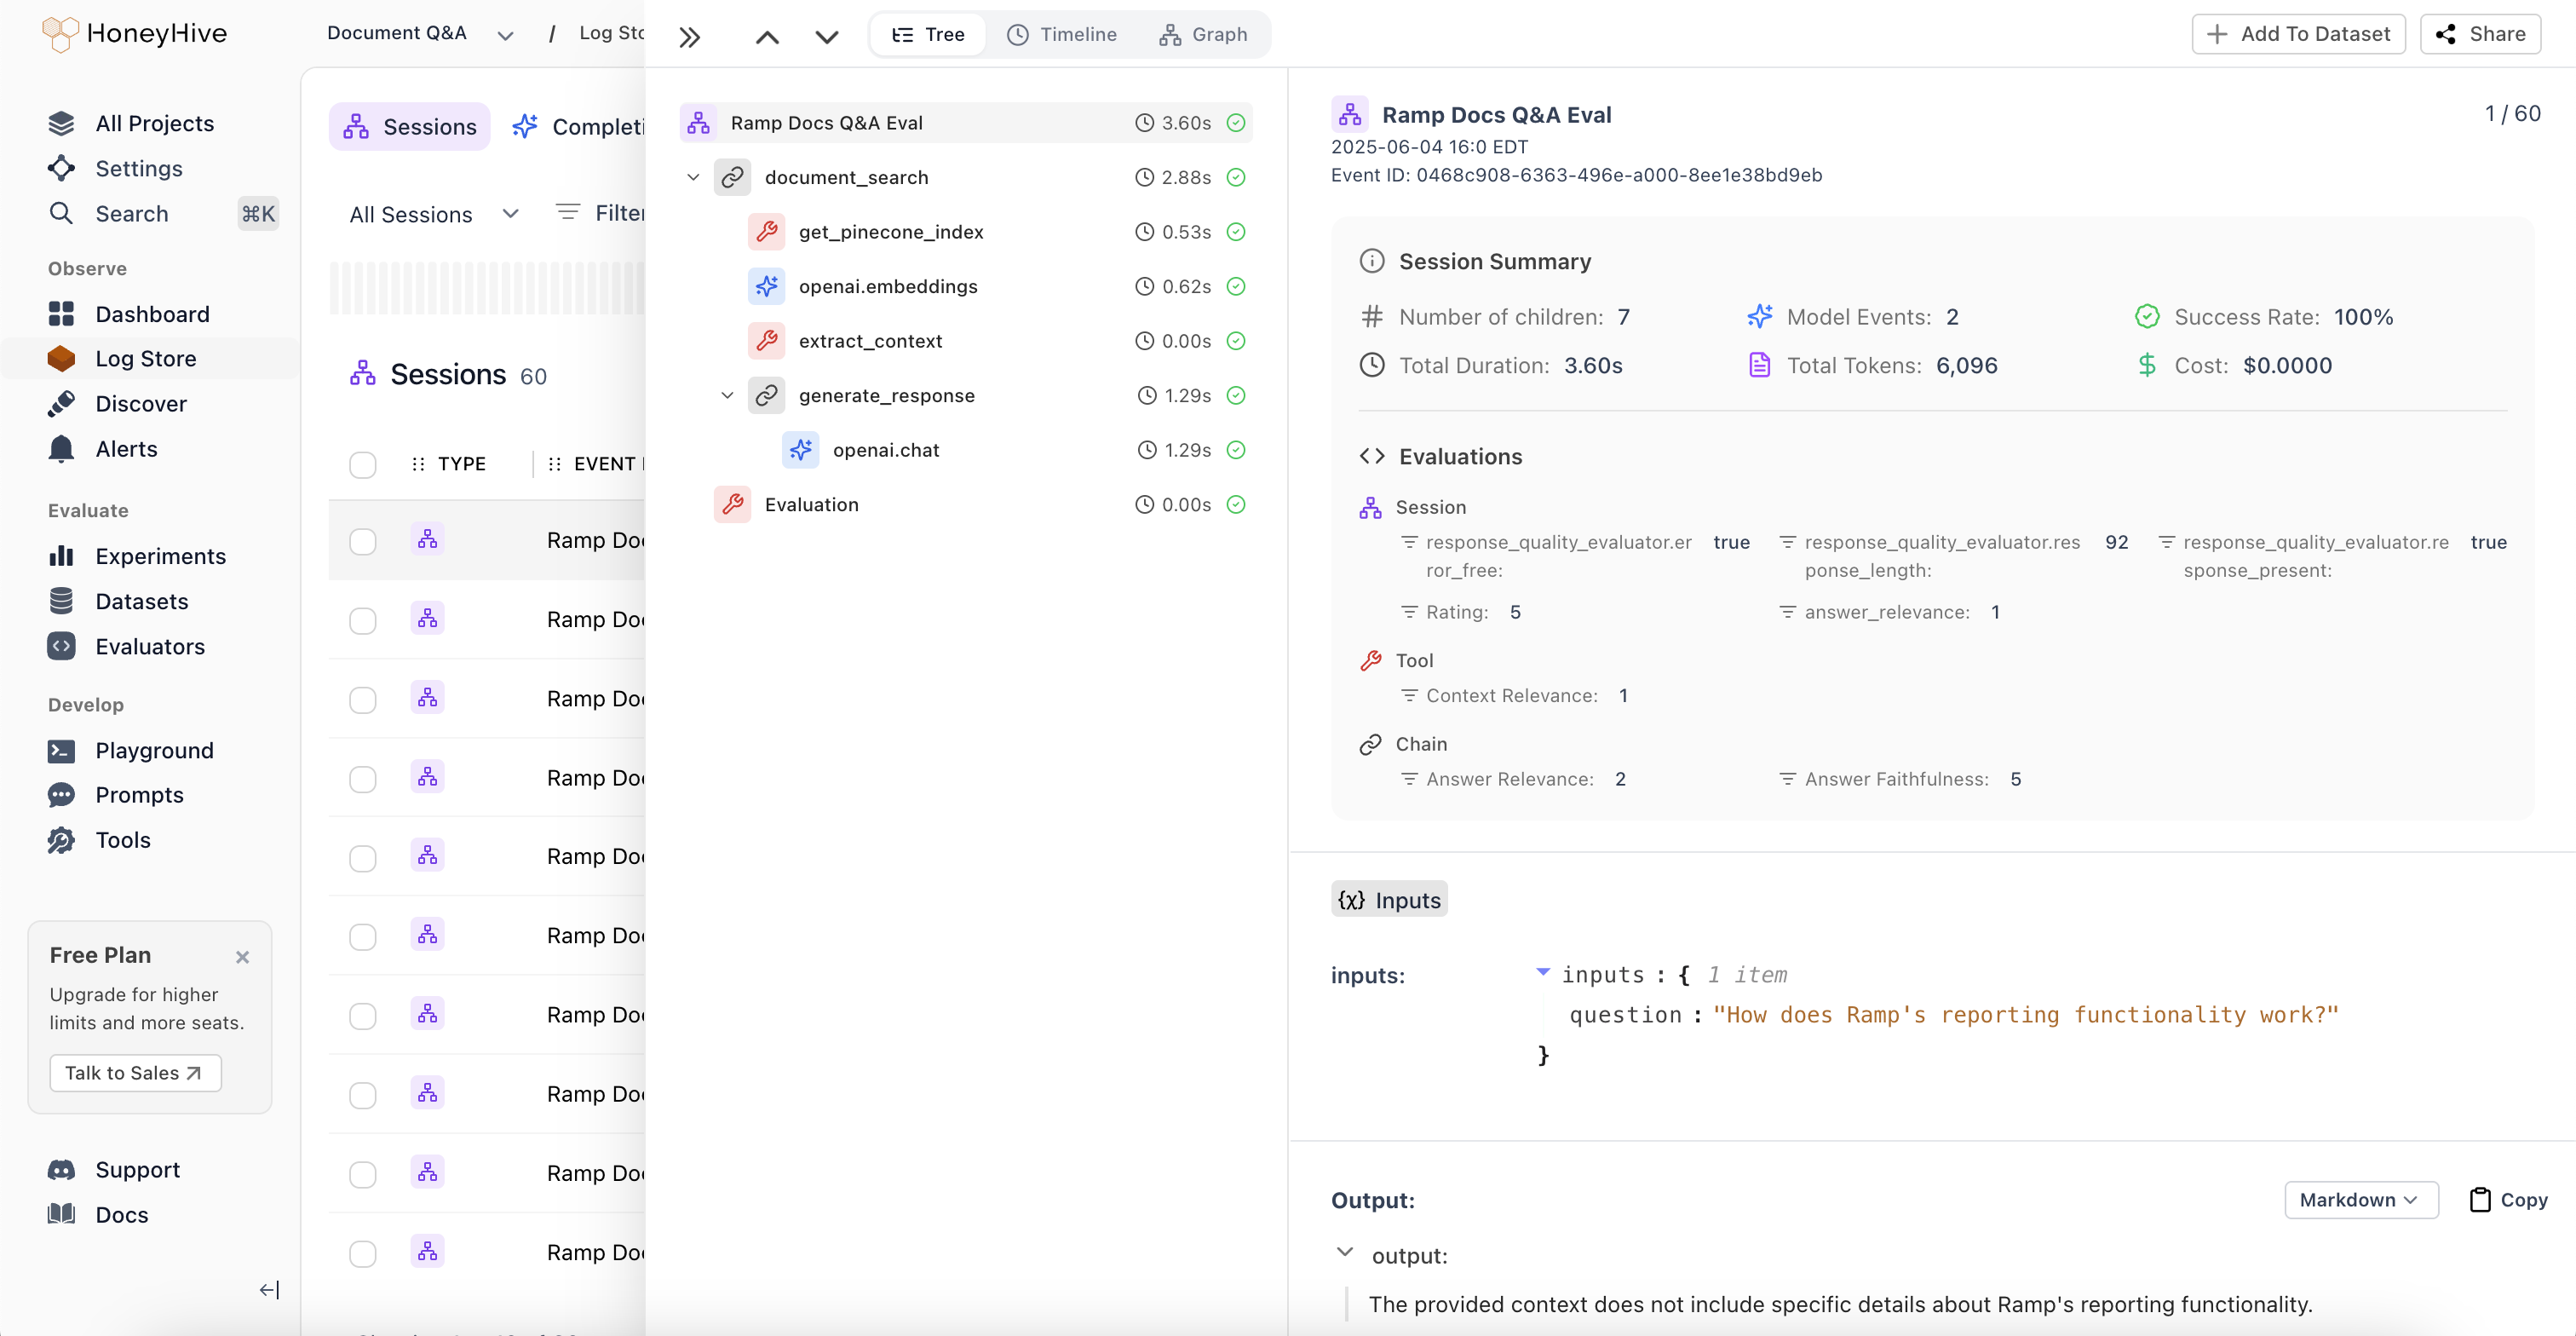 2. **Timeline View:**
Flamegraph visualization that identifies latency bottlenecks and shows the relationship between sequential and parallel operations in your agent workflows. Perfect for performance optimization and understanding execution flow.
2. **Timeline View:**
Flamegraph visualization that identifies latency bottlenecks and shows the relationship between sequential and parallel operations in your agent workflows. Perfect for performance optimization and understanding execution flow.
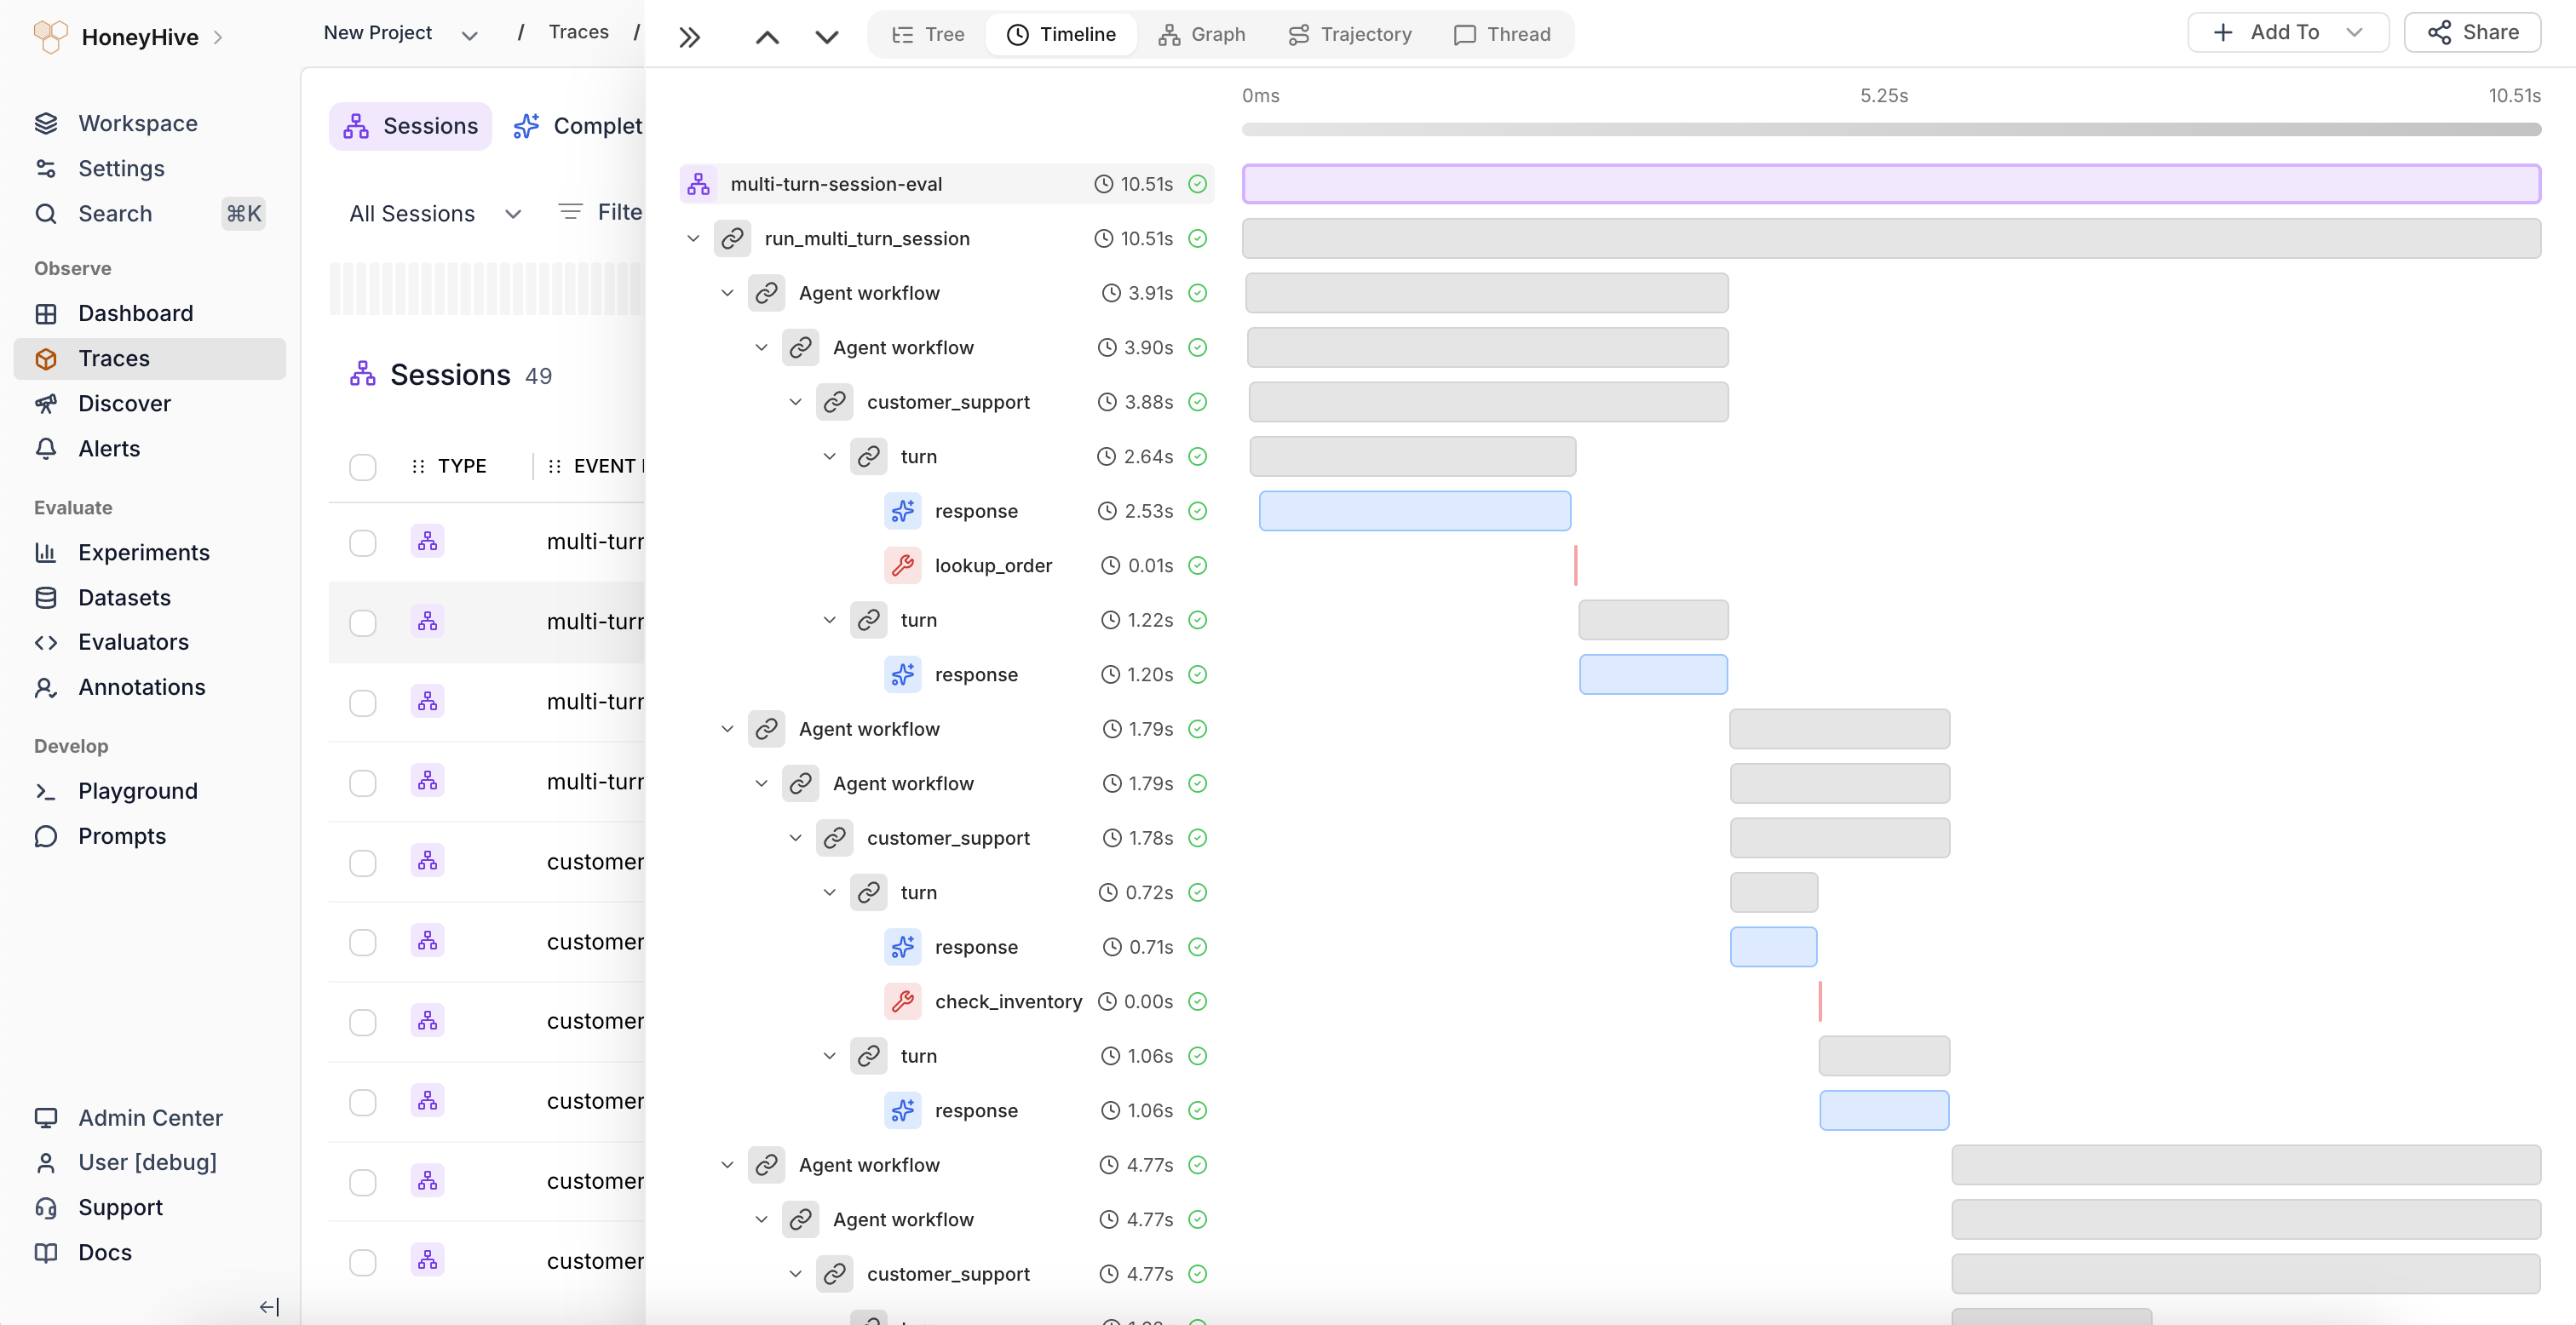 3. **Graph View:**
Visual representation of complex execution paths and decision points through multi-agent workflows. Quickly understand how your agents interact and make decisions at a glance.
3. **Graph View:**
Visual representation of complex execution paths and decision points through multi-agent workflows. Quickly understand how your agents interact and make decisions at a glance.
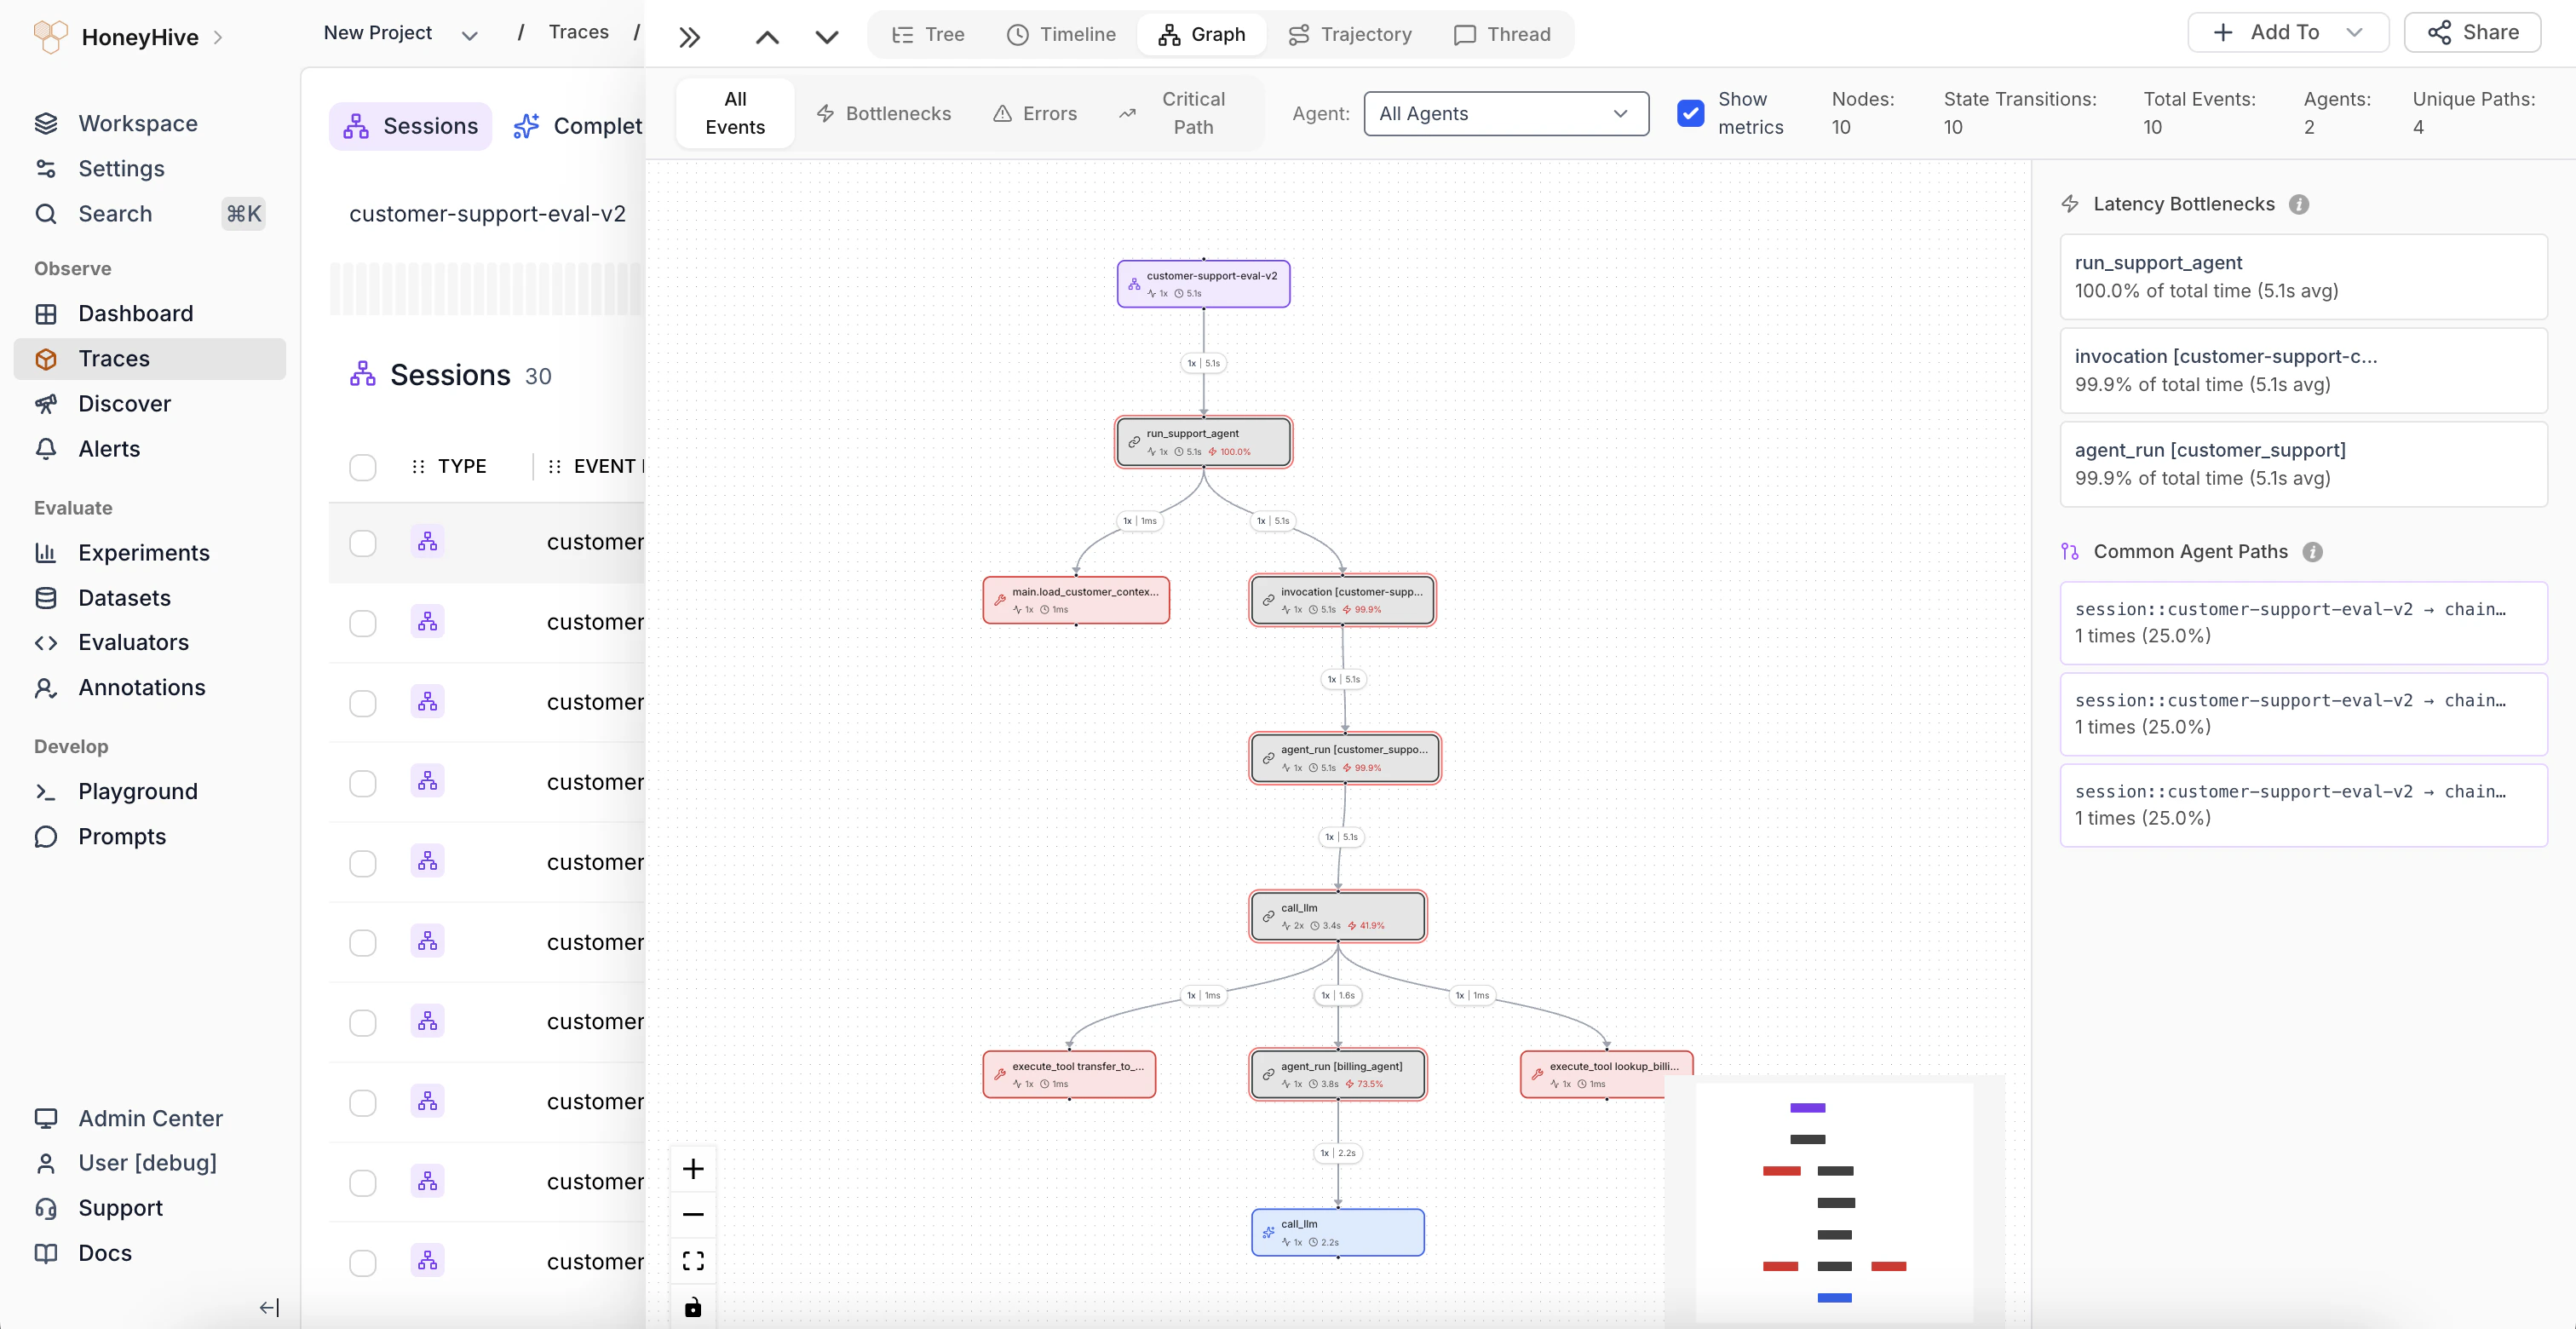 ### Improved Log Store Analytics
**Volume Charts:** New mini-charts display request volume patterns over time directly in the sessions table, providing instant visibility into traffic trends and activity levels without needing to drill into individual sessions.
### Improved Log Store Analytics
**Volume Charts:** New mini-charts display request volume patterns over time directly in the sessions table, providing instant visibility into traffic trends and activity levels without needing to drill into individual sessions.
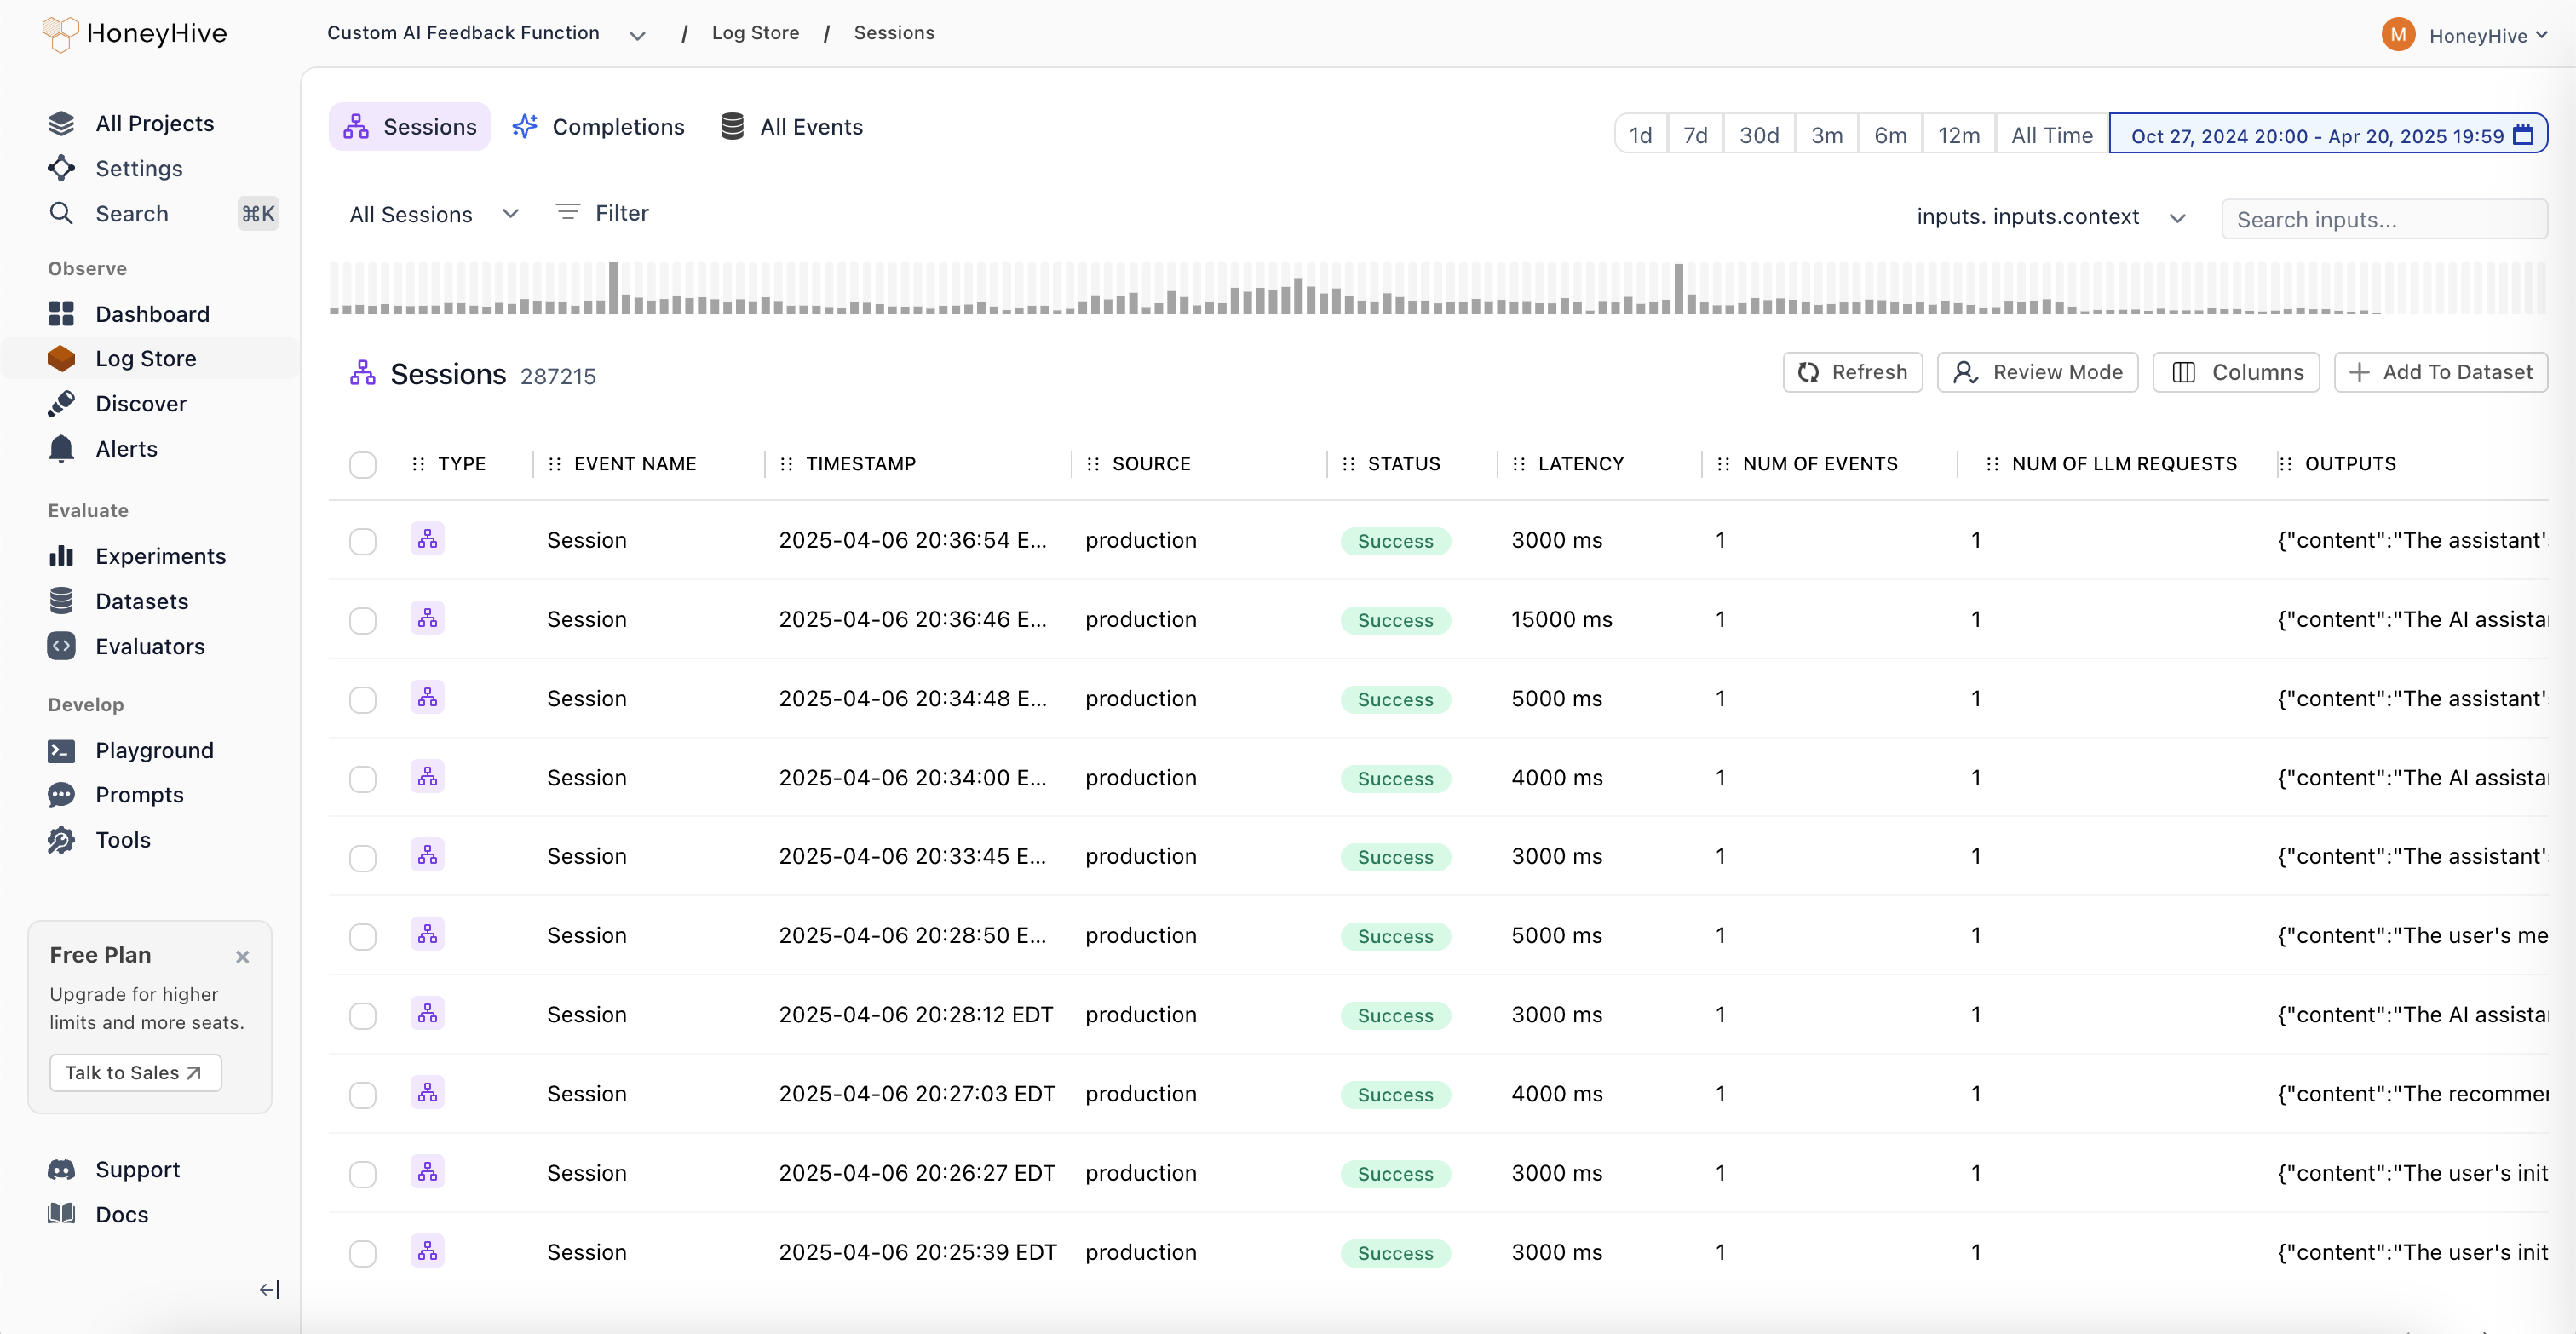 ## Core Platform
### Role-Based Access Control (RBAC)
## Core Platform
### Role-Based Access Control (RBAC)
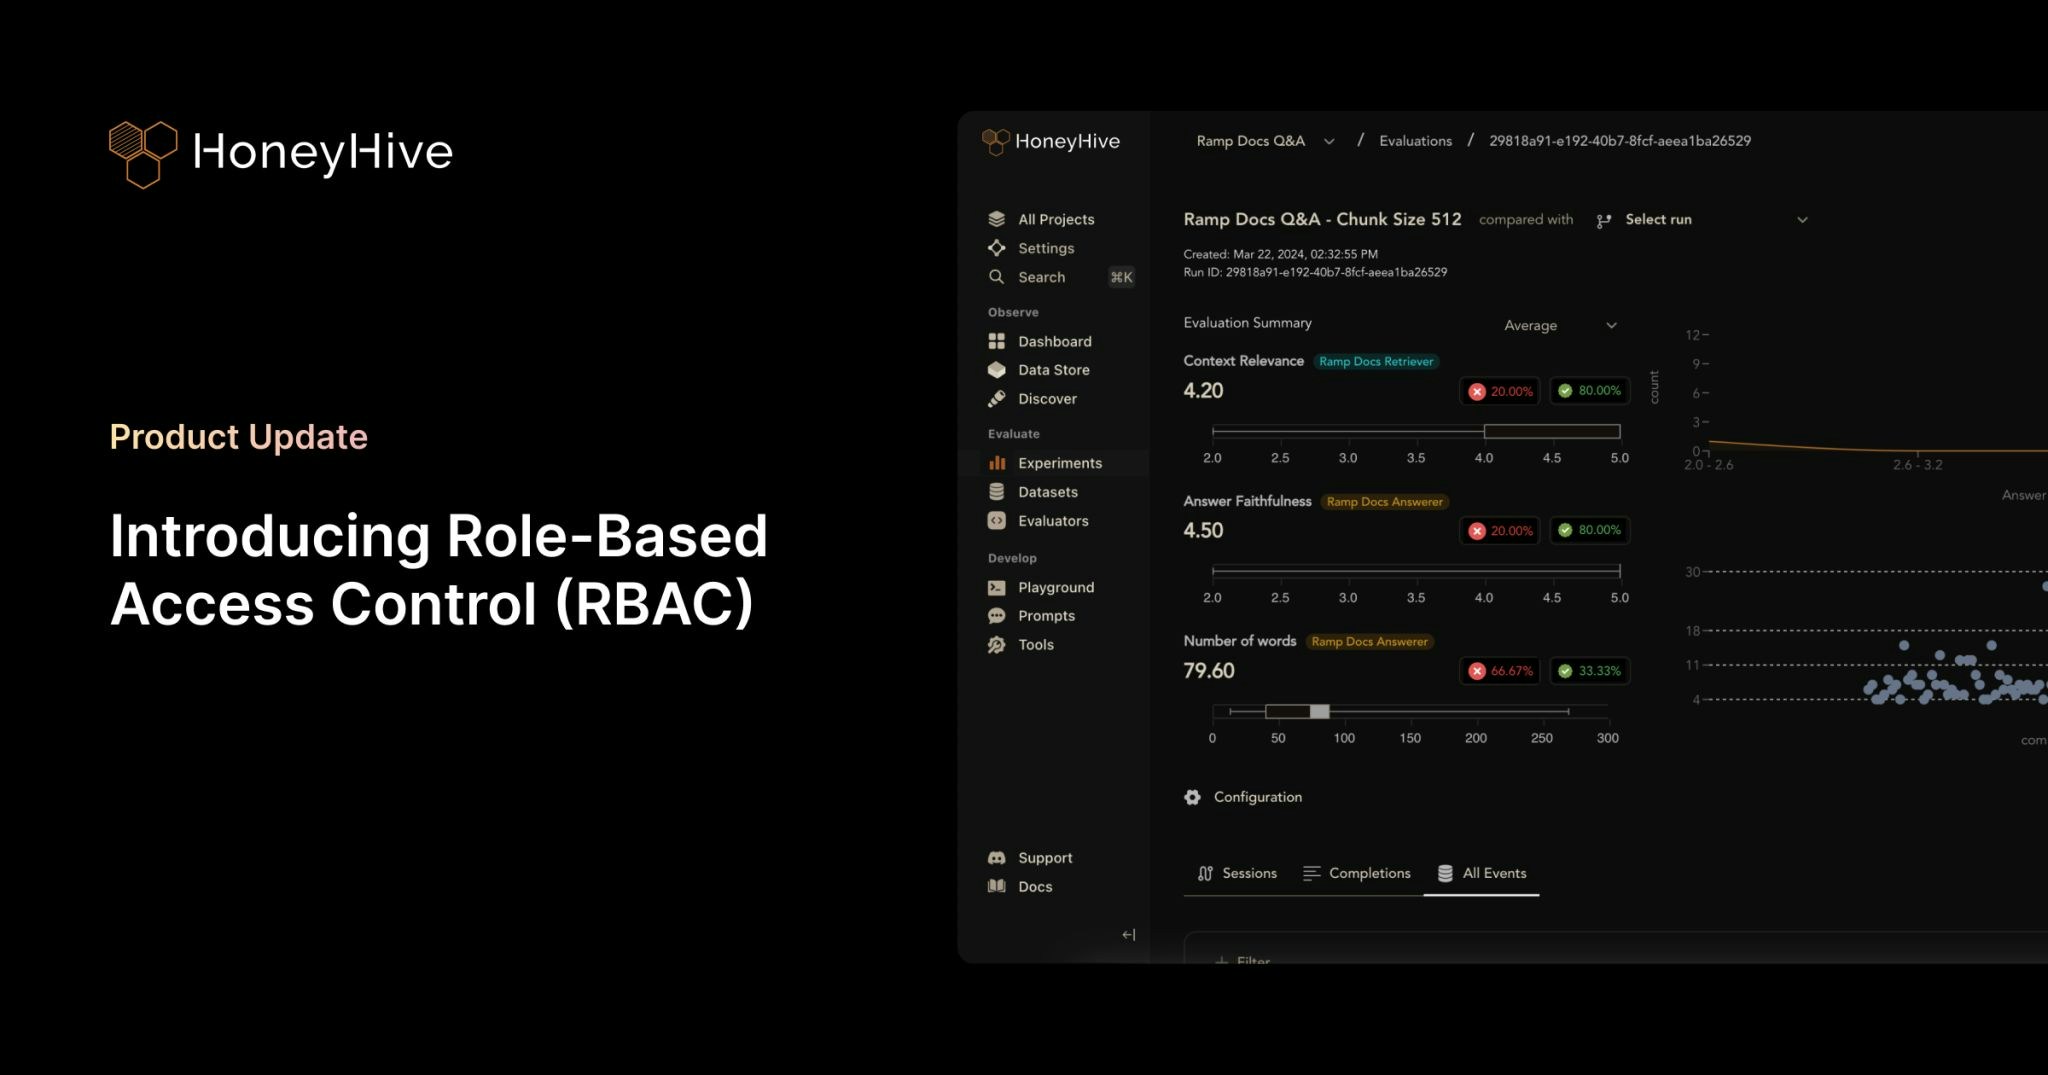 1. **Two-Tier Permission Structure:**
Granular permission management with organization and project-level controls. Organization Admins have full control across the entire organization, while Project Admins maintain complete control within specific projects. This creates clear boundaries between teams and prevents data leakage between business units.
2. **Enhanced API Key Security:**
Project-specific API key scoping ensures that teams can only access data within their designated projects. This provides better security isolation and compliance with industry regulations, especially critical for organizations in financial services, healthcare, and insurance.
3. **Flexible Team Management:**
Easy onboarding and role transitions with transparent permission hierarchy. Delegate administrative responsibilities without compromising security, and manage team member access as organizations evolve.
4. **Seamless Migration Process:**
Existing customers can migrate to RBAC with minimal disruption. All current users are automatically assigned Organization Admin roles, and project-specific API keys are available in Settings. Legacy API keys will remain functional until August 31st, 2025.
[Learn more about RBAC implementation](/v2/workspace/roles)
## Core Platform
* Added list of allowed characters for project names
## Python SDK (Logger)
### HoneyHive Logger (`honeyhive-logger`) released
* The logger sdk has
1. No external dependencies
2. A fully stateless design
* Optimized for
* Serverless environments
* Highly regulated environments with strict security requirements
## TypeScript SDK (Logger)
### HoneyHive Logger (`@honeyhive/logger`) released
* The logger sdk has
1. No external dependencies
2. A fully stateless design
* Optimized for
* Serverless environments
* Highly regulated environments with strict security requirements
## Python SDK - Version \[v0.2.49]
* Added type annotation to decorators and the evaluation harness
## Documentation
* Added documentation for Python/Typescript Loggers
* Updated gemini integration documentation to use latest sdk (Python and TypeScript)
## Core Platform
### Support for External Datasets in Experiments
You can now log experiments using external datasets with custom IDs for both datasets and datapoints. External dataset IDs will display with the "EXT-" prefix in the UI.
This feature provides greater flexibility for teams working with custom datasets while maintaining full integration with our experiment tracking.
```
{
"id": "", // Optional
"name": "", // Optional
"data": [
{
"id": "", // Optional
"inputs": { ... },
"ground_truths": { ... },
}
// Additional datapoints...
]
}
```
* Bug fixes and improvements across various areas to enhance performance and stability.
* Bug fixes for playground & evaluator version controls.
## Documentation
* Standardizes parameter names and clarified evaluation order in Experiments Quickstart and Python/TS SDK docs.
* Adds cookbook: [Inspirational Quotes Recommender with Qdrant and OpenAI](https://github.com/honeyhiveai/cookbook/tree/main/qdrant-discovery)
* Adds an "Evaluating External Logs" tutorial.
* Updates Python and TypeScript SDK's references and overall documentation to align with recent improvements and best practices.
* Adds [Datasets Introduction Guide](/v2/datasets/introduction).
* Adds [Server-side Evaluator Templates List](/v2/evaluators/evaluator-templates) documentation.
* Adds [LangGraph](/v2/integrations/langgraph) integration documentation.
## Core Platform
### Wide Mode
We've introduced a new **Wide Mode** option that allows users to hide the sidebar, providing:
* Expanded workspace area for a more immersive viewing experience
* Distraction-free environment when focusing on complex tasks
* Better content visibility on smaller screens and split-window setups
* Toggle controls accessible via the header menu for easy switching
1. **Two-Tier Permission Structure:**
Granular permission management with organization and project-level controls. Organization Admins have full control across the entire organization, while Project Admins maintain complete control within specific projects. This creates clear boundaries between teams and prevents data leakage between business units.
2. **Enhanced API Key Security:**
Project-specific API key scoping ensures that teams can only access data within their designated projects. This provides better security isolation and compliance with industry regulations, especially critical for organizations in financial services, healthcare, and insurance.
3. **Flexible Team Management:**
Easy onboarding and role transitions with transparent permission hierarchy. Delegate administrative responsibilities without compromising security, and manage team member access as organizations evolve.
4. **Seamless Migration Process:**
Existing customers can migrate to RBAC with minimal disruption. All current users are automatically assigned Organization Admin roles, and project-specific API keys are available in Settings. Legacy API keys will remain functional until August 31st, 2025.
[Learn more about RBAC implementation](/v2/workspace/roles)
## Core Platform
* Added list of allowed characters for project names
## Python SDK (Logger)
### HoneyHive Logger (`honeyhive-logger`) released
* The logger sdk has
1. No external dependencies
2. A fully stateless design
* Optimized for
* Serverless environments
* Highly regulated environments with strict security requirements
## TypeScript SDK (Logger)
### HoneyHive Logger (`@honeyhive/logger`) released
* The logger sdk has
1. No external dependencies
2. A fully stateless design
* Optimized for
* Serverless environments
* Highly regulated environments with strict security requirements
## Python SDK - Version \[v0.2.49]
* Added type annotation to decorators and the evaluation harness
## Documentation
* Added documentation for Python/Typescript Loggers
* Updated gemini integration documentation to use latest sdk (Python and TypeScript)
## Core Platform
### Support for External Datasets in Experiments
You can now log experiments using external datasets with custom IDs for both datasets and datapoints. External dataset IDs will display with the "EXT-" prefix in the UI.
This feature provides greater flexibility for teams working with custom datasets while maintaining full integration with our experiment tracking.
```
{
"id": "", // Optional
"name": "", // Optional
"data": [
{
"id": "", // Optional
"inputs": { ... },
"ground_truths": { ... },
}
// Additional datapoints...
]
}
```
* Bug fixes and improvements across various areas to enhance performance and stability.
* Bug fixes for playground & evaluator version controls.
## Documentation
* Standardizes parameter names and clarified evaluation order in Experiments Quickstart and Python/TS SDK docs.
* Adds cookbook: [Inspirational Quotes Recommender with Qdrant and OpenAI](https://github.com/honeyhiveai/cookbook/tree/main/qdrant-discovery)
* Adds an "Evaluating External Logs" tutorial.
* Updates Python and TypeScript SDK's references and overall documentation to align with recent improvements and best practices.
* Adds [Datasets Introduction Guide](/v2/datasets/introduction).
* Adds [Server-side Evaluator Templates List](/v2/evaluators/evaluator-templates) documentation.
* Adds [LangGraph](/v2/integrations/langgraph) integration documentation.
## Core Platform
### Wide Mode
We've introduced a new **Wide Mode** option that allows users to hide the sidebar, providing:
* Expanded workspace area for a more immersive viewing experience
* Distraction-free environment when focusing on complex tasks
* Better content visibility on smaller screens and split-window setups
* Toggle controls accessible via the header menu for easy switching
### Improved Experiments Layout
Our redesigned comparison interface improves result analysis with:
* Structured input visualization with collapsible sections
* Clear side-by-side metrics display for easier model comparison
* Improved performance statistics with visual rating indicators
### Introducing Review Mode
A new way for domain experts to annotate traces with human feedback.
With **Review Mode**, you can:
* Tag traces with annotations from your Human Evaluators definitions
* Apply your custom criteria right in the UI
* Add comments when something interesting pops up
This should make life easier when you're combing through traces and need to mark things for later. Perfect for when the whole team needs to analyze outputs together.
Check it out in `Experiments` and `Log Store` - look for the "Review Mode" button.
Other updates:
* Enhanced filter functionality: Added the ability to edit filters and improved schema discovery within filters.
* Fixed pagination issue for events table.
* Bug fixes and stability improvements for filtering functionality.
* Added support for `exists` and `not exists` operators in filters.
* Frontend styling improvements to enhance the user interface.
* Bug fixes and stability enhancements for a smoother user experience.
## Python SDK - Version \[v0.2.44]
* Improved error tracking for the tracer: Enhanced the capture of error messages for custom-decorated functions.
* Git context enrichment: Added support for capturing Git branch status in traces and experiments.
* Introduced the `disable_http_tracing` parameter during tracer initialization to disable HTTP event tracing.
* Fixed the `traceloop` version to 0.30.0 to resolve protobuf dependency conflicts.
## Python SDK - Version \[v0.2.36]
* Reduced package size for AWS lambda usage
* Removed Langchain dependency. For using Langchain callbacks, install Langchain separately
* Add lambda, core, and eval poetry installation groups
## TypeScript SDK - Version \[v1.0.33]
* Improved error tracking for the tracer: Enhanced the capture of error messages for traced functions.
* Git context enrichment: Added support for capturing Git branch status in traces and experiments.
* Introduced the `disableHttpTracing` parameter during tracer initialization to disable HTTP event tracing.
## TypeScript SDK - Version \[v1.0.23]
* Reduced package size for AWS lambda usage
* Disabled CommonJS autotracing 3rd party packages: Anthropic, Bedrock, Pinecone, ChromaDB, Cohere, Langchain, LlamaIndex, OpenAI. Please use [custom tracing](/v2/tracing/custom-spans) for instrumenting Typescript.
* Refactor custom tracer for better initialization syntax and using typescript
## Documentation
* Improved documentation for async function handling.
* Added integration documentation for model providers:
* [Openai](/v2/integrations/openai).
* [Azure OpenAI](/v2/integrations/azure_openai).
* [AWS Bedrock](/v2/integrations/aws_bedrock).
* Added a tutorial for running experiments with multi-step LLM applications with MongoDB and OpenAI.
* Adds [Streamlit Cookbook](https://github.com/honeyhiveai/cookbook/tree/main/streamlit-cookbook) for tracing model calls with collected user feedback on AI response.
* Standardized all JavaScript/TypeScript code examples to TypeScript across the documentation.
* Added troubleshooting guidance for SSL validation failures.
* Documented the `disable_http_tracing/disableHttpTracing` parameter in the SDK Reference.
* Removed references to `init_from_session_id` in favor of using `init` with the `session_id` parameter.
* Updated the observability tutorial/cookbook to use `enrichSession` instead of `setFeedback/setMetadata`
* Integrations - added [CrewAI Integration](/v2/integrations/crewai) documentation.
* Added schema documentation (now part of [Enrichment Schema](/v2/tracing/enrichment-schema)) to describe our schemas in detail including a list of reserved properties.
* Added [Client-side Evaluators](/v2/evaluators/client_side) documentation to describe the use of client-side evaluators for both tracing and experiments
* Updated [Custom Spans](/v2/tracing/custom-spans) documentation to add reference to tracing methods `traceModel`/`traceTool`/`traceChain` (TypeScript)
* Integrations - added LanceDB Integration documentation
* Integrations - added Zilliz Integration documentation