> ## Documentation Index
> Fetch the complete documentation index at: https://docs.honeyhive.ai/llms.txt
> Use this file to discover all available pages before exploring further.
# HoneyHive Platform Concepts
> Learn core HoneyHive concepts: projects, sessions, events, datasets, experiments, evaluators, and prompts. See how they connect observability and evaluation.
HoneyHive helps you observe, evaluate, and iterate on AI applications. HoneyHive's abstractions have been designed for maximal extensibility & reusability. All concepts are minimally opinionated.
***
## Project
Everything in HoneyHive is organized by projects. A project is a logically-separated workspace to develop, evaluate, and monitor a specific AI agent or an end-to-end application leveraging one or multiple agents.
***
## Observability
### Session
A `session` is a collection of events that represent a single user interaction with your application. Sessions can trace a single agent execution or an end-to-end user conversation with multiple turns, depending on your configuration.
### Event
An `event` tracks the execution of a specific operation in your application, along with inputs, outputs, metadata, and feedback. This is synonymous with a single span in a trace.
Events have three types:
| Type | Use Case |
| ------- | -------------------------------------------- |
| `model` | LLM API calls (OpenAI, Anthropic, etc.) |
| `tool` | External calls (vector DBs, APIs, functions) |
| `chain` | Logical groupings of multiple events |
Events can be enriched with **metrics** (numeric scores like latency, cost, or custom evaluations), **feedback** (user ratings or corrections), **metadata** (custom key-value pairs), and **user properties** (user ID, tier, etc.).
Full details on the wide-event data model can be found in [Tracing Introduction](/v2/tracing/introduction).
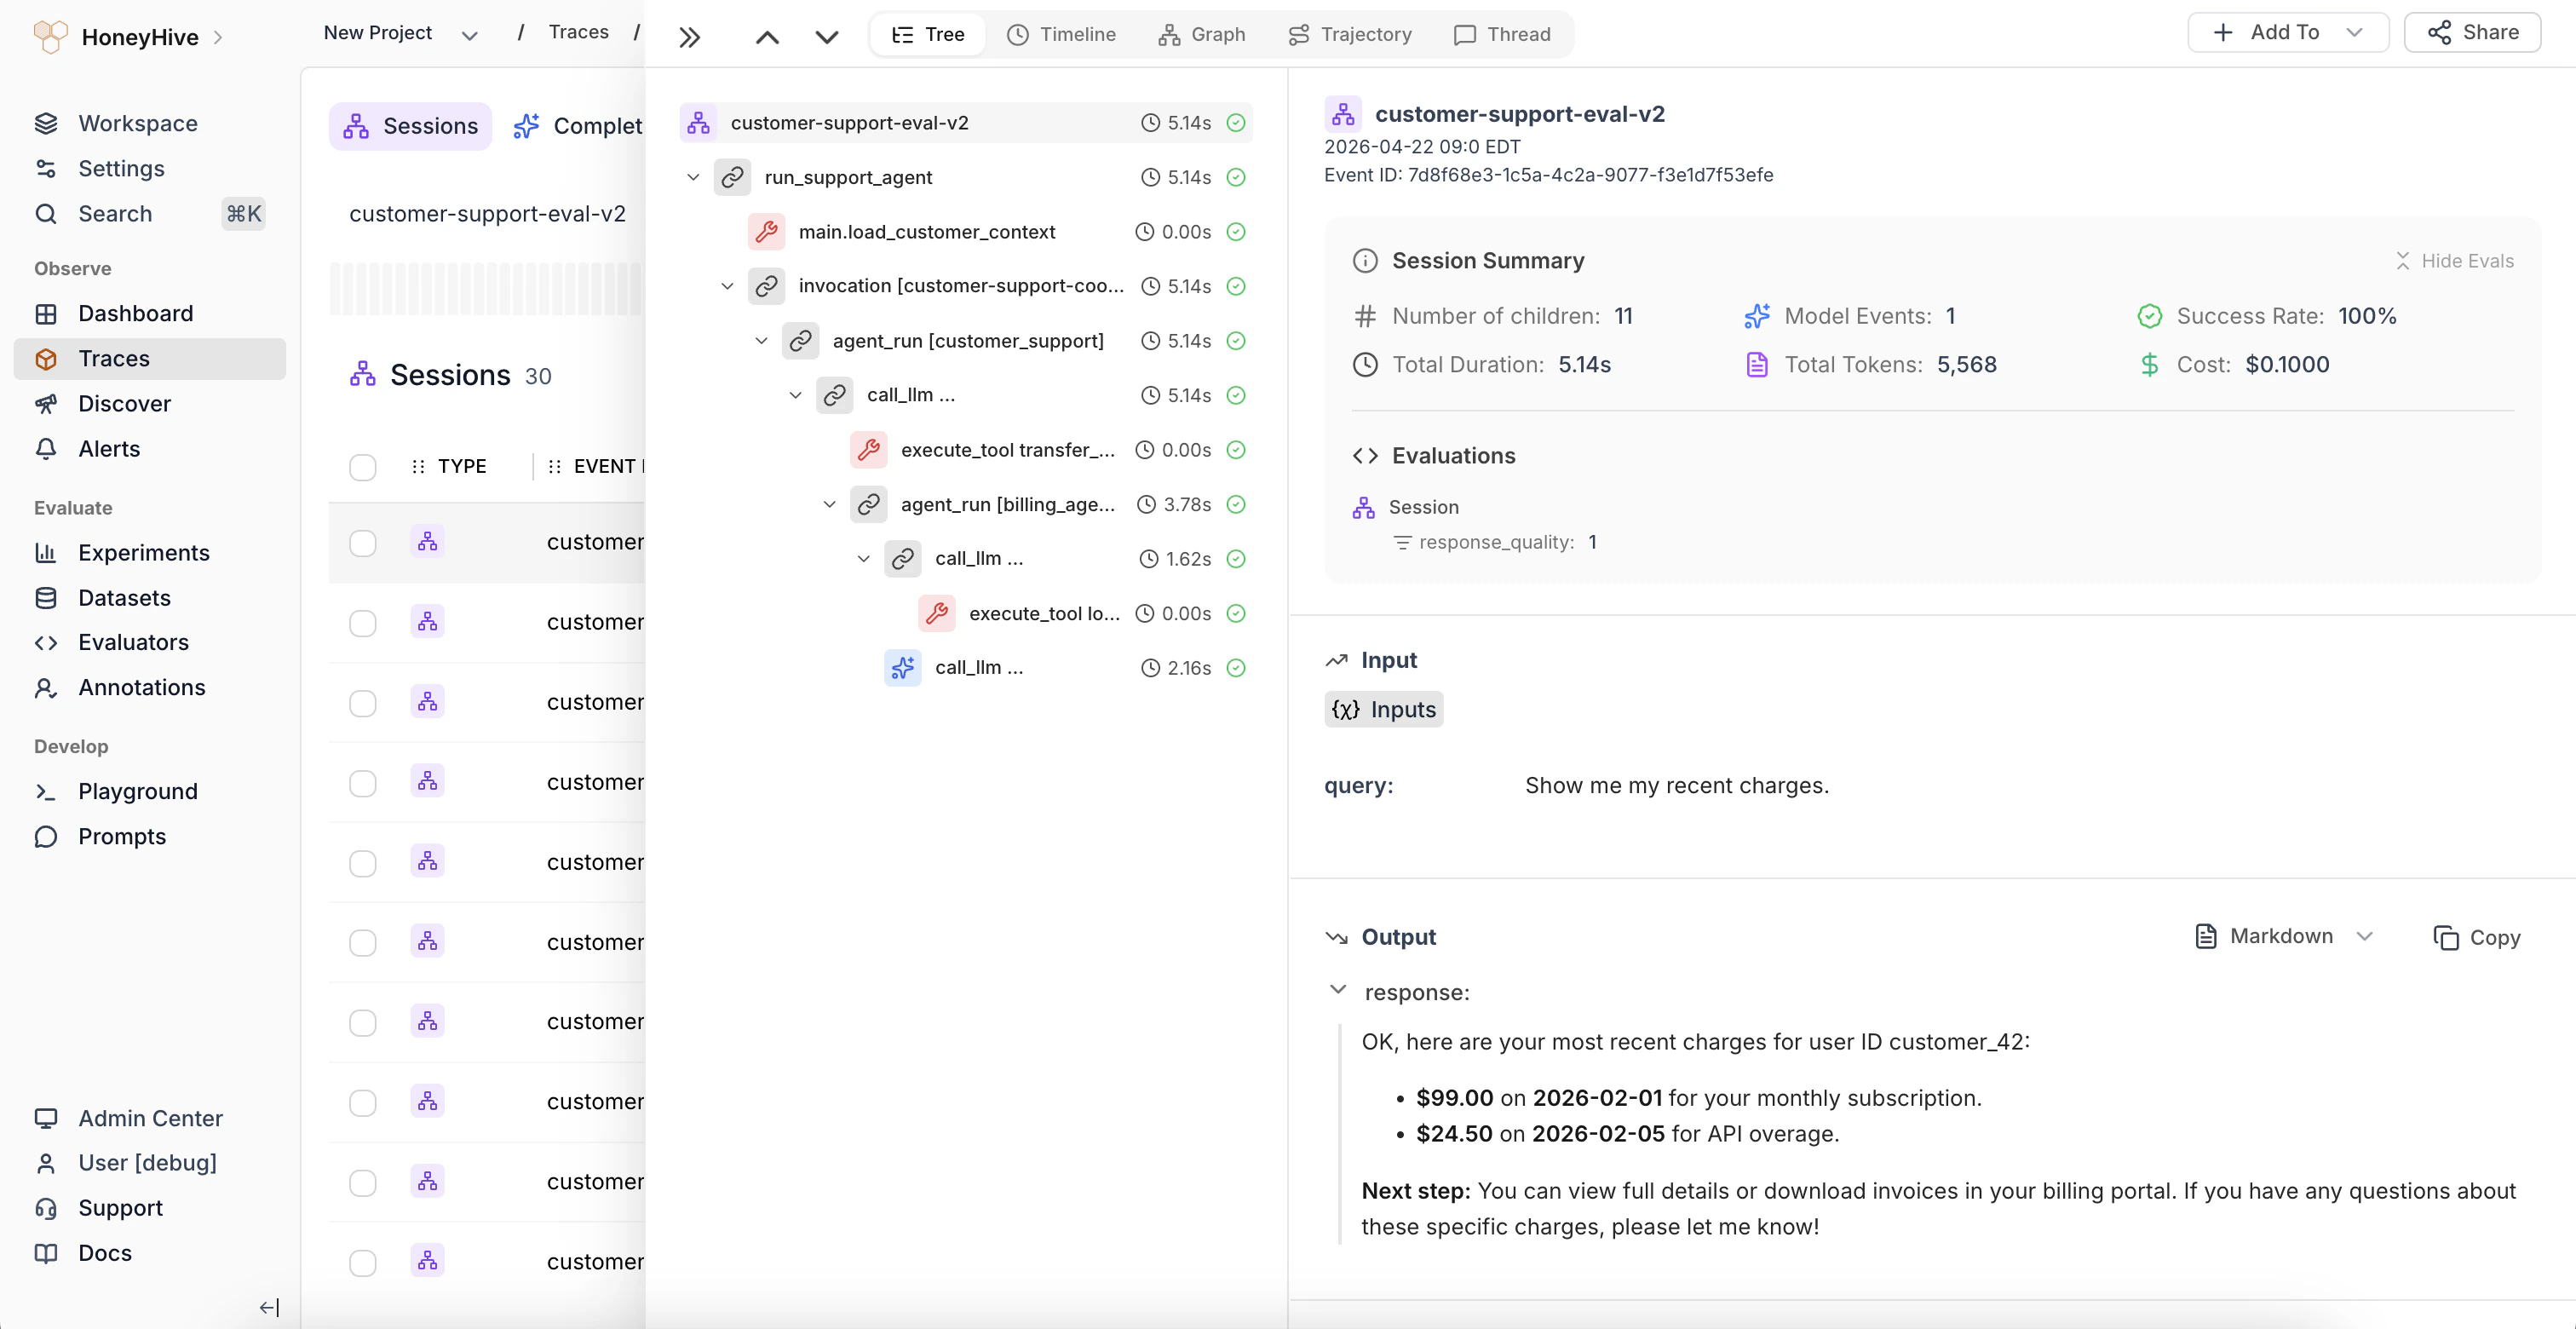 Data model, OpenTelemetry architecture, and context propagation.
***
## Evaluation
### Datapoint
A datapoint is an input-output pair (with optional ground truth and metadata) that represents a single test case. Datapoints can be created manually or saved directly from production traces.
Data model, OpenTelemetry architecture, and context propagation.
***
## Evaluation
### Datapoint
A datapoint is an input-output pair (with optional ground truth and metadata) that represents a single test case. Datapoints can be created manually or saved directly from production traces.
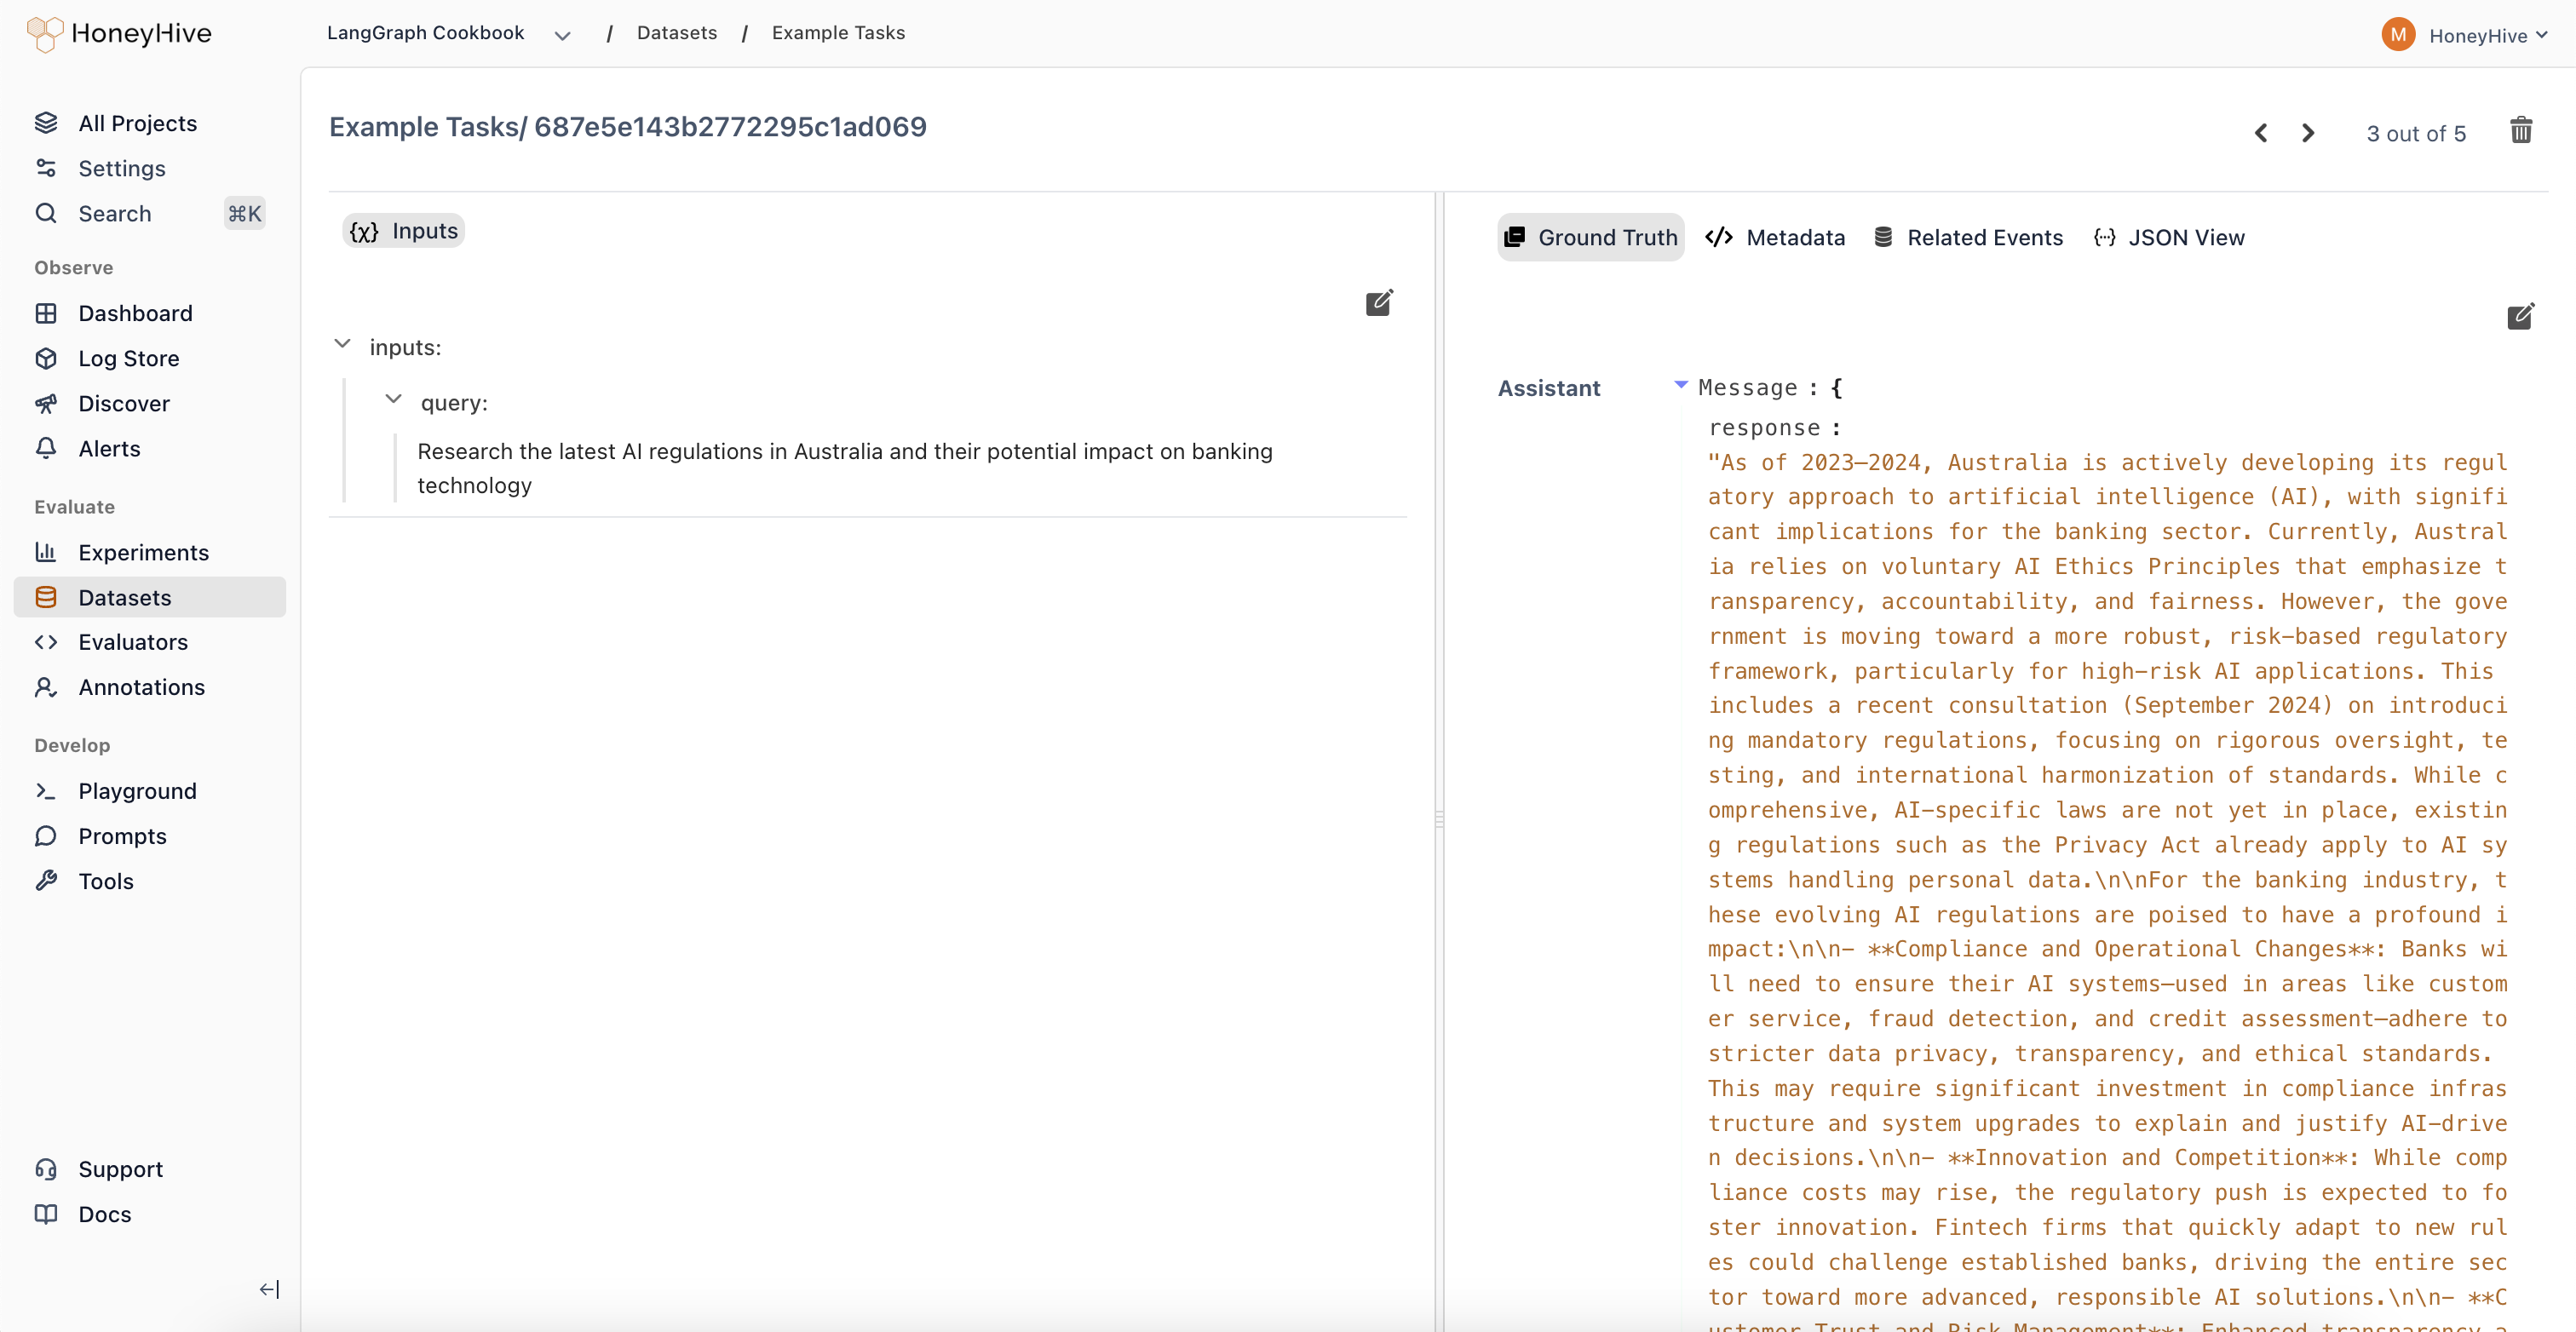 Each datapoint has a unique `datapoint_id` used to track it across experiments and comparisons. Datapoints link back to the events that generated them.
### Dataset
A dataset is a collection of datapoints used to run evaluations, compare model versions, or fine-tune custom models.
Datasets can be exported and used programmatically in your CI pipelines. Learn more in [Datasets](/v2/datasets/introduction).
### Experiment Run
An experiment run executes your application against a dataset and scores the outputs with evaluators. Experiments track metrics across all datapoints, enabling you to compare different versions of your application.
Each datapoint has a unique `datapoint_id` used to track it across experiments and comparisons. Datapoints link back to the events that generated them.
### Dataset
A dataset is a collection of datapoints used to run evaluations, compare model versions, or fine-tune custom models.
Datasets can be exported and used programmatically in your CI pipelines. Learn more in [Datasets](/v2/datasets/introduction).
### Experiment Run
An experiment run executes your application against a dataset and scores the outputs with evaluators. Experiments track metrics across all datapoints, enabling you to compare different versions of your application.
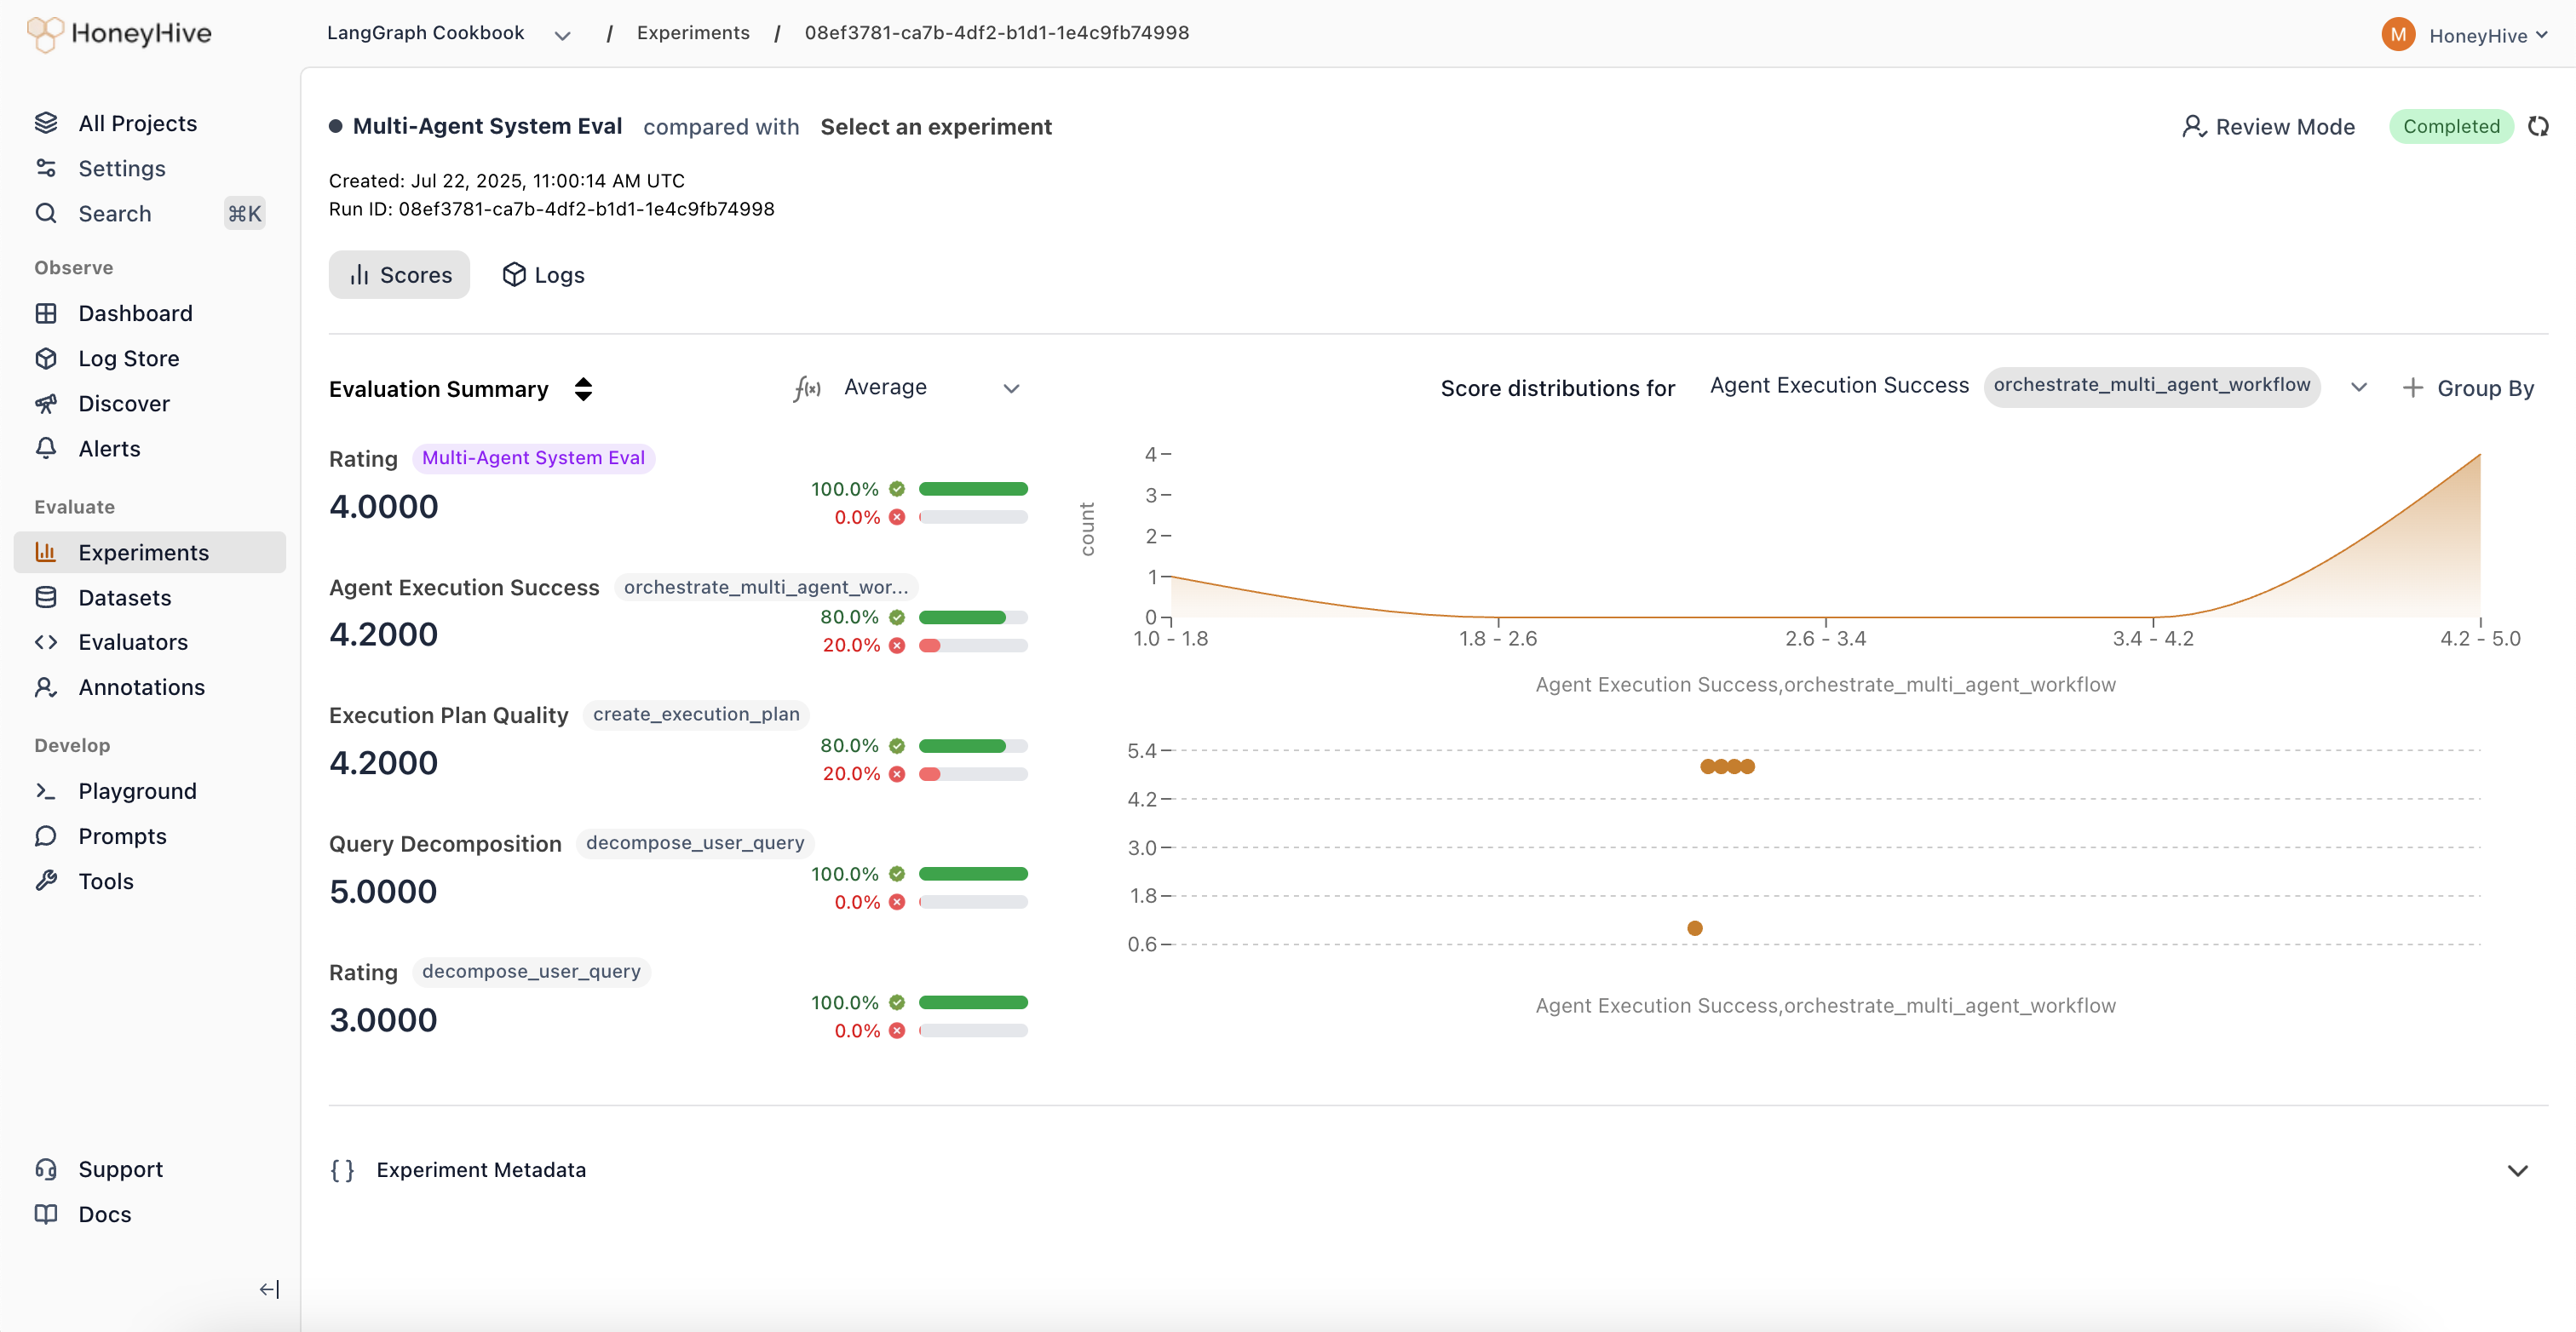 You can apply aggregation functions, filter results, and drill into individual traces:
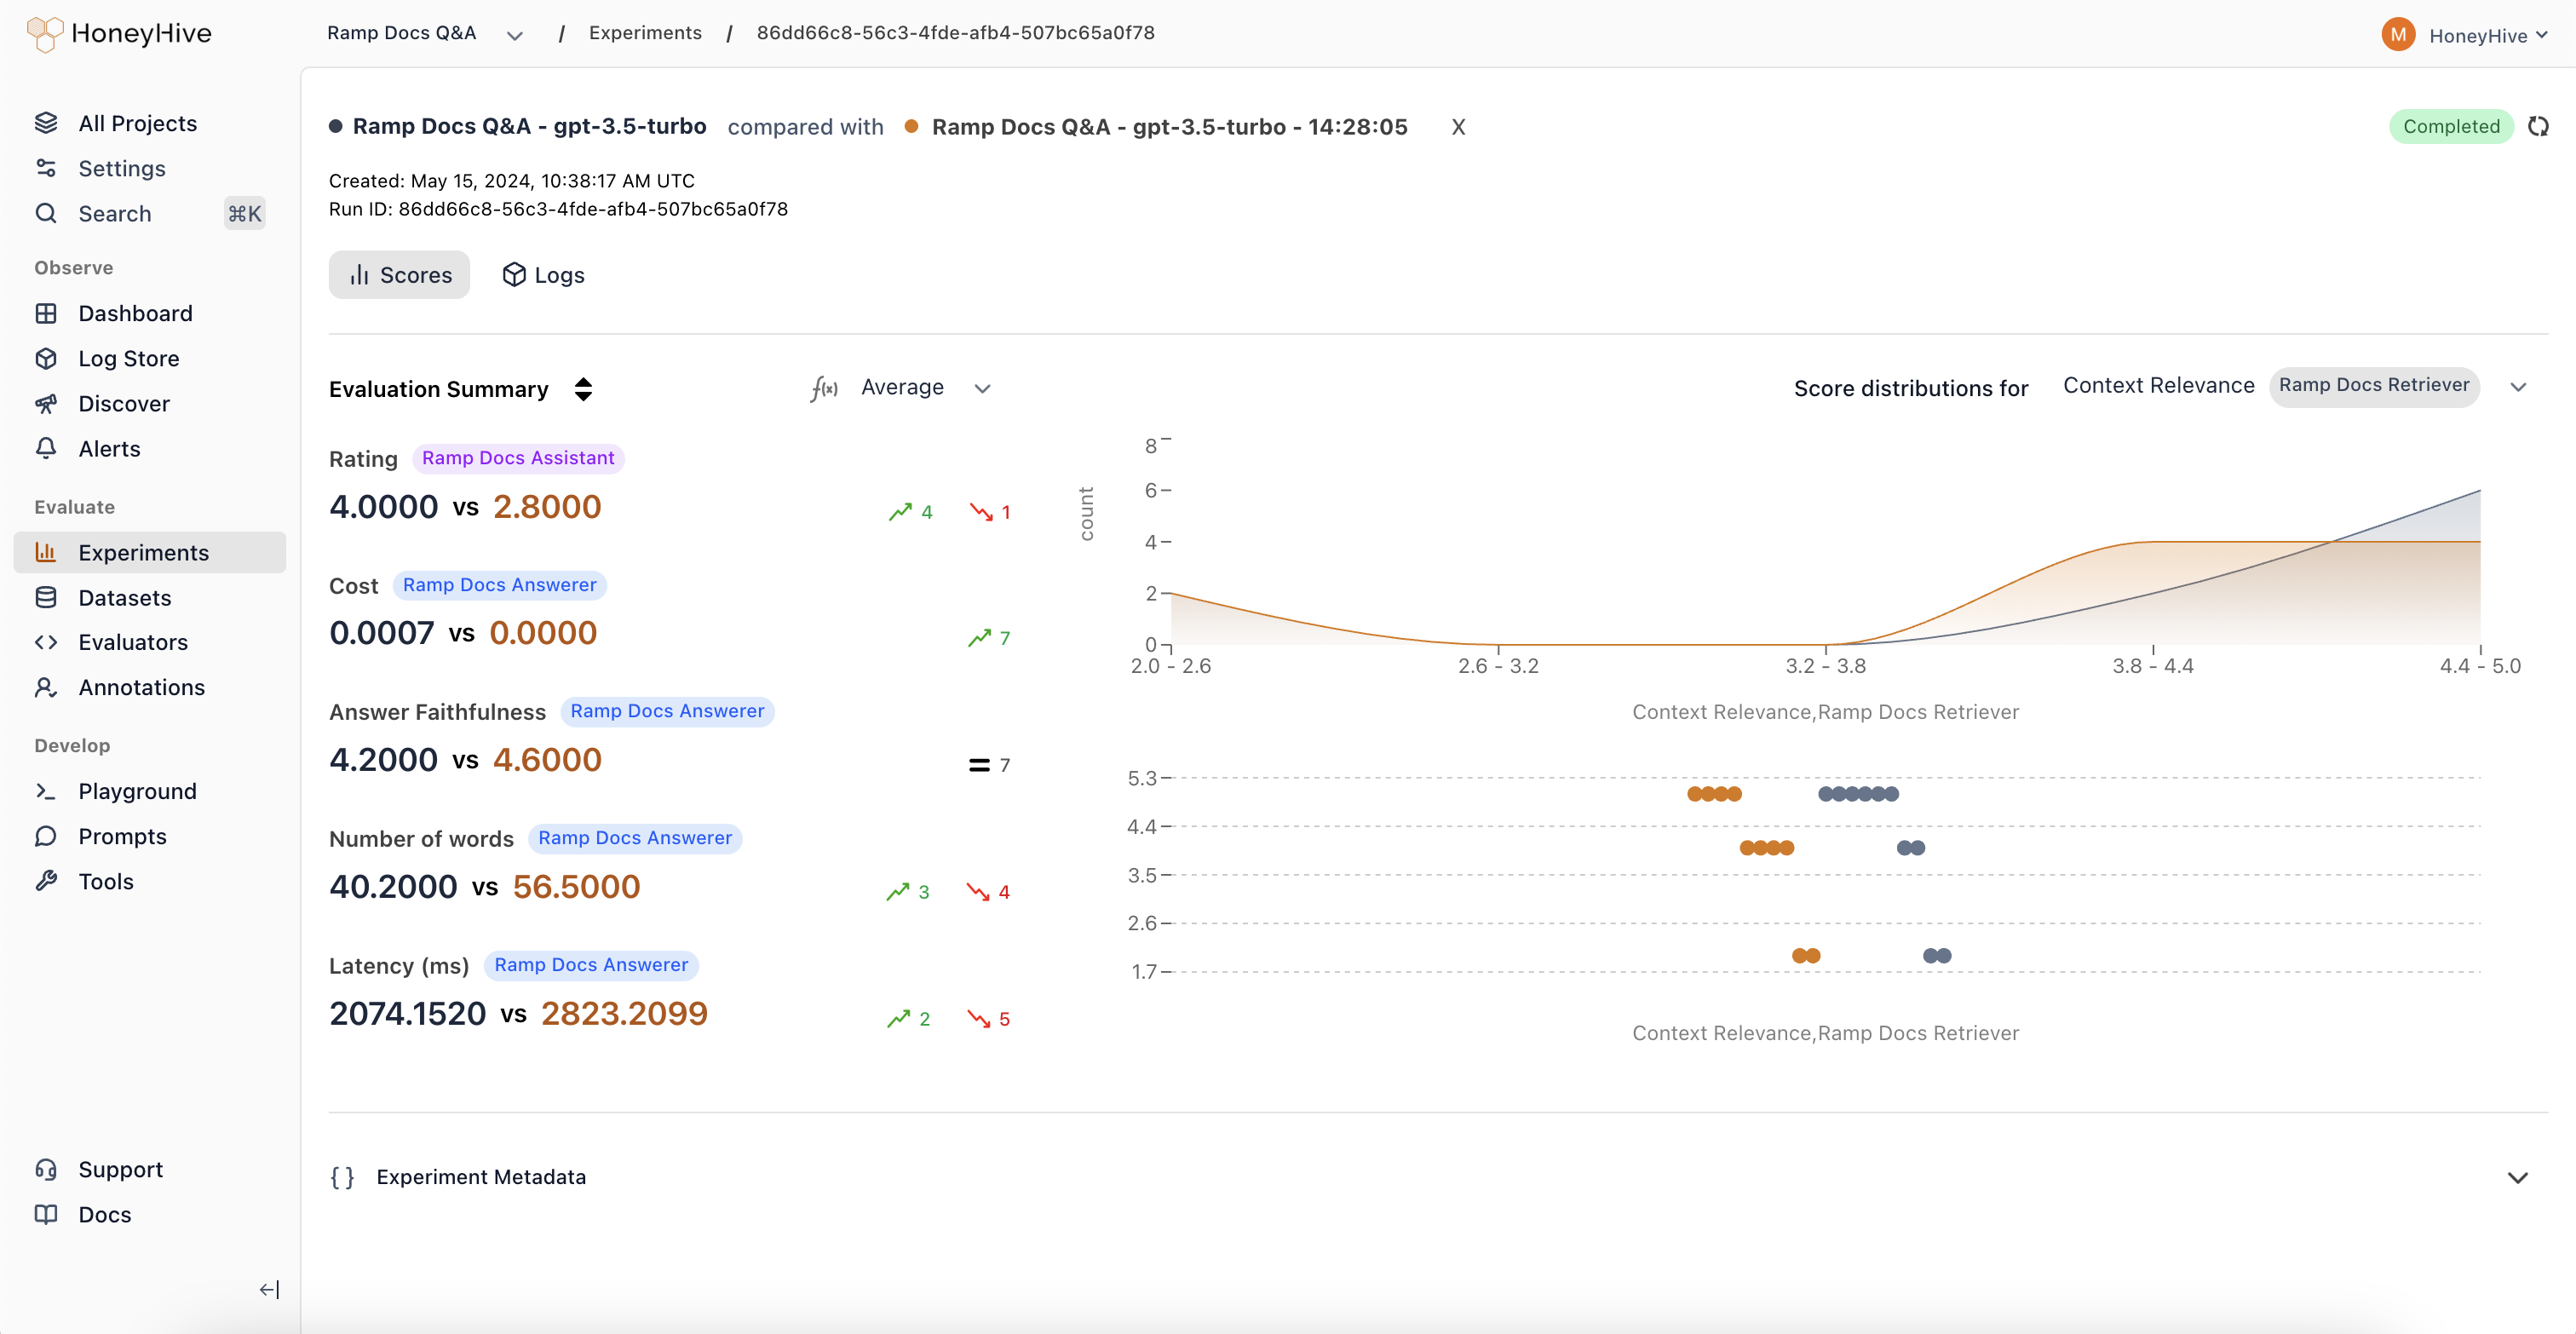 Two experiment runs can be compared when their sessions share a common `datapoint_id` in metadata.
### Evaluator
An evaluator is a function that scores your application's outputs. Evaluators can be:
* **Python functions** - Custom logic you define
* **LLM-as-judge** - Use an LLM to assess quality
* **Human evaluation** - Route to annotation queues
Two experiment runs can be compared when their sessions share a common `datapoint_id` in metadata.
### Evaluator
An evaluator is a function that scores your application's outputs. Evaluators can be:
* **Python functions** - Custom logic you define
* **LLM-as-judge** - Use an LLM to assess quality
* **Human evaluation** - Route to annotation queues
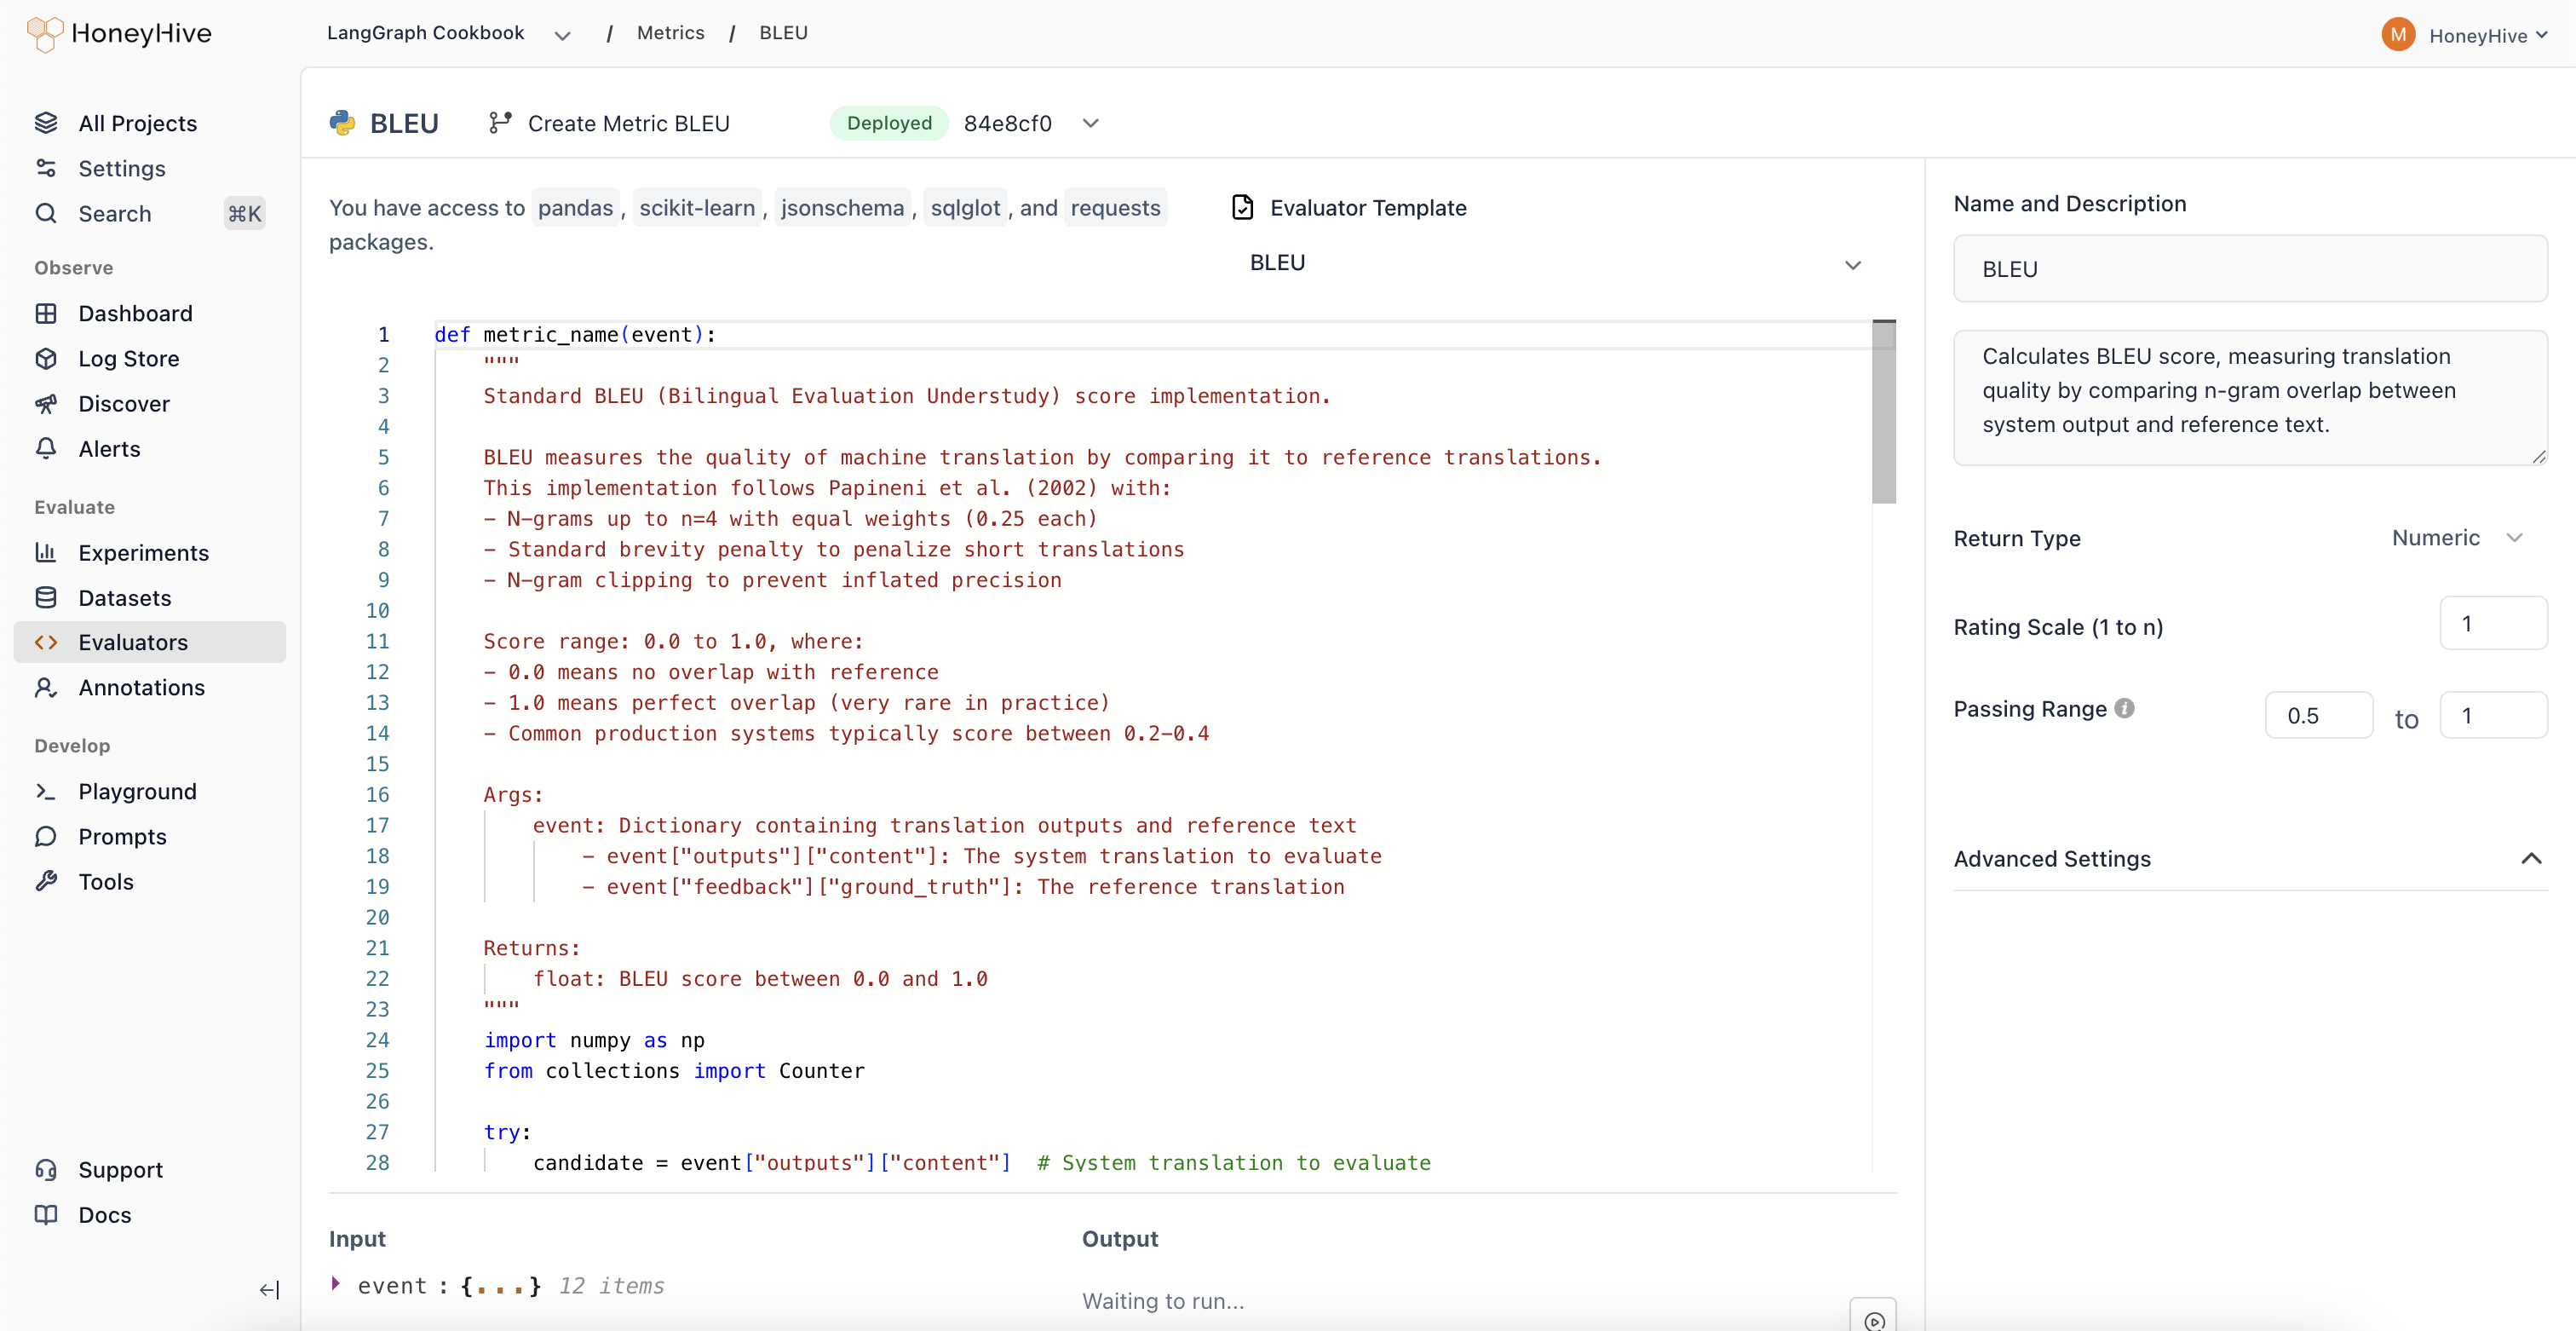 Evaluators run client-side (in your environment) or server-side (on HoneyHive's infrastructure). Learn more in [Evaluators](/v2/evaluators/introduction).
Understand the evaluation philosophy and how datasets, experiments, and evaluators work together.
***
## Prompt
A prompt is a versioned configuration for an LLM call. It includes the model name, provider, prompt template, and hyperparameters (temperature, tools, etc.).
Evaluators run client-side (in your environment) or server-side (on HoneyHive's infrastructure). Learn more in [Evaluators](/v2/evaluators/introduction).
Understand the evaluation philosophy and how datasets, experiments, and evaluators work together.
***
## Prompt
A prompt is a versioned configuration for an LLM call. It includes the model name, provider, prompt template, and hyperparameters (temperature, tools, etc.).
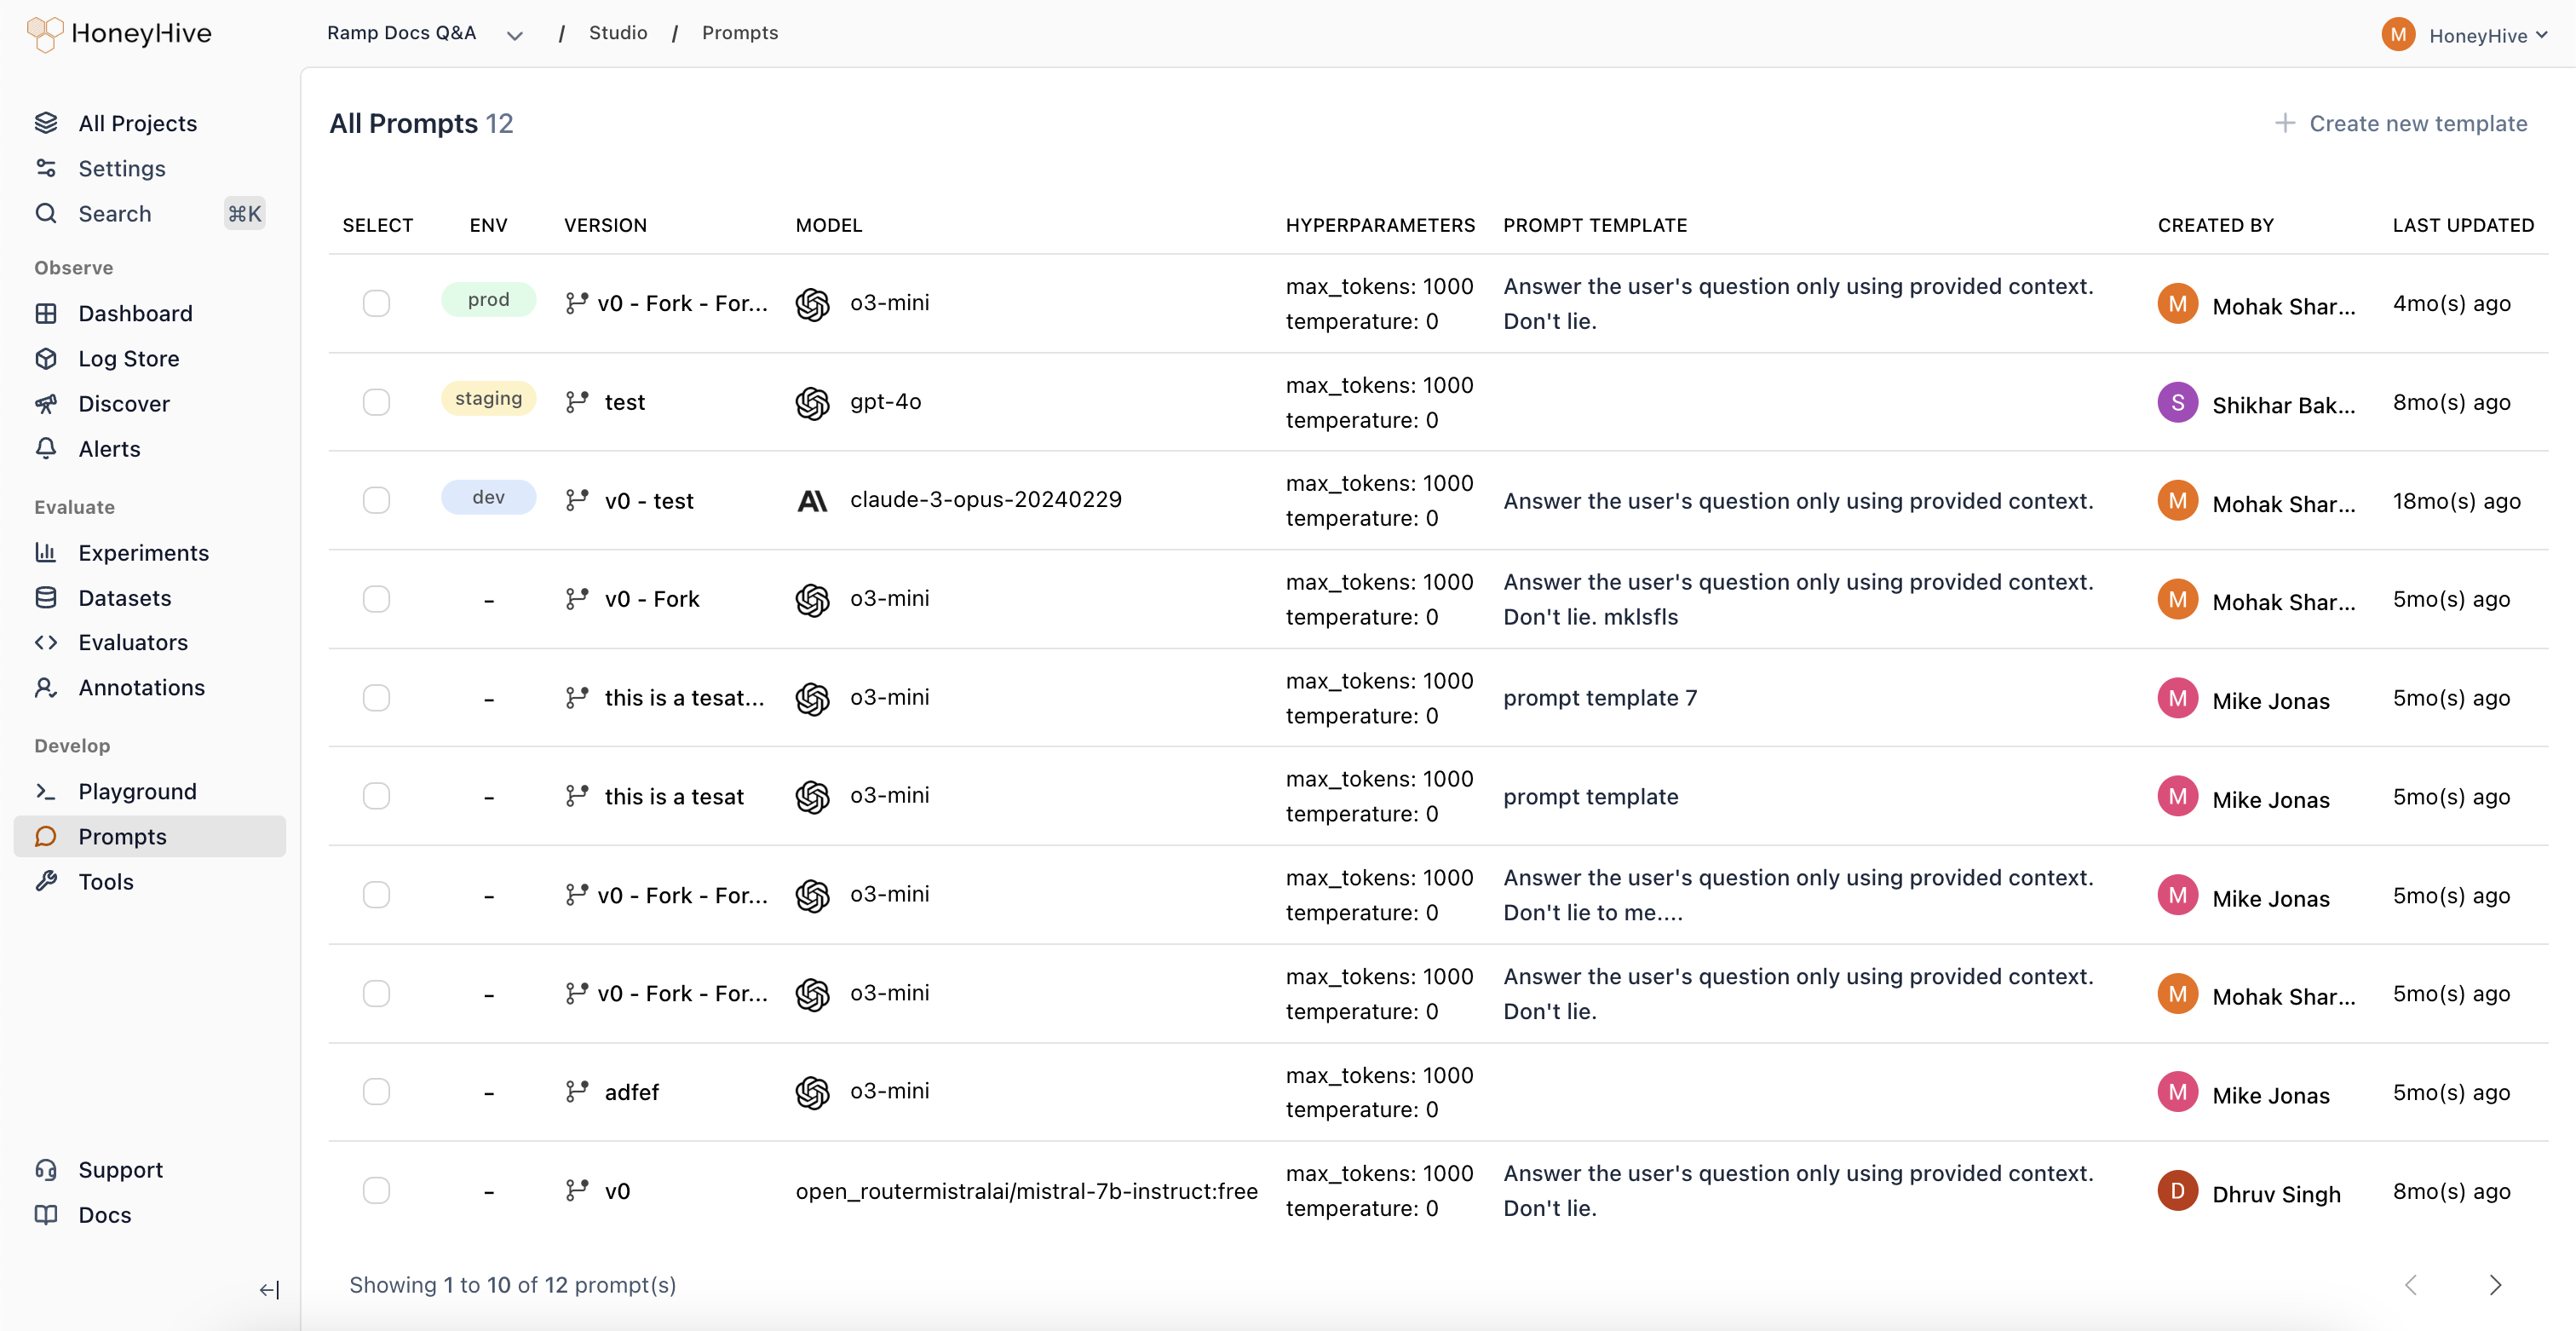 The Playground lets you iterate on prompts and "vibe-check" models. Domain experts can independently improve prompts based on evaluation results, then deploy changes without engineering involvement. Learn more in [Prompts](/v2/prompts/overview).
***
## Deep Dives
Wide-event data model, OpenTelemetry, BYOI architecture, and multi-instance tracing.
Reference for enrichment namespaces and data types.
The Playground lets you iterate on prompts and "vibe-check" models. Domain experts can independently improve prompts based on evaluation results, then deploy changes without engineering involvement. Learn more in [Prompts](/v2/prompts/overview).
***
## Deep Dives
Wide-event data model, OpenTelemetry, BYOI architecture, and multi-instance tracing.
Reference for enrichment namespaces and data types.