> ## Documentation Index
> Fetch the complete documentation index at: https://docs.honeyhive.ai/llms.txt
> Use this file to discover all available pages before exploring further.
# Comparing Experiments
> Compare HoneyHive experiment runs side by side to spot prompt regressions, model improvements, and metric deltas across versions before you ship changes.
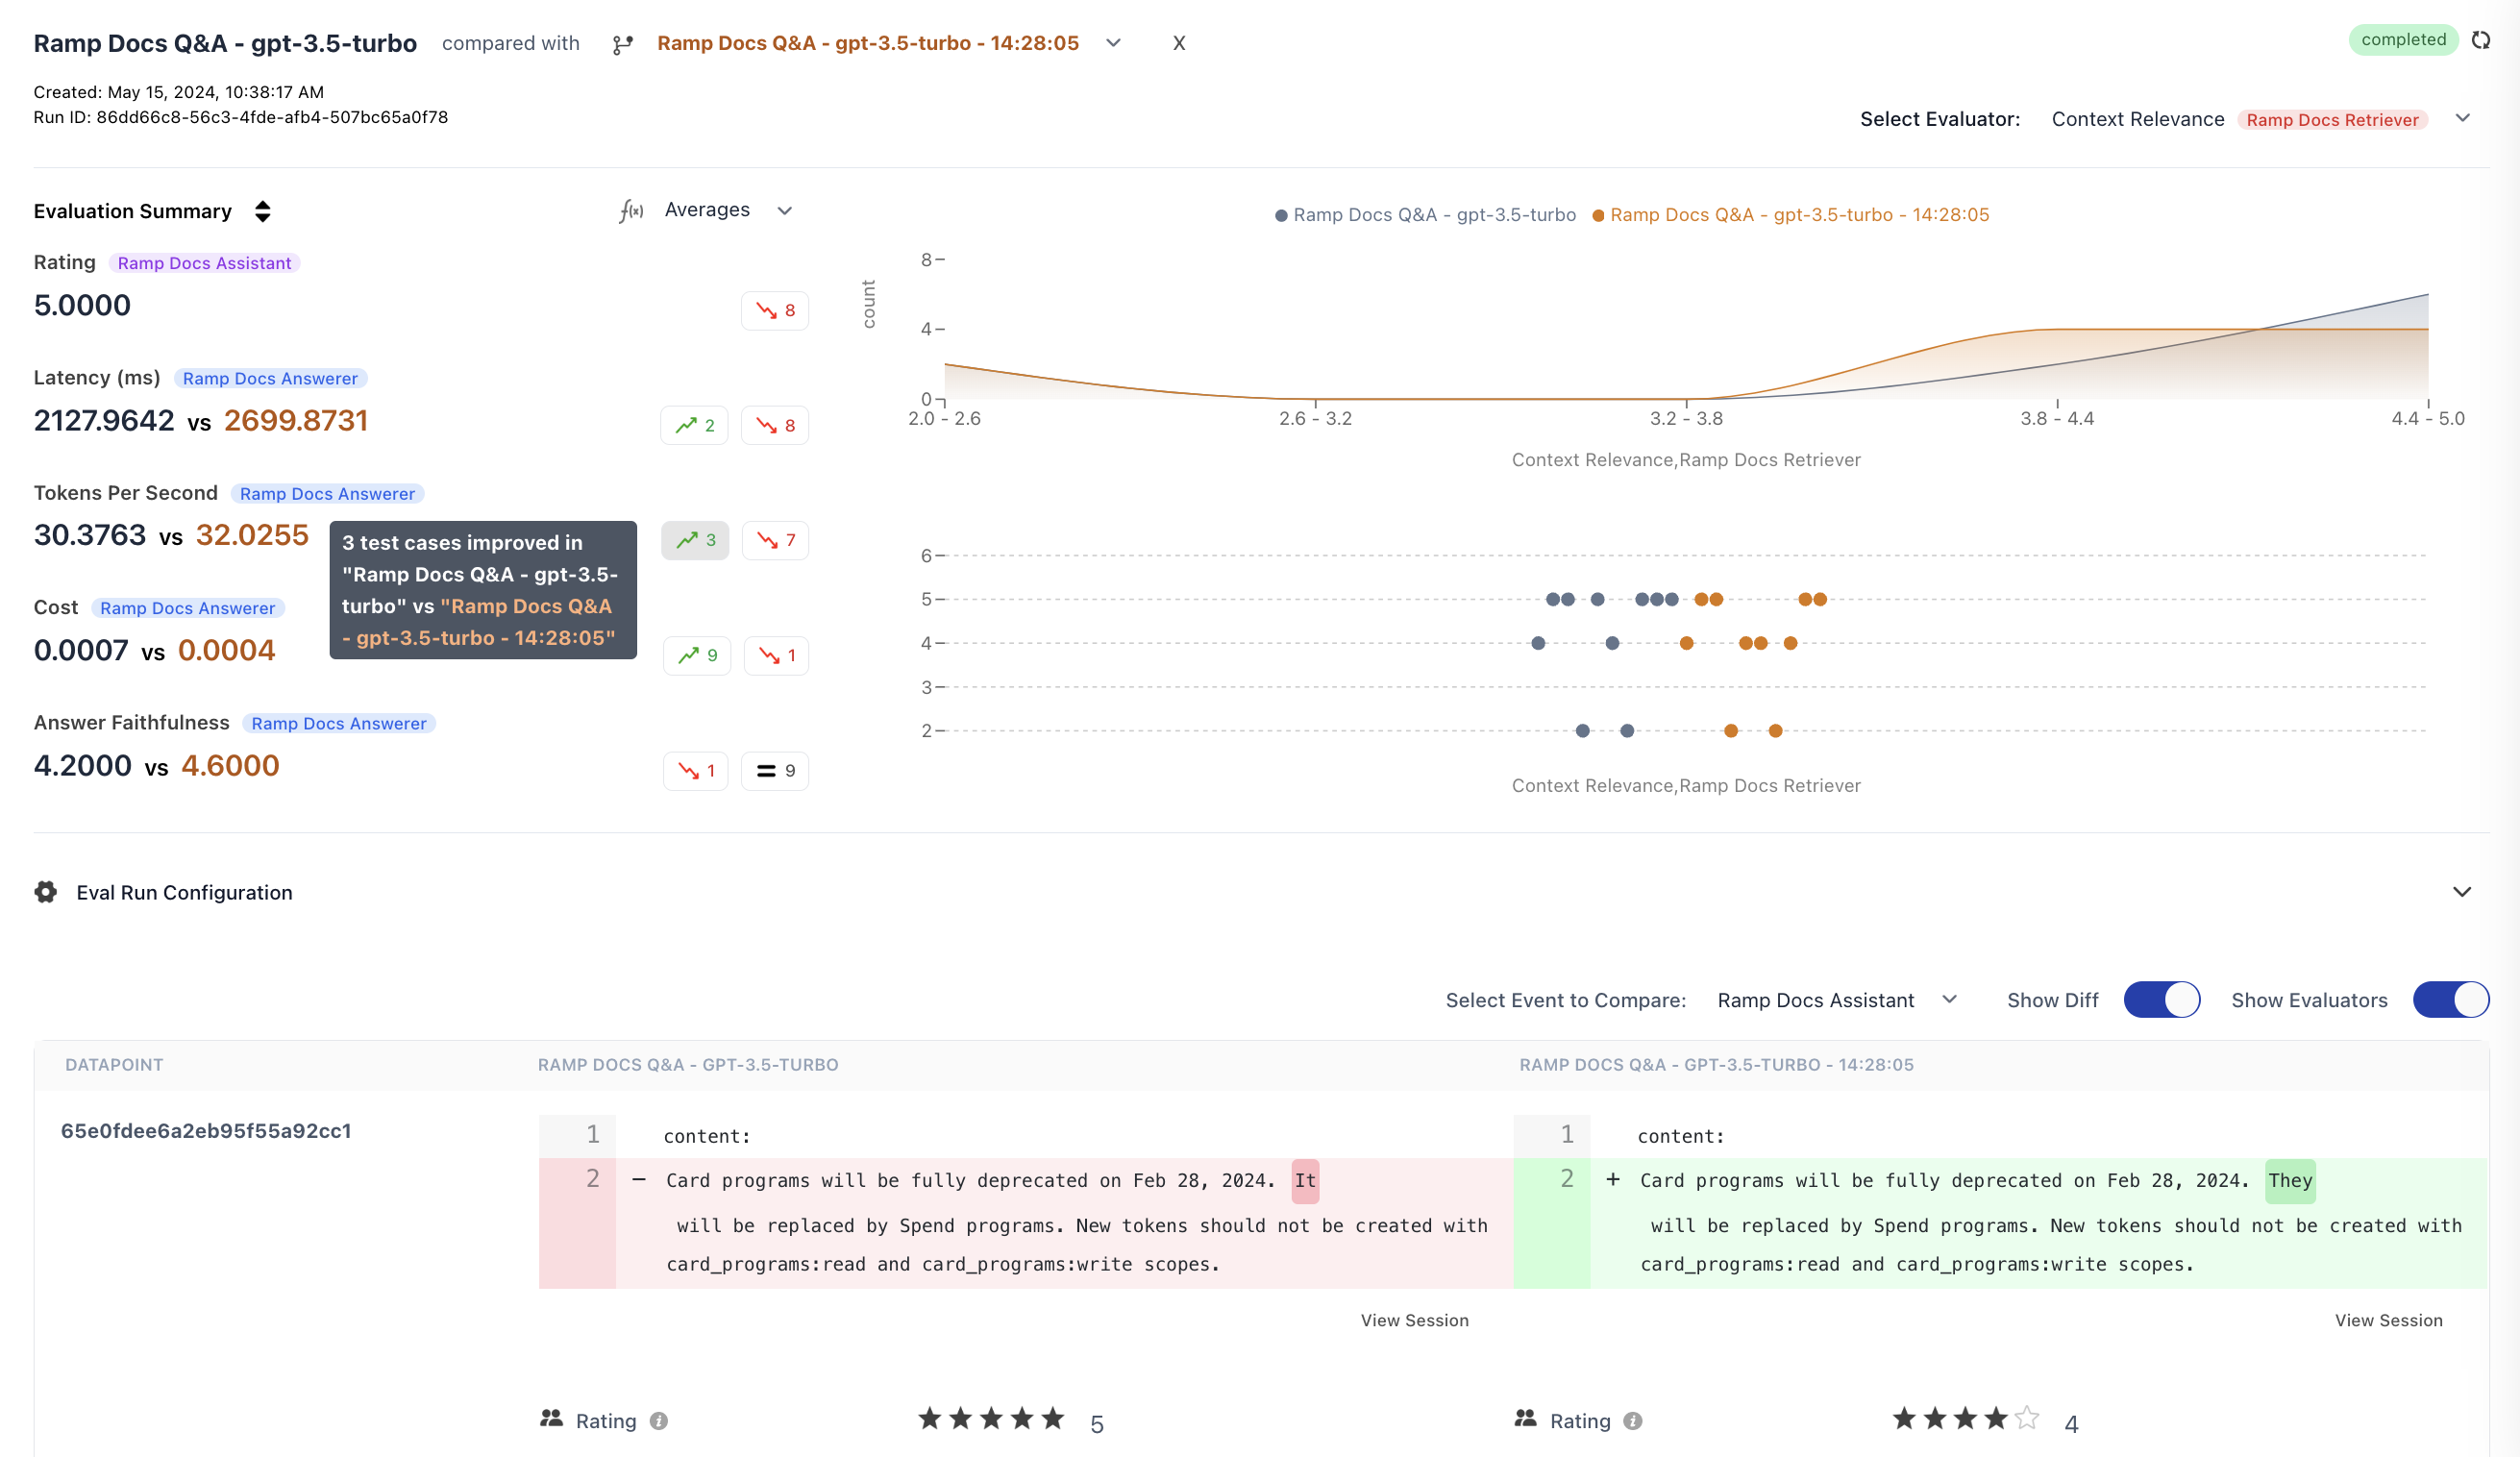
After running multiple experiments, you can compare their results side-by-side to understand what changed and why. This is essential when iterating on prompts, testing different models, or tuning parameters.
 ## How to Compare Runs
1. Go to **Experiments** in the sidebar
2. Select an experiment run to view its details
3. Click **compared with** and select another run from the dropdown
4. The view updates to show side-by-side comparison
Runs are comparable when they share common datapoints (matched by `datapoint_id`). For best results, run experiments against the same [HoneyHive dataset](/v2/datasets/run-experiments).
## Comparison Features
### Aggregated Metrics
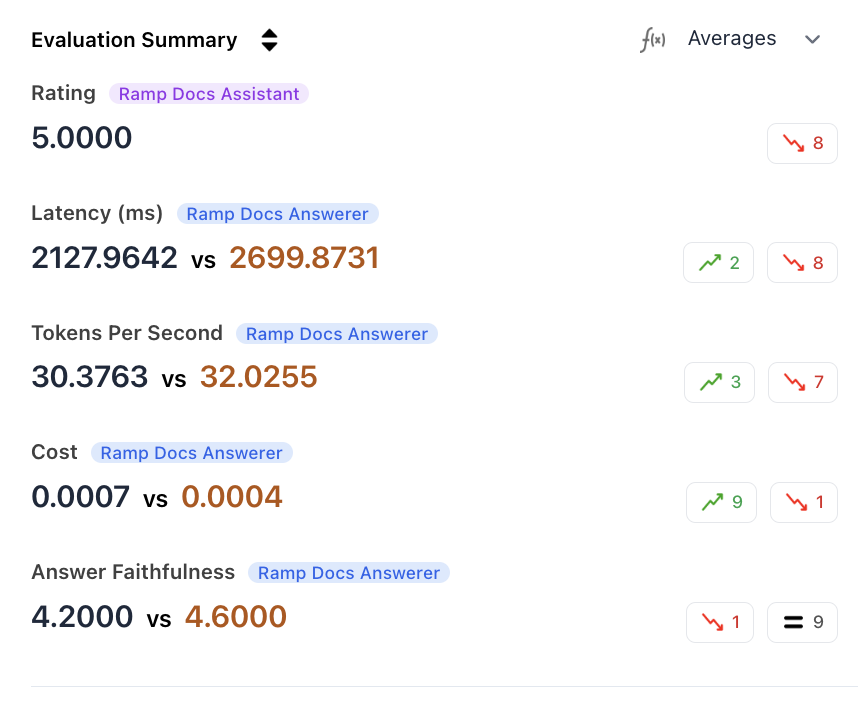
View aggregate scores for each metric across both runs. The summary highlights improved and regressed counts, so you can see at a glance which run performed better on each metric.
## How to Compare Runs
1. Go to **Experiments** in the sidebar
2. Select an experiment run to view its details
3. Click **compared with** and select another run from the dropdown
4. The view updates to show side-by-side comparison
Runs are comparable when they share common datapoints (matched by `datapoint_id`). For best results, run experiments against the same [HoneyHive dataset](/v2/datasets/run-experiments).
## Comparison Features
### Aggregated Metrics
View aggregate scores for each metric across both runs. The summary highlights improved and regressed counts, so you can see at a glance which run performed better on each metric.
 ### Metric Distribution
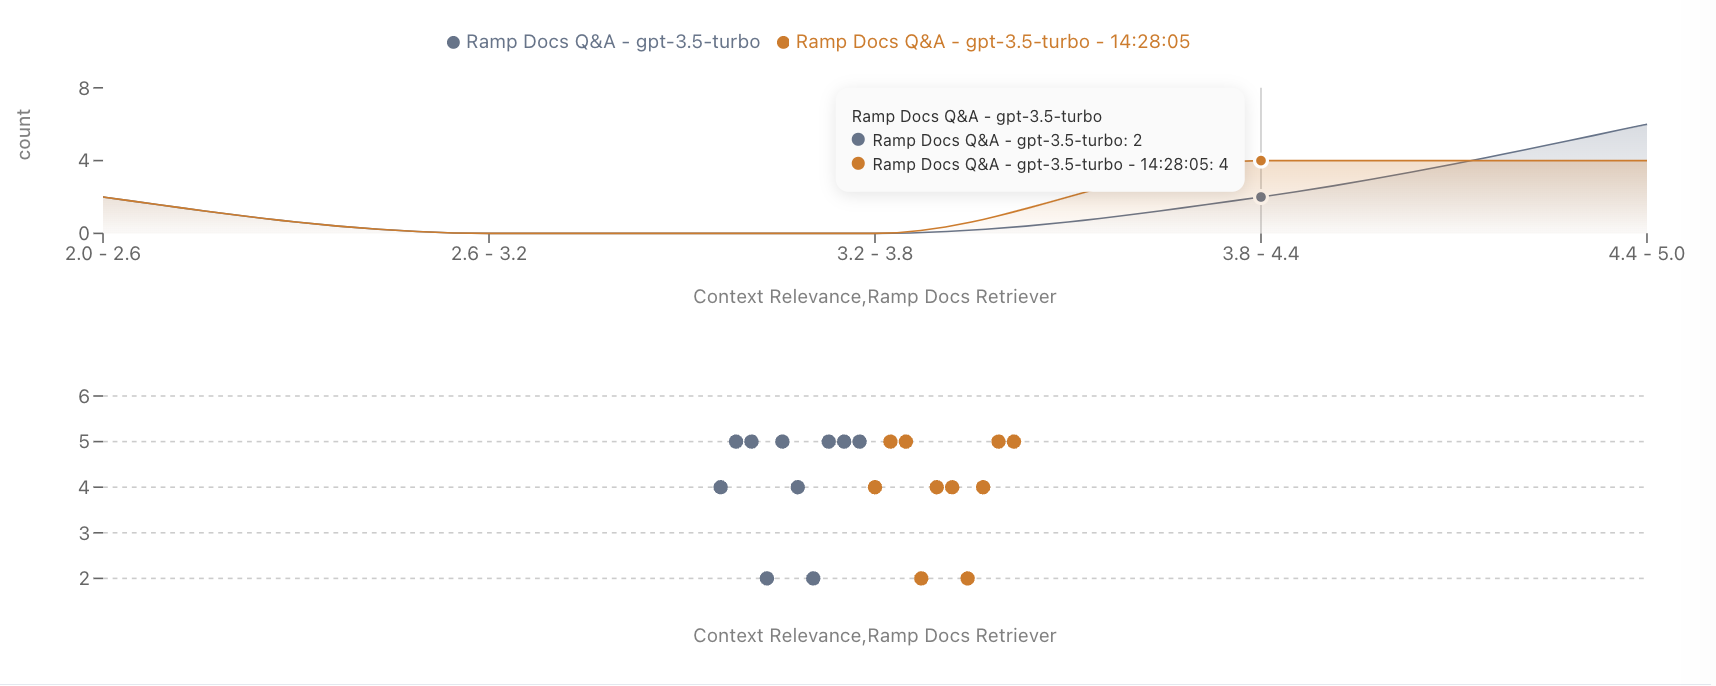
Analyze how scores are distributed across datapoints. This helps identify whether improvements are consistent or driven by outliers.
### Metric Distribution
Analyze how scores are distributed across datapoints. This helps identify whether improvements are consistent or driven by outliers.
 ### Improved/Regressed Filtering
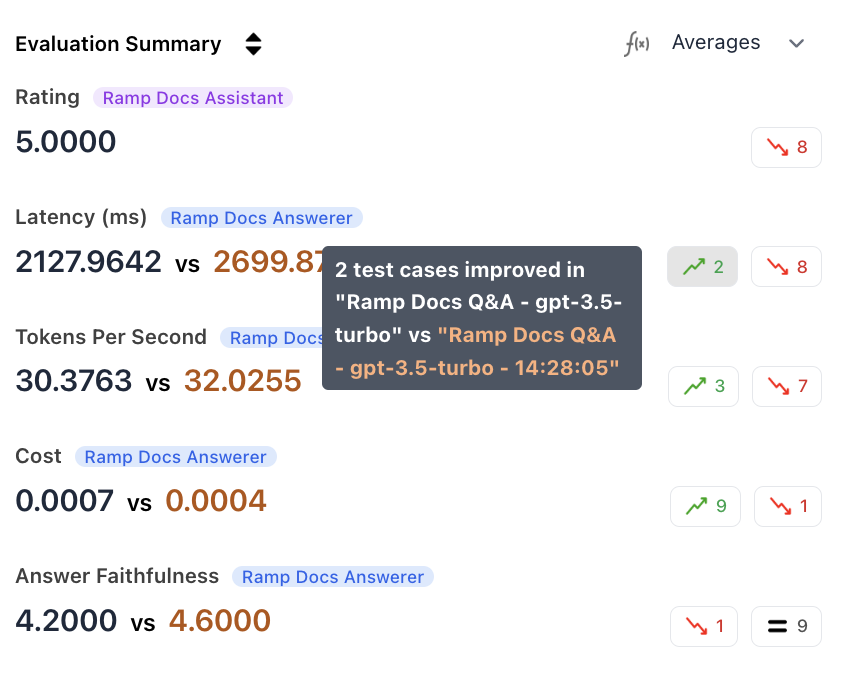
Filter the datapoint table to show only cases where performance improved or regressed on a specific metric.
### Improved/Regressed Filtering
Filter the datapoint table to show only cases where performance improved or regressed on a specific metric.
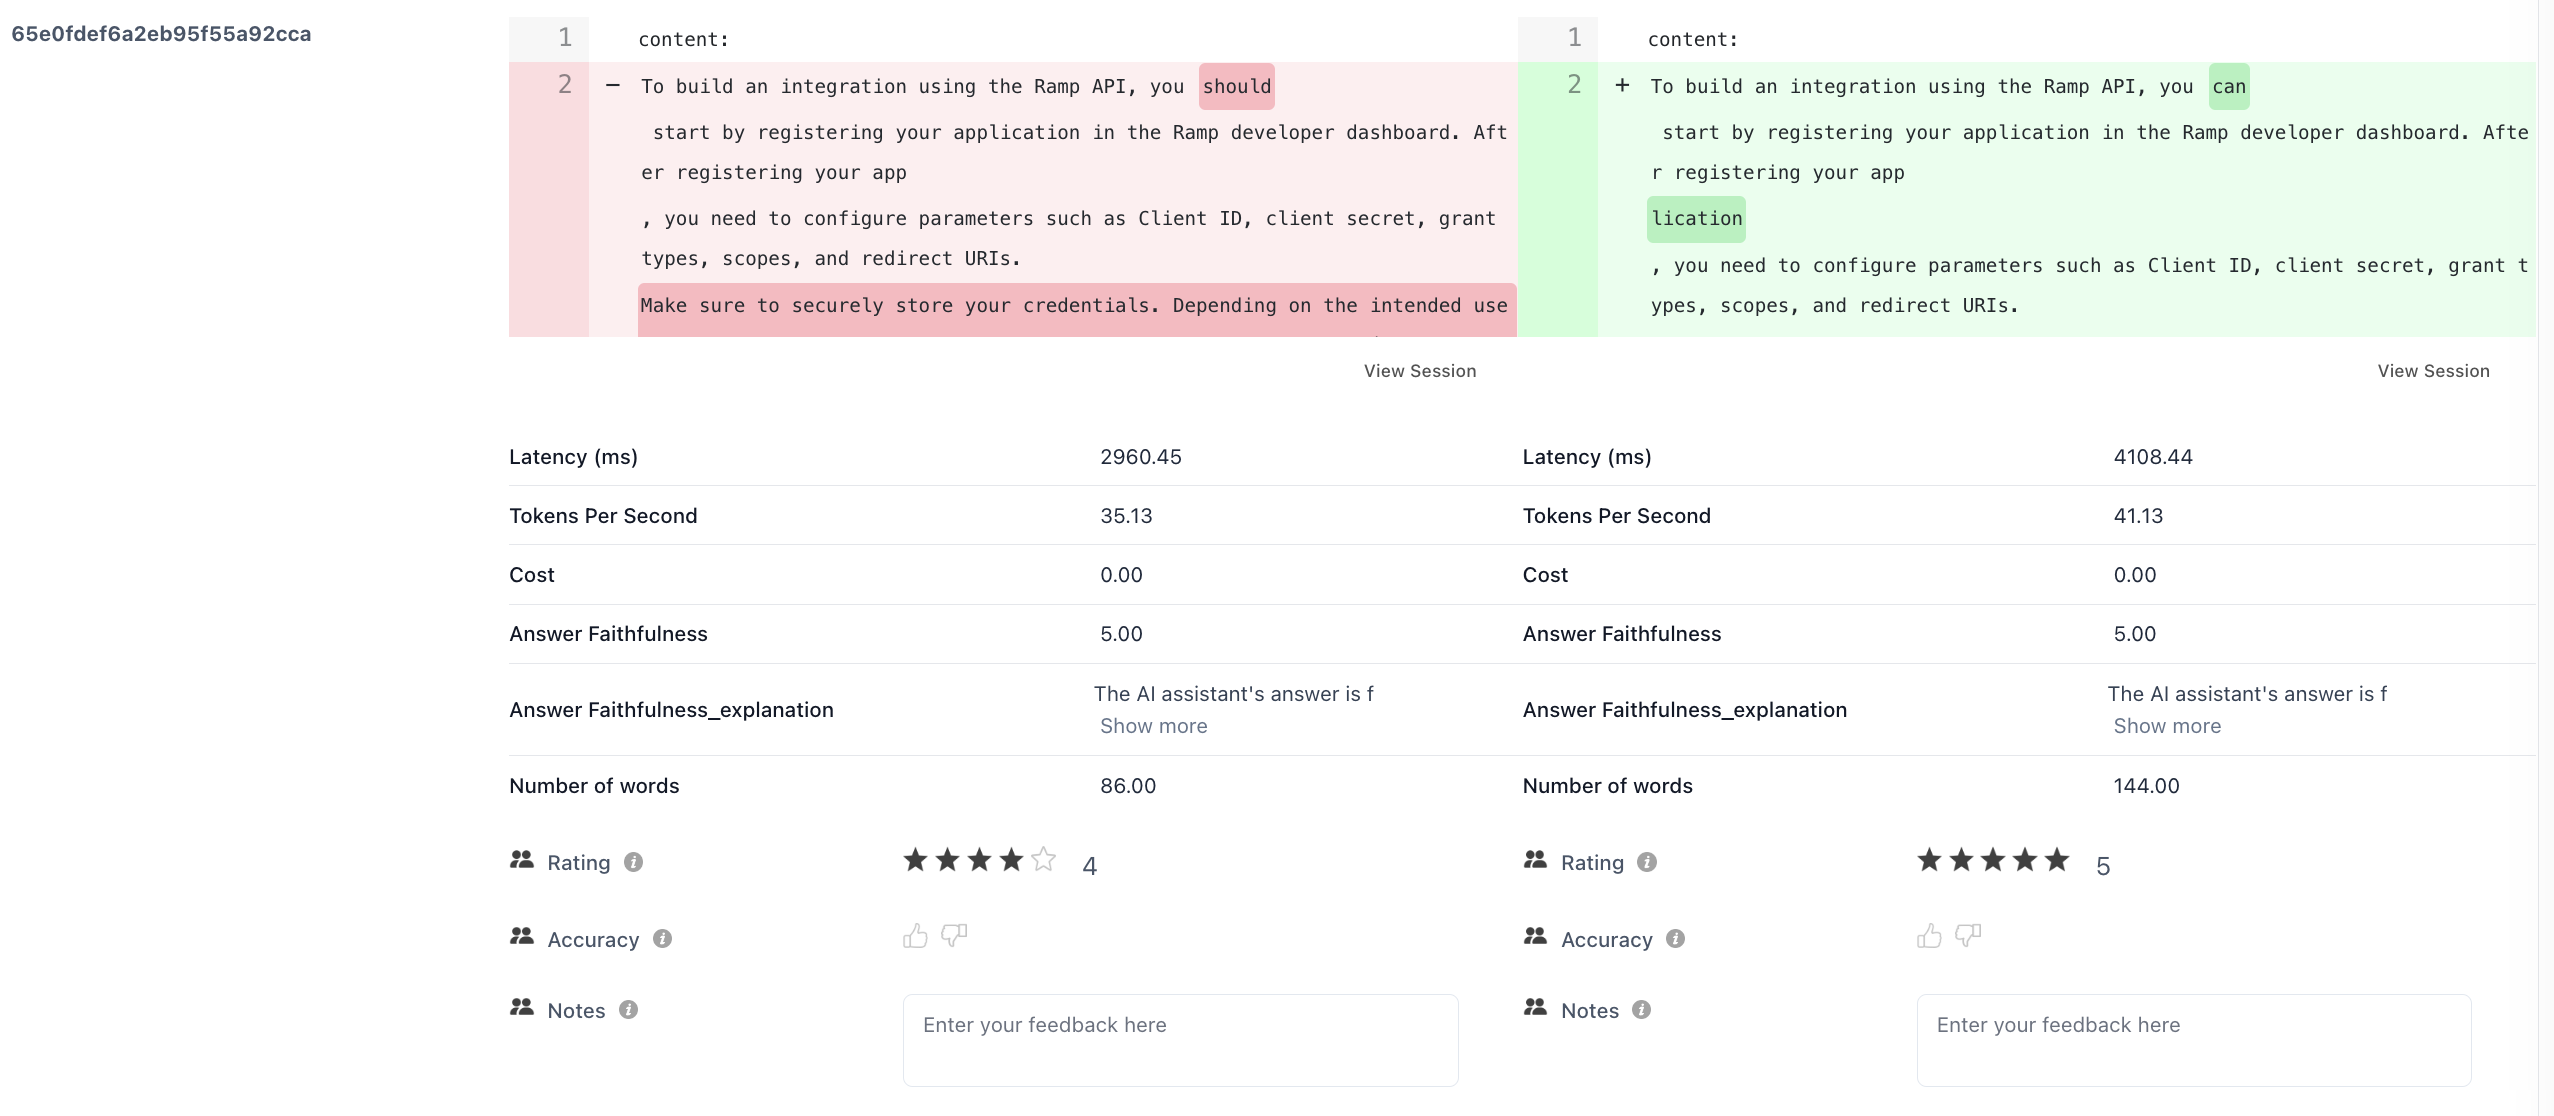
 ### Output Diff Viewer
Toggle **Diff** mode to see side-by-side outputs for each datapoint, with differences highlighted. This helps you understand exactly how outputs changed between runs.
### Output Diff Viewer
Toggle **Diff** mode to see side-by-side outputs for each datapoint, with differences highlighted. This helps you understand exactly how outputs changed between runs.
 ### Step-Level Comparisons
For multi-step traces, compare metrics at each individual step using the **Viewing Event** dropdown. This shows how changes affect specific stages of your pipeline.
## Programmatic Comparison
Use `compare_runs()` to analyze differences in code:
```python theme={null}
from honeyhive import HoneyHive
from honeyhive.experiments import compare_runs
client = HoneyHive()
comparison = compare_runs(
client=client,
new_run_id="run-abc123",
old_run_id="run-xyz789",
project_id="my-project",
aggregate_function="average", # "average", "sum", "min", or "max"
)
print(f"Common datapoints: {comparison.common_datapoints}")
for metric, delta in comparison.metric_deltas.items():
old = delta.get("old_aggregate", 0) or 0
new = delta.get("new_aggregate", 0) or 0
print(f"{metric}: {old:.2f} → {new:.2f} ({new - old:+.2f})")
```
### Working with Results
The `compare_runs()` function returns a `RunComparisonResult` object. Key properties include `common_datapoints`, `new_only_datapoints`, `old_only_datapoints`, and `metric_deltas`. Use the helper methods to quickly identify changes:
* `list_improved_metrics()` - metric names where at least one datapoint improved
* `list_degraded_metrics()` - metric names where at least one datapoint degraded
* `get_metric_delta(name)` - detailed delta for a specific metric, including `old_aggregate`, `new_aggregate`, `improved_count`, `degraded_count`, and lists of affected datapoint IDs
**Example: identify regressions**
```python theme={null}
comparison = compare_runs(client, new_run_id="run-new", old_run_id="run-old", project_id="my-project")
# List metrics that got better or worse
print("Improved:", comparison.list_improved_metrics())
print("Degraded:", comparison.list_degraded_metrics())
# Drill into a specific metric
delta = comparison.get_metric_delta("accuracy")
if delta:
print(f"Accuracy: {delta.get('old_aggregate', 0) or 0:.2f} → {delta.get('new_aggregate', 0) or 0:.2f}")
print(f" Improved on {delta['improved_count']} datapoints")
print(f" Degraded on {delta['degraded_count']} datapoints")
if delta["degraded"]:
print(f" Degraded datapoint IDs: {delta['degraded']}")
```
## Best Practices
| Practice | Why It Matters |
| --------------------------- | ------------------------------------------------------------------------------------- |
| **Same dataset** | Ensures you're comparing apples to apples |
| **One change at a time** | Isolates the impact of each change |
| **Sufficient sample size** | Avoids conclusions based on outliers |
| **Name runs descriptively** | Makes it easy to identify what changed (e.g., `gpt-4o-temp-0.3` vs `gpt-4o-temp-0.7`) |
## Related
Tutorial with step-by-step comparison example
Reuse the same HoneyHive dataset across comparison runs
Use `compare_runs()` in CI to block PRs on metric regressions
Understand the underlying evaluation architecture
### Step-Level Comparisons
For multi-step traces, compare metrics at each individual step using the **Viewing Event** dropdown. This shows how changes affect specific stages of your pipeline.
## Programmatic Comparison
Use `compare_runs()` to analyze differences in code:
```python theme={null}
from honeyhive import HoneyHive
from honeyhive.experiments import compare_runs
client = HoneyHive()
comparison = compare_runs(
client=client,
new_run_id="run-abc123",
old_run_id="run-xyz789",
project_id="my-project",
aggregate_function="average", # "average", "sum", "min", or "max"
)
print(f"Common datapoints: {comparison.common_datapoints}")
for metric, delta in comparison.metric_deltas.items():
old = delta.get("old_aggregate", 0) or 0
new = delta.get("new_aggregate", 0) or 0
print(f"{metric}: {old:.2f} → {new:.2f} ({new - old:+.2f})")
```
### Working with Results
The `compare_runs()` function returns a `RunComparisonResult` object. Key properties include `common_datapoints`, `new_only_datapoints`, `old_only_datapoints`, and `metric_deltas`. Use the helper methods to quickly identify changes:
* `list_improved_metrics()` - metric names where at least one datapoint improved
* `list_degraded_metrics()` - metric names where at least one datapoint degraded
* `get_metric_delta(name)` - detailed delta for a specific metric, including `old_aggregate`, `new_aggregate`, `improved_count`, `degraded_count`, and lists of affected datapoint IDs
**Example: identify regressions**
```python theme={null}
comparison = compare_runs(client, new_run_id="run-new", old_run_id="run-old", project_id="my-project")
# List metrics that got better or worse
print("Improved:", comparison.list_improved_metrics())
print("Degraded:", comparison.list_degraded_metrics())
# Drill into a specific metric
delta = comparison.get_metric_delta("accuracy")
if delta:
print(f"Accuracy: {delta.get('old_aggregate', 0) or 0:.2f} → {delta.get('new_aggregate', 0) or 0:.2f}")
print(f" Improved on {delta['improved_count']} datapoints")
print(f" Degraded on {delta['degraded_count']} datapoints")
if delta["degraded"]:
print(f" Degraded datapoint IDs: {delta['degraded']}")
```
## Best Practices
| Practice | Why It Matters |
| --------------------------- | ------------------------------------------------------------------------------------- |
| **Same dataset** | Ensures you're comparing apples to apples |
| **One change at a time** | Isolates the impact of each change |
| **Sufficient sample size** | Avoids conclusions based on outliers |
| **Name runs descriptively** | Makes it easy to identify what changed (e.g., `gpt-4o-temp-0.3` vs `gpt-4o-temp-0.7`) |
## Related
Tutorial with step-by-step comparison example
Reuse the same HoneyHive dataset across comparison runs
Use `compare_runs()` in CI to block PRs on metric regressions
Understand the underlying evaluation architecture