> ## Documentation Index
> Fetch the complete documentation index at: https://docs.honeyhive.ai/llms.txt
> Use this file to discover all available pages before exploring further.
# AI Experiments and Evaluations in HoneyHive
> Run offline experiments on datasets with evaluate() to compare prompts, models, and pipelines, score outputs, and catch regressions before deploy.
HoneyHive experiments let you run a function on a curated dataset, score each output with evaluators, and compare runs in the dashboard before you ship changes. Use the [experiments quickstart](/v2/introduction/experiments-quickstart) for a hands-on in-code walkthrough, then run against reusable HoneyHive data with [Run Experiments with HoneyHive Datasets](/v2/datasets/run-experiments) and build scorers in the [evaluators guide](/v2/evaluators/introduction).
 **New to experiments?** Follow our hands-on tutorial to run your first experiment in 10 minutes.
## What are the core parts of an experiment?
An experiment consists of three parts:
| Component | What it is | Example |
| -------------- | ------------------------------------------- | ------------------------------------- |
| **Function** | The code you want to evaluate | A prompt, RAG pipeline, or agent |
| **Dataset** | Test cases with inputs and expected outputs | Customer queries with correct intents |
| **Evaluators** | Functions that score outputs | Accuracy check, LLM-as-judge |
```python theme={null}
from honeyhive import evaluate
result = evaluate(
function=my_classifier, # Your function
dataset=test_cases, # Your test data
evaluators=[accuracy_check], # Your scoring functions
name="intent-classifier-v2"
)
```
## Why Use Experiments?
* **Iterate with confidence** - Test prompt variations, model configurations, and architectural changes against consistent metrics
* **Track improvements** - Monitor how changes affect key metrics over time
* **Automate quality checks** - Run experiments in CI/CD pipelines to catch issues before deployment
* **Compare approaches** - Evaluate different models, retrieval methods, or chunking strategies side-by-side
* **Ensure reliability** - Catch regressions by testing across diverse scenarios before deploying
## How does evaluate() work?
When you call `evaluate()`:
1. **Run** - Your function executes on each datapoint (with automatic tracing)
2. **Score** - Evaluators measure each output against ground truth
3. **Aggregate** - HoneyHive computes metrics (average, min, max)
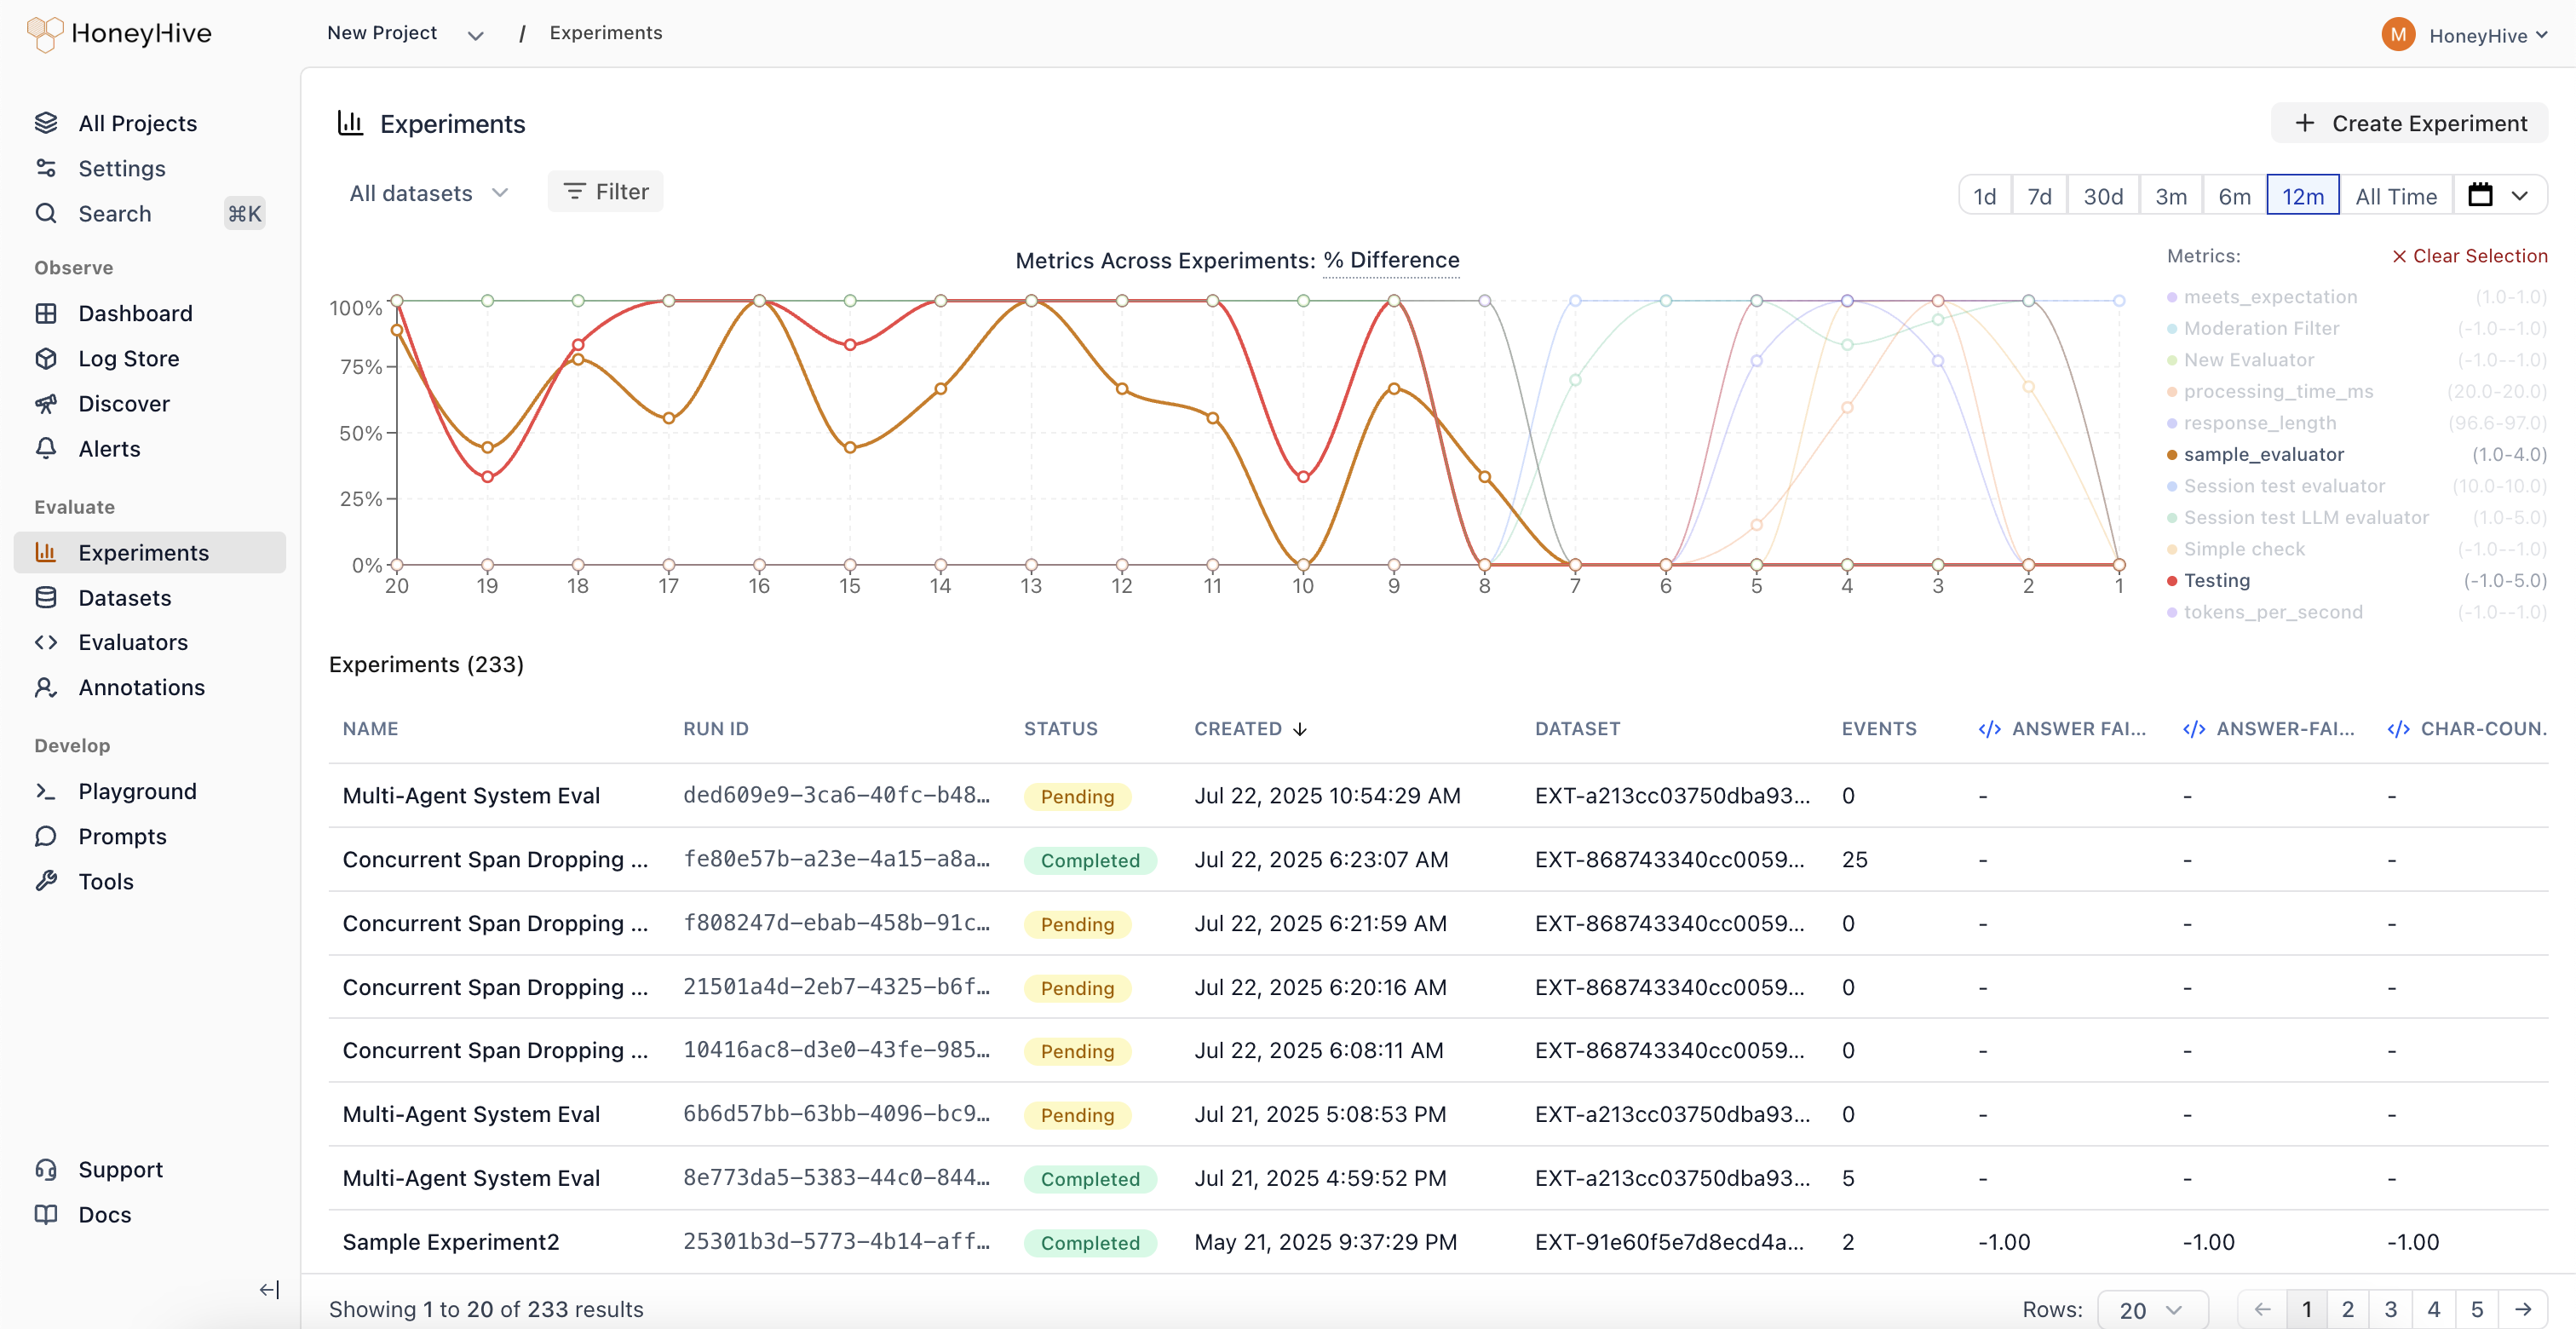
4. **View** - Results appear in the dashboard for analysis
### Trace Linking
Every execution creates a traced session with metadata that links it to:
* **`run_id`** - Groups all traces from a single experiment run together. By default, `evaluate()` auto-generates a UUID for this, but you can pass a custom `run_id` to correlate results with CI pipelines or other external systems
* **`datapoint_id`** - Identifies which test case produced each trace
This linking enables powerful comparisons:
* **Same datapoint, different runs** - Compare how prompt v1 vs v2 handled the same input
* **Aggregate metrics** - See average accuracy across all test cases in a run
* **Regression detection** - Identify which specific inputs degraded between versions
### Auto-Instrumenting LLM Providers
Use the `instrumentors` parameter to automatically trace LLM calls from third-party libraries (OpenAI, Anthropic, etc.) during experiments. Each zero-argument factory or constructor is called per datapoint so every datapoint gets its own instrumentor instance for proper trace isolation.
```python theme={null}
from openinference.instrumentation.openai import OpenAIInstrumentor
result = evaluate(
function=my_pipeline,
dataset=test_cases,
evaluators=[quality_check],
name="instrumented-run",
instrumentors=[lambda: OpenAIInstrumentor()]
)
```
Pass each instrumentor as a **factory callable** or constructor, such as `OpenAIInstrumentor` or `lambda: OpenAIInstrumentor(config=...)`, not an already-created instance. This ensures each datapoint gets a fresh instrumentor and avoids cross-datapoint trace routing issues.
### Async Function Support
`evaluate()` accepts both synchronous and async functions. Async functions are automatically detected and executed with `asyncio.run()` inside worker threads, with no extra configuration needed.
```python theme={null}
async def my_async_pipeline(datapoint):
inputs = datapoint["inputs"]
result = await async_llm_call(inputs["query"])
return {"answer": result}
result = evaluate(
function=my_async_pipeline, # Async detected automatically
dataset=test_cases,
evaluators=[accuracy],
name="async-experiment"
)
```
### Parallel Execution
Control concurrency with `max_workers` (default: `10`). Datapoints run on a worker thread pool, with up to `max_workers` executing at the same time. Each datapoint still gets its own isolated tracer instance.
```python theme={null}
result = evaluate(
function=my_pipeline,
dataset=large_dataset, # 500 items
max_workers=20, # Process 20 items simultaneously
name="parallel-run"
)
```
| Setting | Use Case |
| ---------------- | ------------------------------------- |
| `max_workers=1` | Sequential execution (debugging) |
| `max_workers=5` | Conservative (strict API rate limits) |
| `max_workers=10` | Balanced (default) |
| `max_workers=20` | Aggressive (fast, watch rate limits) |
### Controlling Results Output
By default, `evaluate()` prints a formatted results table to the console after each run. Disable this with `print_results=False`:
```python theme={null}
result = evaluate(
function=my_pipeline,
dataset=test_cases,
name="silent-run",
print_results=False # Suppress console table output
)
```
### Git Context
When you run `evaluate()` from a Git repository, the SDK automatically captures Git metadata on each experiment run:
* **Commit hash** and **branch name**
* **Author** and **remote URL**
* **Dirty status** (whether there are uncommitted changes)
This metadata appears under `metadata.git` on the experiment run in the dashboard, making it easy to trace any result back to the exact code that produced it. No configuration is needed - if `git` is available and you're inside a repo, the context is collected automatically.
For deeper understanding of the framework design and evaluation philosophy, see [Evaluation Framework](/v2/evaluation/concepts).
**Using another language?** Use the [TypeScript API SDK](/v2/sdk-reference/typescript) or [generate a typed client](/v2/sdk-reference/openapi-sdks) in any language from our OpenAPI spec.
## Where should you go next?
Hands-on tutorial to get started in 10 minutes
Reuse datasets stored in HoneyHive with `dataset_id`
Identify improvements and regressions across versions
Sync results you scored yourself, with or without the SDK
Gate every pull request on evaluation metrics via GitHub Actions
Generate behavior-focused tests for HoneyHive-traced agents
Build code, LLM-as-judge, or human evaluators
Create and version test datasets in HoneyHive
**New to experiments?** Follow our hands-on tutorial to run your first experiment in 10 minutes.
## What are the core parts of an experiment?
An experiment consists of three parts:
| Component | What it is | Example |
| -------------- | ------------------------------------------- | ------------------------------------- |
| **Function** | The code you want to evaluate | A prompt, RAG pipeline, or agent |
| **Dataset** | Test cases with inputs and expected outputs | Customer queries with correct intents |
| **Evaluators** | Functions that score outputs | Accuracy check, LLM-as-judge |
```python theme={null}
from honeyhive import evaluate
result = evaluate(
function=my_classifier, # Your function
dataset=test_cases, # Your test data
evaluators=[accuracy_check], # Your scoring functions
name="intent-classifier-v2"
)
```
## Why Use Experiments?
* **Iterate with confidence** - Test prompt variations, model configurations, and architectural changes against consistent metrics
* **Track improvements** - Monitor how changes affect key metrics over time
* **Automate quality checks** - Run experiments in CI/CD pipelines to catch issues before deployment
* **Compare approaches** - Evaluate different models, retrieval methods, or chunking strategies side-by-side
* **Ensure reliability** - Catch regressions by testing across diverse scenarios before deploying
## How does evaluate() work?
When you call `evaluate()`:
1. **Run** - Your function executes on each datapoint (with automatic tracing)
2. **Score** - Evaluators measure each output against ground truth
3. **Aggregate** - HoneyHive computes metrics (average, min, max)
4. **View** - Results appear in the dashboard for analysis
### Trace Linking
Every execution creates a traced session with metadata that links it to:
* **`run_id`** - Groups all traces from a single experiment run together. By default, `evaluate()` auto-generates a UUID for this, but you can pass a custom `run_id` to correlate results with CI pipelines or other external systems
* **`datapoint_id`** - Identifies which test case produced each trace
This linking enables powerful comparisons:
* **Same datapoint, different runs** - Compare how prompt v1 vs v2 handled the same input
* **Aggregate metrics** - See average accuracy across all test cases in a run
* **Regression detection** - Identify which specific inputs degraded between versions
### Auto-Instrumenting LLM Providers
Use the `instrumentors` parameter to automatically trace LLM calls from third-party libraries (OpenAI, Anthropic, etc.) during experiments. Each zero-argument factory or constructor is called per datapoint so every datapoint gets its own instrumentor instance for proper trace isolation.
```python theme={null}
from openinference.instrumentation.openai import OpenAIInstrumentor
result = evaluate(
function=my_pipeline,
dataset=test_cases,
evaluators=[quality_check],
name="instrumented-run",
instrumentors=[lambda: OpenAIInstrumentor()]
)
```
Pass each instrumentor as a **factory callable** or constructor, such as `OpenAIInstrumentor` or `lambda: OpenAIInstrumentor(config=...)`, not an already-created instance. This ensures each datapoint gets a fresh instrumentor and avoids cross-datapoint trace routing issues.
### Async Function Support
`evaluate()` accepts both synchronous and async functions. Async functions are automatically detected and executed with `asyncio.run()` inside worker threads, with no extra configuration needed.
```python theme={null}
async def my_async_pipeline(datapoint):
inputs = datapoint["inputs"]
result = await async_llm_call(inputs["query"])
return {"answer": result}
result = evaluate(
function=my_async_pipeline, # Async detected automatically
dataset=test_cases,
evaluators=[accuracy],
name="async-experiment"
)
```
### Parallel Execution
Control concurrency with `max_workers` (default: `10`). Datapoints run on a worker thread pool, with up to `max_workers` executing at the same time. Each datapoint still gets its own isolated tracer instance.
```python theme={null}
result = evaluate(
function=my_pipeline,
dataset=large_dataset, # 500 items
max_workers=20, # Process 20 items simultaneously
name="parallel-run"
)
```
| Setting | Use Case |
| ---------------- | ------------------------------------- |
| `max_workers=1` | Sequential execution (debugging) |
| `max_workers=5` | Conservative (strict API rate limits) |
| `max_workers=10` | Balanced (default) |
| `max_workers=20` | Aggressive (fast, watch rate limits) |
### Controlling Results Output
By default, `evaluate()` prints a formatted results table to the console after each run. Disable this with `print_results=False`:
```python theme={null}
result = evaluate(
function=my_pipeline,
dataset=test_cases,
name="silent-run",
print_results=False # Suppress console table output
)
```
### Git Context
When you run `evaluate()` from a Git repository, the SDK automatically captures Git metadata on each experiment run:
* **Commit hash** and **branch name**
* **Author** and **remote URL**
* **Dirty status** (whether there are uncommitted changes)
This metadata appears under `metadata.git` on the experiment run in the dashboard, making it easy to trace any result back to the exact code that produced it. No configuration is needed - if `git` is available and you're inside a repo, the context is collected automatically.
For deeper understanding of the framework design and evaluation philosophy, see [Evaluation Framework](/v2/evaluation/concepts).
**Using another language?** Use the [TypeScript API SDK](/v2/sdk-reference/typescript) or [generate a typed client](/v2/sdk-reference/openapi-sdks) in any language from our OpenAPI spec.
## Where should you go next?
Hands-on tutorial to get started in 10 minutes
Reuse datasets stored in HoneyHive with `dataset_id`
Identify improvements and regressions across versions
Sync results you scored yourself, with or without the SDK
Gate every pull request on evaluation metrics via GitHub Actions
Generate behavior-focused tests for HoneyHive-traced agents
Build code, LLM-as-judge, or human evaluators
Create and version test datasets in HoneyHive