> ## Documentation Index
> Fetch the complete documentation index at: https://docs.honeyhive.ai/llms.txt
> Use this file to discover all available pages before exploring further.
# Creating Alerts
> Create HoneyHive alerts on AI performance, quality, and cost metrics with step-by-step rules so your team gets notified before users see failures.
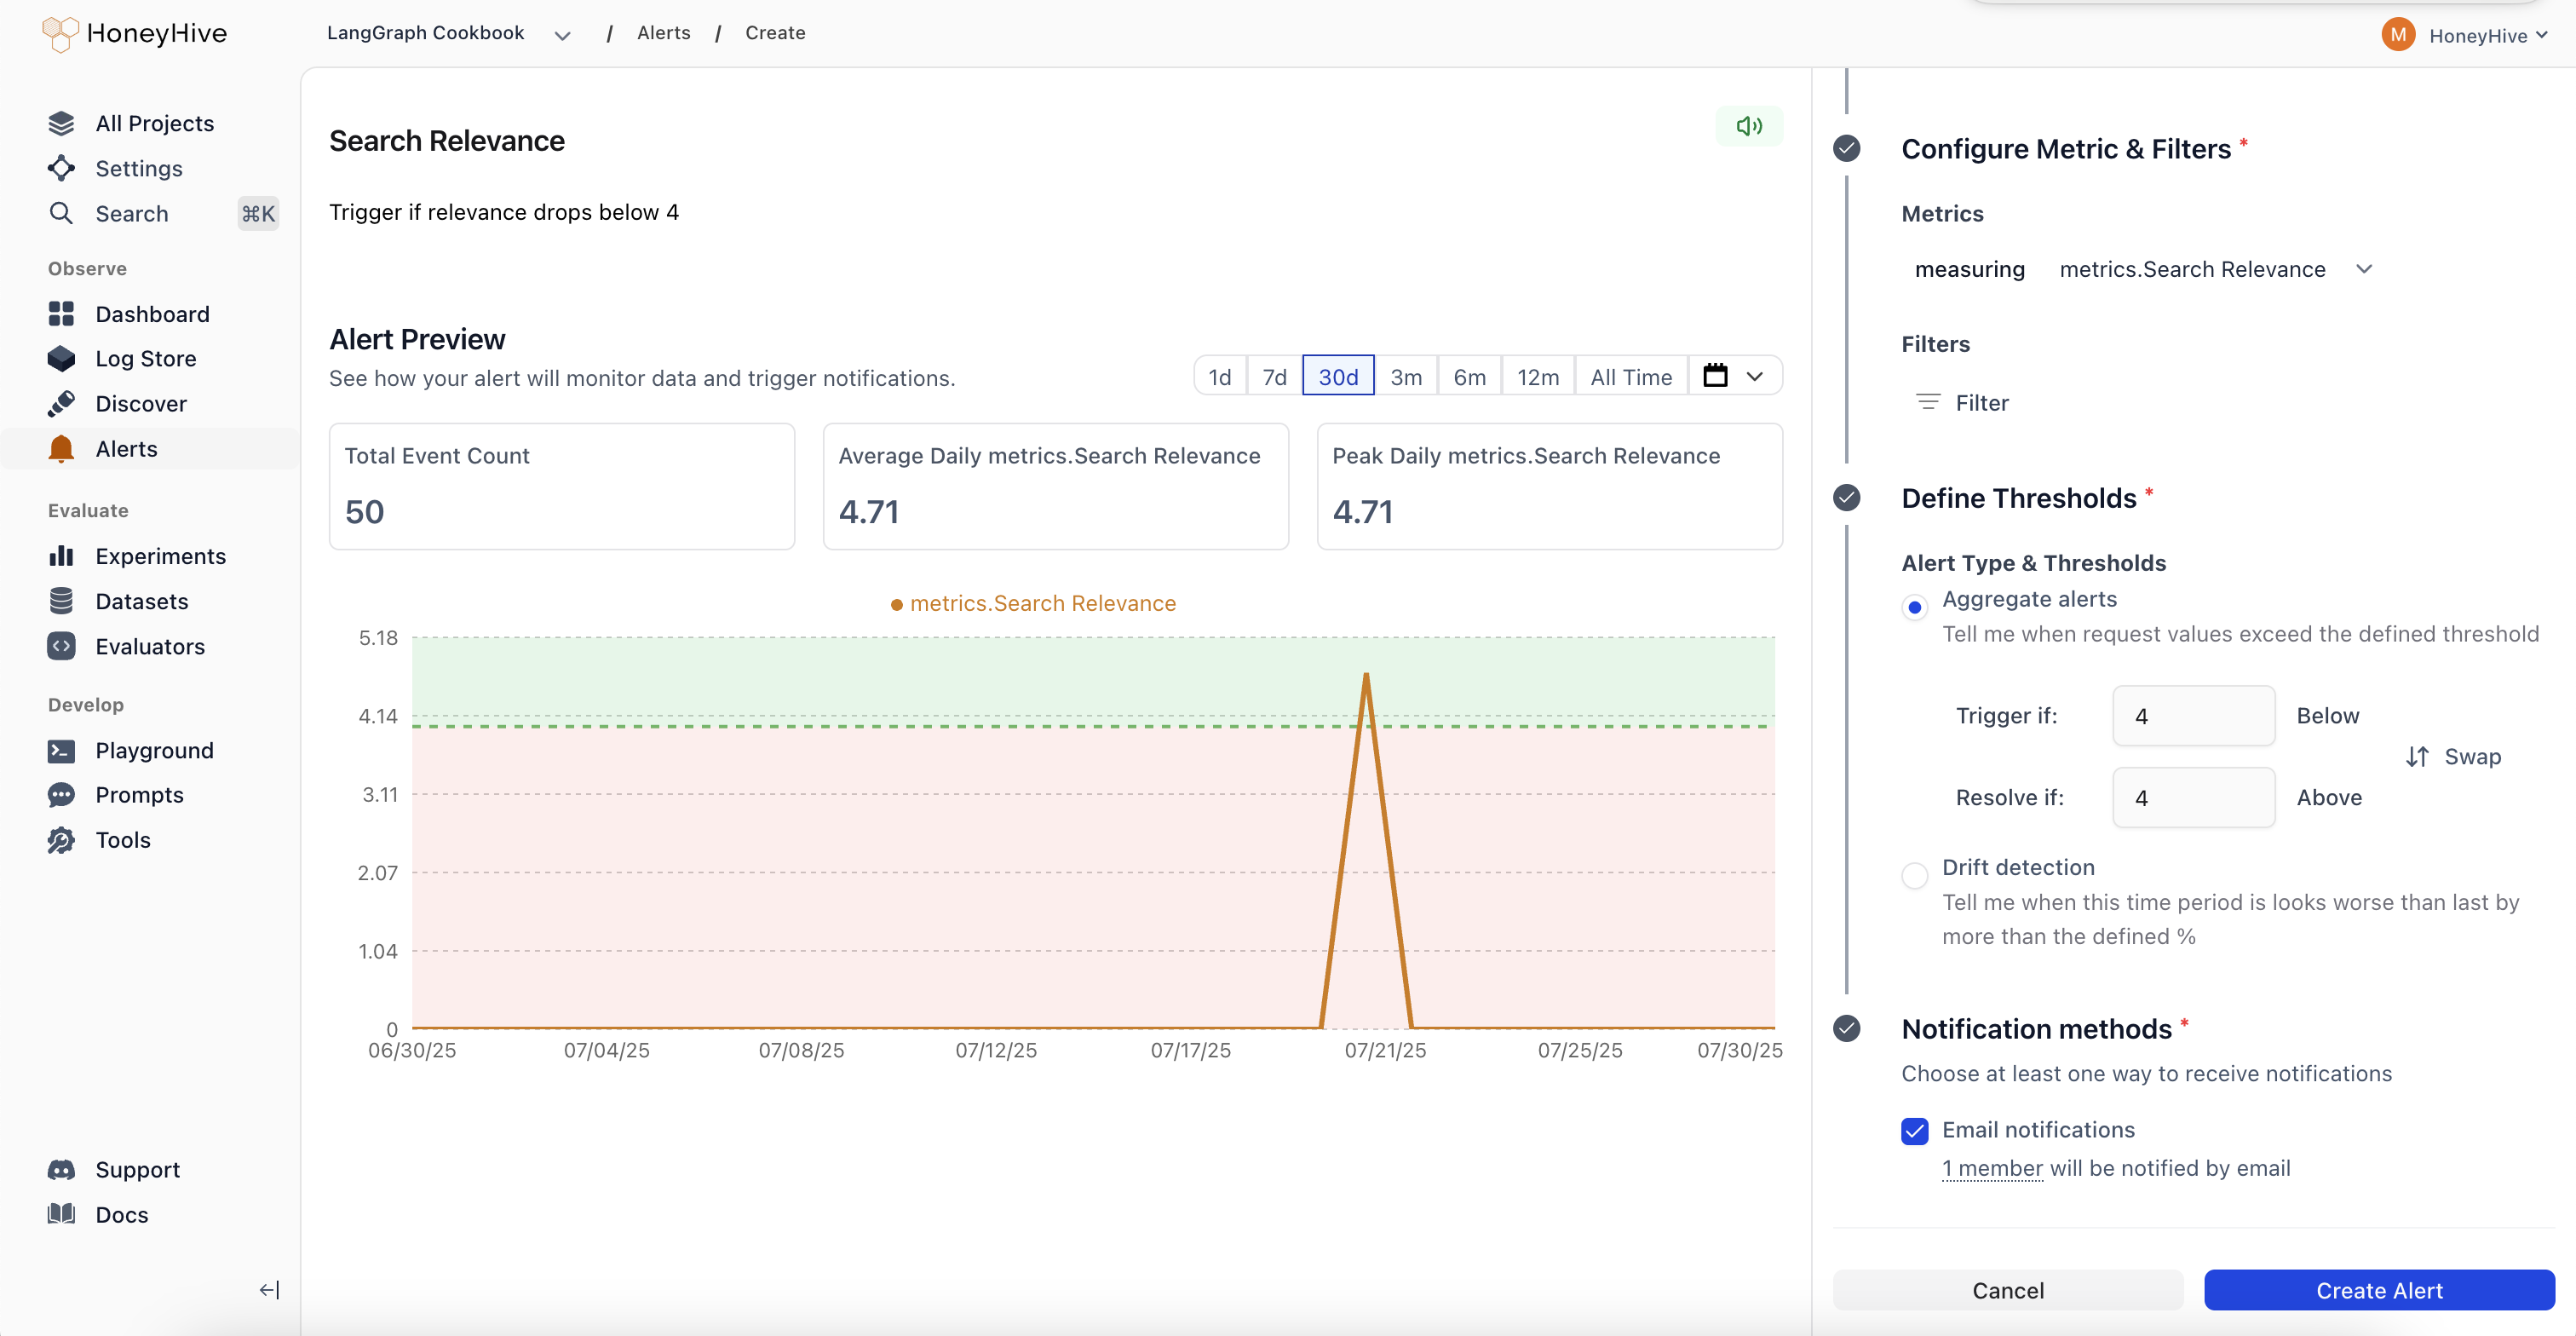 This guide walks you through creating an alert. For an overview of alert types, states, and management actions, see [Alerts Overview](/v2/monitoring/alerts/alerts_overview).
## Create an Alert
Give your alert a clear name and description so your team knows what it monitors.
Select how often to evaluate your alert:
* **Hourly**: Checked every hour for immediate detection
* **Daily**: Checked every hour but evaluated over daily periods
* **Weekly**: Checked daily but evaluated over weekly periods
* **Monthly**: Checked daily but evaluated over monthly periods
*Note: More frequent checking means faster detection, even for longer evaluation periods.*
**Event Type**: Choose the data source for your alert
* **Models**: Individual LLM API calls and completions
* **Sessions**: Complete user conversations or workflows
* **Tools**: Function calls and external integrations
* **Chains**: Multi-step workflows and complex pipelines
**Event Filters**: Narrow down to specific segments (optional)
* Filter by event name, tenant, or any custom metadata
* Example: Only monitor production traffic or specific model versions
**Metric**: What to measure. The available metrics depend on the event type you selected:
For **Models**, **Tools**, and **Chains**:
* `duration` - Span latency
* `metadata.*` - Any metadata field (e.g., `metadata.total_tokens`, `metadata.cost`)
* `metrics.*` - Any custom metric or evaluator score (e.g., `metrics.faithfulness`, `metrics.relevance`)
* `event_id` - Event count (use with COUNT aggregation)
For **Sessions**, you can alert on aggregate fields computed across all child spans in the session:
* `duration` - Total session wall-clock duration
* `metadata.cost` - Total cost across all LLM calls in the session
* `metadata.total_tokens` - Total tokens (prompt + completion) across the session
* `metadata.prompt_tokens` - Total prompt tokens across the session
* `metadata.completion_tokens` - Total completion tokens across the session
* `metadata.num_events` - Number of child spans in the session
* `metadata.num_model_events` - Number of LLM call spans in the session
* `metadata.has_feedback` - Boolean indicating whether the session has received user feedback
**Aggregation**: How to summarize the data
* **COUNT**: Total number of events
* **AVERAGE**: Mean value across events
* **P90/P95/P99**: Percentile values for performance monitoring
* **SUM**: Total of all values
* **MIN/MAX**: Extreme values
* **MEDIAN**: Middle value
**Alert Type**: Choose between aggregate alerts (absolute thresholds) or drift alerts (relative change detection)
**Trigger Threshold**: The value that triggers the alert
* Aggregate example: "Average latency > 2 seconds"
* Drift example: "25% worse than previous period"
**Resolution Threshold**: When the alert auto-resolves (defaults to the inverse of your trigger threshold)
* **Channel**: Email is available by default. **Slack** (via incoming webhook) and **Webhook** (HTTP endpoint) channels are also supported - self-hosted customers can enable them via environment variables, and cloud customers can [contact us](mailto:support@honeyhive.ai) to get them enabled.
* **Recipients**: Choose specific team members or notify all project members
Notifications include the metric value that triggered the alert and a direct link to investigate.
## Next Steps
Once your alert is created, you can manage it from the alerts page. See [Alerts Overview](/v2/monitoring/alerts/alerts_overview) for details on alert states and actions like pausing, muting, and resolving alerts.
## Related topics
- [Monitor AI Application Performance in HoneyHive](/v2/monitoring/overview.md)
- [Overview](/v2/monitoring/alerts/alerts_overview.md)
- [Alerts](/v2/cli-reference/ref/alerts.md)
This guide walks you through creating an alert. For an overview of alert types, states, and management actions, see [Alerts Overview](/v2/monitoring/alerts/alerts_overview).
## Create an Alert
Give your alert a clear name and description so your team knows what it monitors.
Select how often to evaluate your alert:
* **Hourly**: Checked every hour for immediate detection
* **Daily**: Checked every hour but evaluated over daily periods
* **Weekly**: Checked daily but evaluated over weekly periods
* **Monthly**: Checked daily but evaluated over monthly periods
*Note: More frequent checking means faster detection, even for longer evaluation periods.*
**Event Type**: Choose the data source for your alert
* **Models**: Individual LLM API calls and completions
* **Sessions**: Complete user conversations or workflows
* **Tools**: Function calls and external integrations
* **Chains**: Multi-step workflows and complex pipelines
**Event Filters**: Narrow down to specific segments (optional)
* Filter by event name, tenant, or any custom metadata
* Example: Only monitor production traffic or specific model versions
**Metric**: What to measure. The available metrics depend on the event type you selected:
For **Models**, **Tools**, and **Chains**:
* `duration` - Span latency
* `metadata.*` - Any metadata field (e.g., `metadata.total_tokens`, `metadata.cost`)
* `metrics.*` - Any custom metric or evaluator score (e.g., `metrics.faithfulness`, `metrics.relevance`)
* `event_id` - Event count (use with COUNT aggregation)
For **Sessions**, you can alert on aggregate fields computed across all child spans in the session:
* `duration` - Total session wall-clock duration
* `metadata.cost` - Total cost across all LLM calls in the session
* `metadata.total_tokens` - Total tokens (prompt + completion) across the session
* `metadata.prompt_tokens` - Total prompt tokens across the session
* `metadata.completion_tokens` - Total completion tokens across the session
* `metadata.num_events` - Number of child spans in the session
* `metadata.num_model_events` - Number of LLM call spans in the session
* `metadata.has_feedback` - Boolean indicating whether the session has received user feedback
**Aggregation**: How to summarize the data
* **COUNT**: Total number of events
* **AVERAGE**: Mean value across events
* **P90/P95/P99**: Percentile values for performance monitoring
* **SUM**: Total of all values
* **MIN/MAX**: Extreme values
* **MEDIAN**: Middle value
**Alert Type**: Choose between aggregate alerts (absolute thresholds) or drift alerts (relative change detection)
**Trigger Threshold**: The value that triggers the alert
* Aggregate example: "Average latency > 2 seconds"
* Drift example: "25% worse than previous period"
**Resolution Threshold**: When the alert auto-resolves (defaults to the inverse of your trigger threshold)
* **Channel**: Email is available by default. **Slack** (via incoming webhook) and **Webhook** (HTTP endpoint) channels are also supported - self-hosted customers can enable them via environment variables, and cloud customers can [contact us](mailto:support@honeyhive.ai) to get them enabled.
* **Recipients**: Choose specific team members or notify all project members
Notifications include the metric value that triggered the alert and a direct link to investigate.
## Next Steps
Once your alert is created, you can manage it from the alerts page. See [Alerts Overview](/v2/monitoring/alerts/alerts_overview) for details on alert states and actions like pausing, muting, and resolving alerts.
## Related topics
- [Monitor AI Application Performance in HoneyHive](/v2/monitoring/overview.md)
- [Overview](/v2/monitoring/alerts/alerts_overview.md)
- [Alerts](/v2/cli-reference/ref/alerts.md)