> ## Documentation Index
> Fetch the complete documentation index at: https://docs.honeyhive.ai/llms.txt
> Use this file to discover all available pages before exploring further.
# Overview
> Learn how HoneyHive alerts monitor LLM cost, latency, error rates, and evaluator scores, including alert types, states, and notification channels.
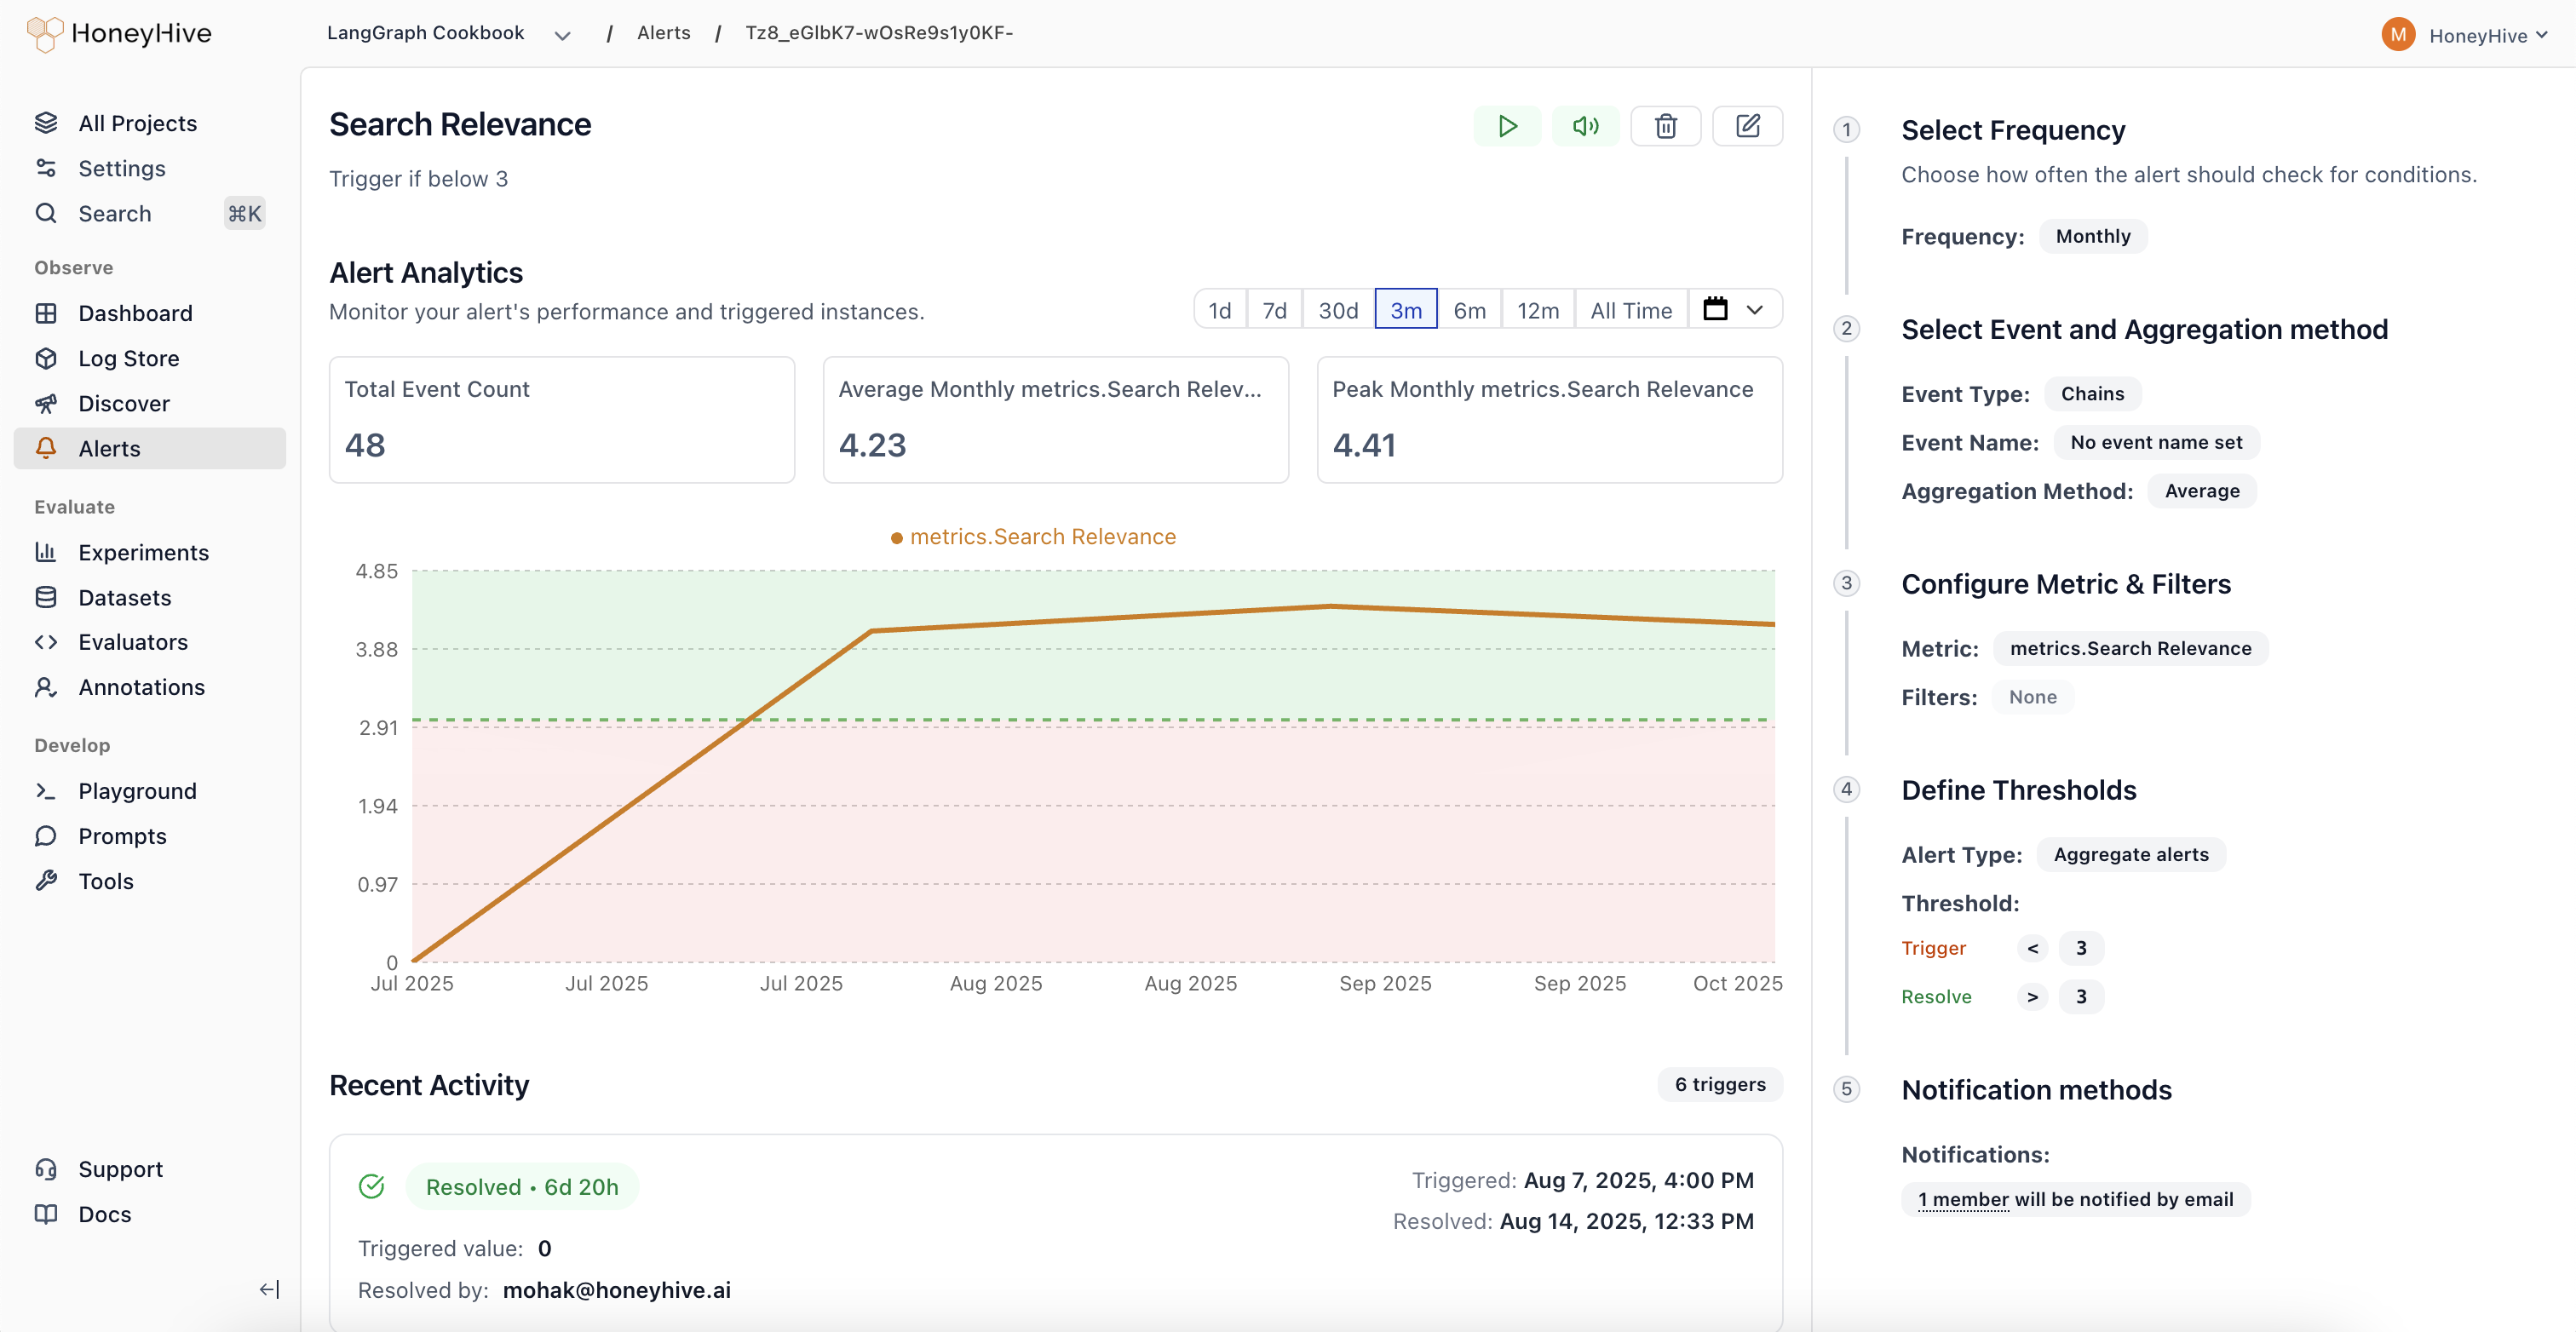
The alerts feature helps you stay on top of your LLM application's performance by automatically monitoring key metrics and notifying you when things go wrong. Whether you're tracking error rates, response times, or custom evaluation scores, alerts ensure you catch issues before they impact your users.
 ### What You Can Monitor
* **Performance metrics**: Latency, error rates, and API response times
* **Quality metrics**: Evaluator scores, safety violations, and content quality
* **Business metrics**: Usage costs, request volumes, and user satisfaction
* **Custom fields**: Any metric or metadata field in your events and sessions
### Understanding Alert States
* **Active**: Normal monitoring - alert is checking thresholds regularly
* **Triggered**: Threshold exceeded, notifications sent, investigation needed
* **Resolved**: Issue cleared, alert returning to normal monitoring
* **Paused**: Monitoring temporarily stopped (manual action required to resume)
* **Muted**: Still monitoring but notifications disabled
### Alert Types
**Aggregate Alerts**: Monitor when metrics cross absolute thresholds (e.g., "Alert when average toxicity score exceeds 30%")
```mermaid theme={null}
stateDiagram-v2
direction TB
[*] --> Active
Active: Active
Triggered: Triggered
Resolved: Resolved
Paused: Paused
classDef active fill:#00C853,stroke:#00B248,stroke-width:4px,color:white,rx:15px,ry:15px
classDef triggered fill:#FF3D00,stroke:#DD2C00,stroke-width:4px,color:white,rx:15px,ry:15px
classDef resolved fill:#2962FF,stroke:#2979FF,stroke-width:4px,color:white,rx:15px,ry:15px
classDef paused fill:#FFB300,stroke:#FFA000,stroke-width:4px,color:white,rx:15px,ry:15px
class Active active
class Triggered triggered
class Resolved resolved
class Paused paused
Active --> Triggered: Aggregate crosses
### What You Can Monitor
* **Performance metrics**: Latency, error rates, and API response times
* **Quality metrics**: Evaluator scores, safety violations, and content quality
* **Business metrics**: Usage costs, request volumes, and user satisfaction
* **Custom fields**: Any metric or metadata field in your events and sessions
### Understanding Alert States
* **Active**: Normal monitoring - alert is checking thresholds regularly
* **Triggered**: Threshold exceeded, notifications sent, investigation needed
* **Resolved**: Issue cleared, alert returning to normal monitoring
* **Paused**: Monitoring temporarily stopped (manual action required to resume)
* **Muted**: Still monitoring but notifications disabled
### Alert Types
**Aggregate Alerts**: Monitor when metrics cross absolute thresholds (e.g., "Alert when average toxicity score exceeds 30%")
```mermaid theme={null}
stateDiagram-v2
direction TB
[*] --> Active
Active: Active
Triggered: Triggered
Resolved: Resolved
Paused: Paused
classDef active fill:#00C853,stroke:#00B248,stroke-width:4px,color:white,rx:15px,ry:15px
classDef triggered fill:#FF3D00,stroke:#DD2C00,stroke-width:4px,color:white,rx:15px,ry:15px
classDef resolved fill:#2962FF,stroke:#2979FF,stroke-width:4px,color:white,rx:15px,ry:15px
classDef paused fill:#FFB300,stroke:#FFA000,stroke-width:4px,color:white,rx:15px,ry:15px
class Active active
class Triggered triggered
class Resolved resolved
class Paused paused
Active --> Triggered: Aggregate crosses
Critical Threshold
Triggered --> Resolved: Resolve manually
Triggered --> Resolved: Aggregate within
Resolved Threshold
Resolved --> Active: Stays within
Resolved Threshold
Active --> Paused: Pause
Paused --> Active: Resume
```
**Drift Alerts**: Detect when performance degrades compared to previous periods (e.g., "Alert when this week's latency is 20% worse than last week")
```mermaid theme={null}
stateDiagram-v2
direction TB
[*] --> Active
Active: Active
Triggered: Triggered
Resolved: Resolved
Paused: Paused
classDef active fill:#00C853,stroke:#00B248,stroke-width:4px,color:white,rx:15px,ry:15px
classDef triggered fill:#FF3D00,stroke:#DD2C00,stroke-width:4px,color:white,rx:15px,ry:15px
classDef resolved fill:#2962FF,stroke:#2979FF,stroke-width:4px,color:white,rx:15px,ry:15px
classDef paused fill:#FFB300,stroke:#FFA000,stroke-width:4px,color:white,rx:15px,ry:15px
class Active active
class Triggered triggered
class Resolved resolved
class Paused paused
Active --> Triggered: Current bucket crosses
critical threshold
relative to baseline
(sets new baseline)
Triggered --> Resolved: Resolve manually
Triggered --> Resolved: Current bucket within
resolution threshold
relative to baseline
Resolved --> Active: Stays within
resolution threshold
relative to baseline
Active --> Paused: Pause
Paused --> Active: Resume
```
Alerts automatically transition between states based on metric values and can be manually paused/resumed as needed. The state transitions are evaluated for each time bucket (hourly, daily, weekly, or monthly).
### Alert Actions
**Pause an Alert**
* Temporarily stop monitoring (useful during maintenance)
* No threshold checks or notifications until resumed
* Keeps all configuration for easy restart
**Mute an Alert**
* Continue monitoring but silence notifications
* Alert still evaluates and tracks state changes
* Perfect when you're already aware of an ongoing issue
**Resolve an Alert**
* Manually clear a triggered alert
* Moves back to active monitoring immediately
* Sends resolution notification to keep team informed
**Delete an Alert**
* Permanently remove the alert and all its history
* Cannot be undone - use carefully
* Clean up alerts that are no longer relevant
## Investigating Triggered Alerts
When an alert triggers, you'll receive a notification with:
* The actual metric value that caused the trigger
* A direct link to the alert investigation page
* Context about when the threshold was crossed
The alert page provides:
* **Real-time chart**: Visual trend showing how the metric changed over time
* **Triggering events**: Sample events that contributed to the alert
* **Historical context**: Previous triggers and patterns
* **Quick actions**: Resolve, mute, or escalate the alert
## Common Alert Patterns
**Error Rate Monitoring**
* Monitor when error rates spike above normal levels
* Set up both absolute thresholds (>5%) and drift detection (50% increase)
**Performance SLA Monitoring**
* Track P95 latency to ensure user experience remains smooth
* Alert when response times exceed acceptable limits
**Cost Control**
* Monitor daily API spend to prevent budget overruns
* Set both warning and critical thresholds
**Quality Assurance**
* Track evaluation scores to catch model performance degradation
* Alert on safety violations or content quality issues
## Tips for Effective Alerting
1. **Start with critical metrics**: Focus on what directly impacts users first
2. **Avoid alert fatigue**: Set appropriate thresholds that indicate real problems
3. **Use both types**: Combine absolute thresholds with drift detection for comprehensive coverage
4. **Test your alerts**: Verify they trigger correctly and provide actionable information
5. **Review regularly**: Adjust thresholds as your application evolves
## Next Steps
Ready to set up Alerts for your application? See [Creating Alerts](/v2/monitoring/alerts/alerts) to build your first alert.
Having trouble or want to request additional notification channels? Reach out to us at [support@honeyhive.ai](mailto:support@honeyhive.ai).