> ## Documentation Index
> Fetch the complete documentation index at: https://docs.honeyhive.ai/llms.txt
> Use this file to discover all available pages before exploring further.
# Online Evaluations
> Configure HoneyHive online evaluations to score production traces automatically with code or LLM judges and surface quality drift on your dashboard.
Online evaluations run your [evaluators](/v2/evaluators/introduction) automatically on ingested traces. This gives you continuous quality scores alongside your cost and latency metrics, without adding latency to your application.
## How It Works
When you enable an evaluator, HoneyHive runs it asynchronously on incoming traces:
1. Your application sends traces to HoneyHive
2. HoneyHive matches traces against your evaluator's [event filters](#event-filters)
3. Matching events are evaluated (subject to your [sampling rate](#sampling))
4. Results appear as metrics in your [dashboard](/v2/monitoring/charts) and on individual traces
Online evaluations run on all ingested traces that match your evaluator's event filters, including both production and experiment traces.
## Enabling Online Evaluation
You can enable online evaluation on any server-side evaluator (Python or LLM):
Navigate to the [**Evaluators**](https://app.us.honeyhive.ai/metrics) tab in HoneyHive.
Create a new [Python](/v2/evaluators/python) or [LLM](/v2/evaluators/llm) evaluator, select an existing one, or start from a [ready-made template](/v2/evaluators/evaluator-templates). For multi-turn agents, try the [conversation evaluator templates](/v2/evaluators/evaluator-templates#conversation-evaluator-templates). Configure event filters, return type, and evaluation logic.
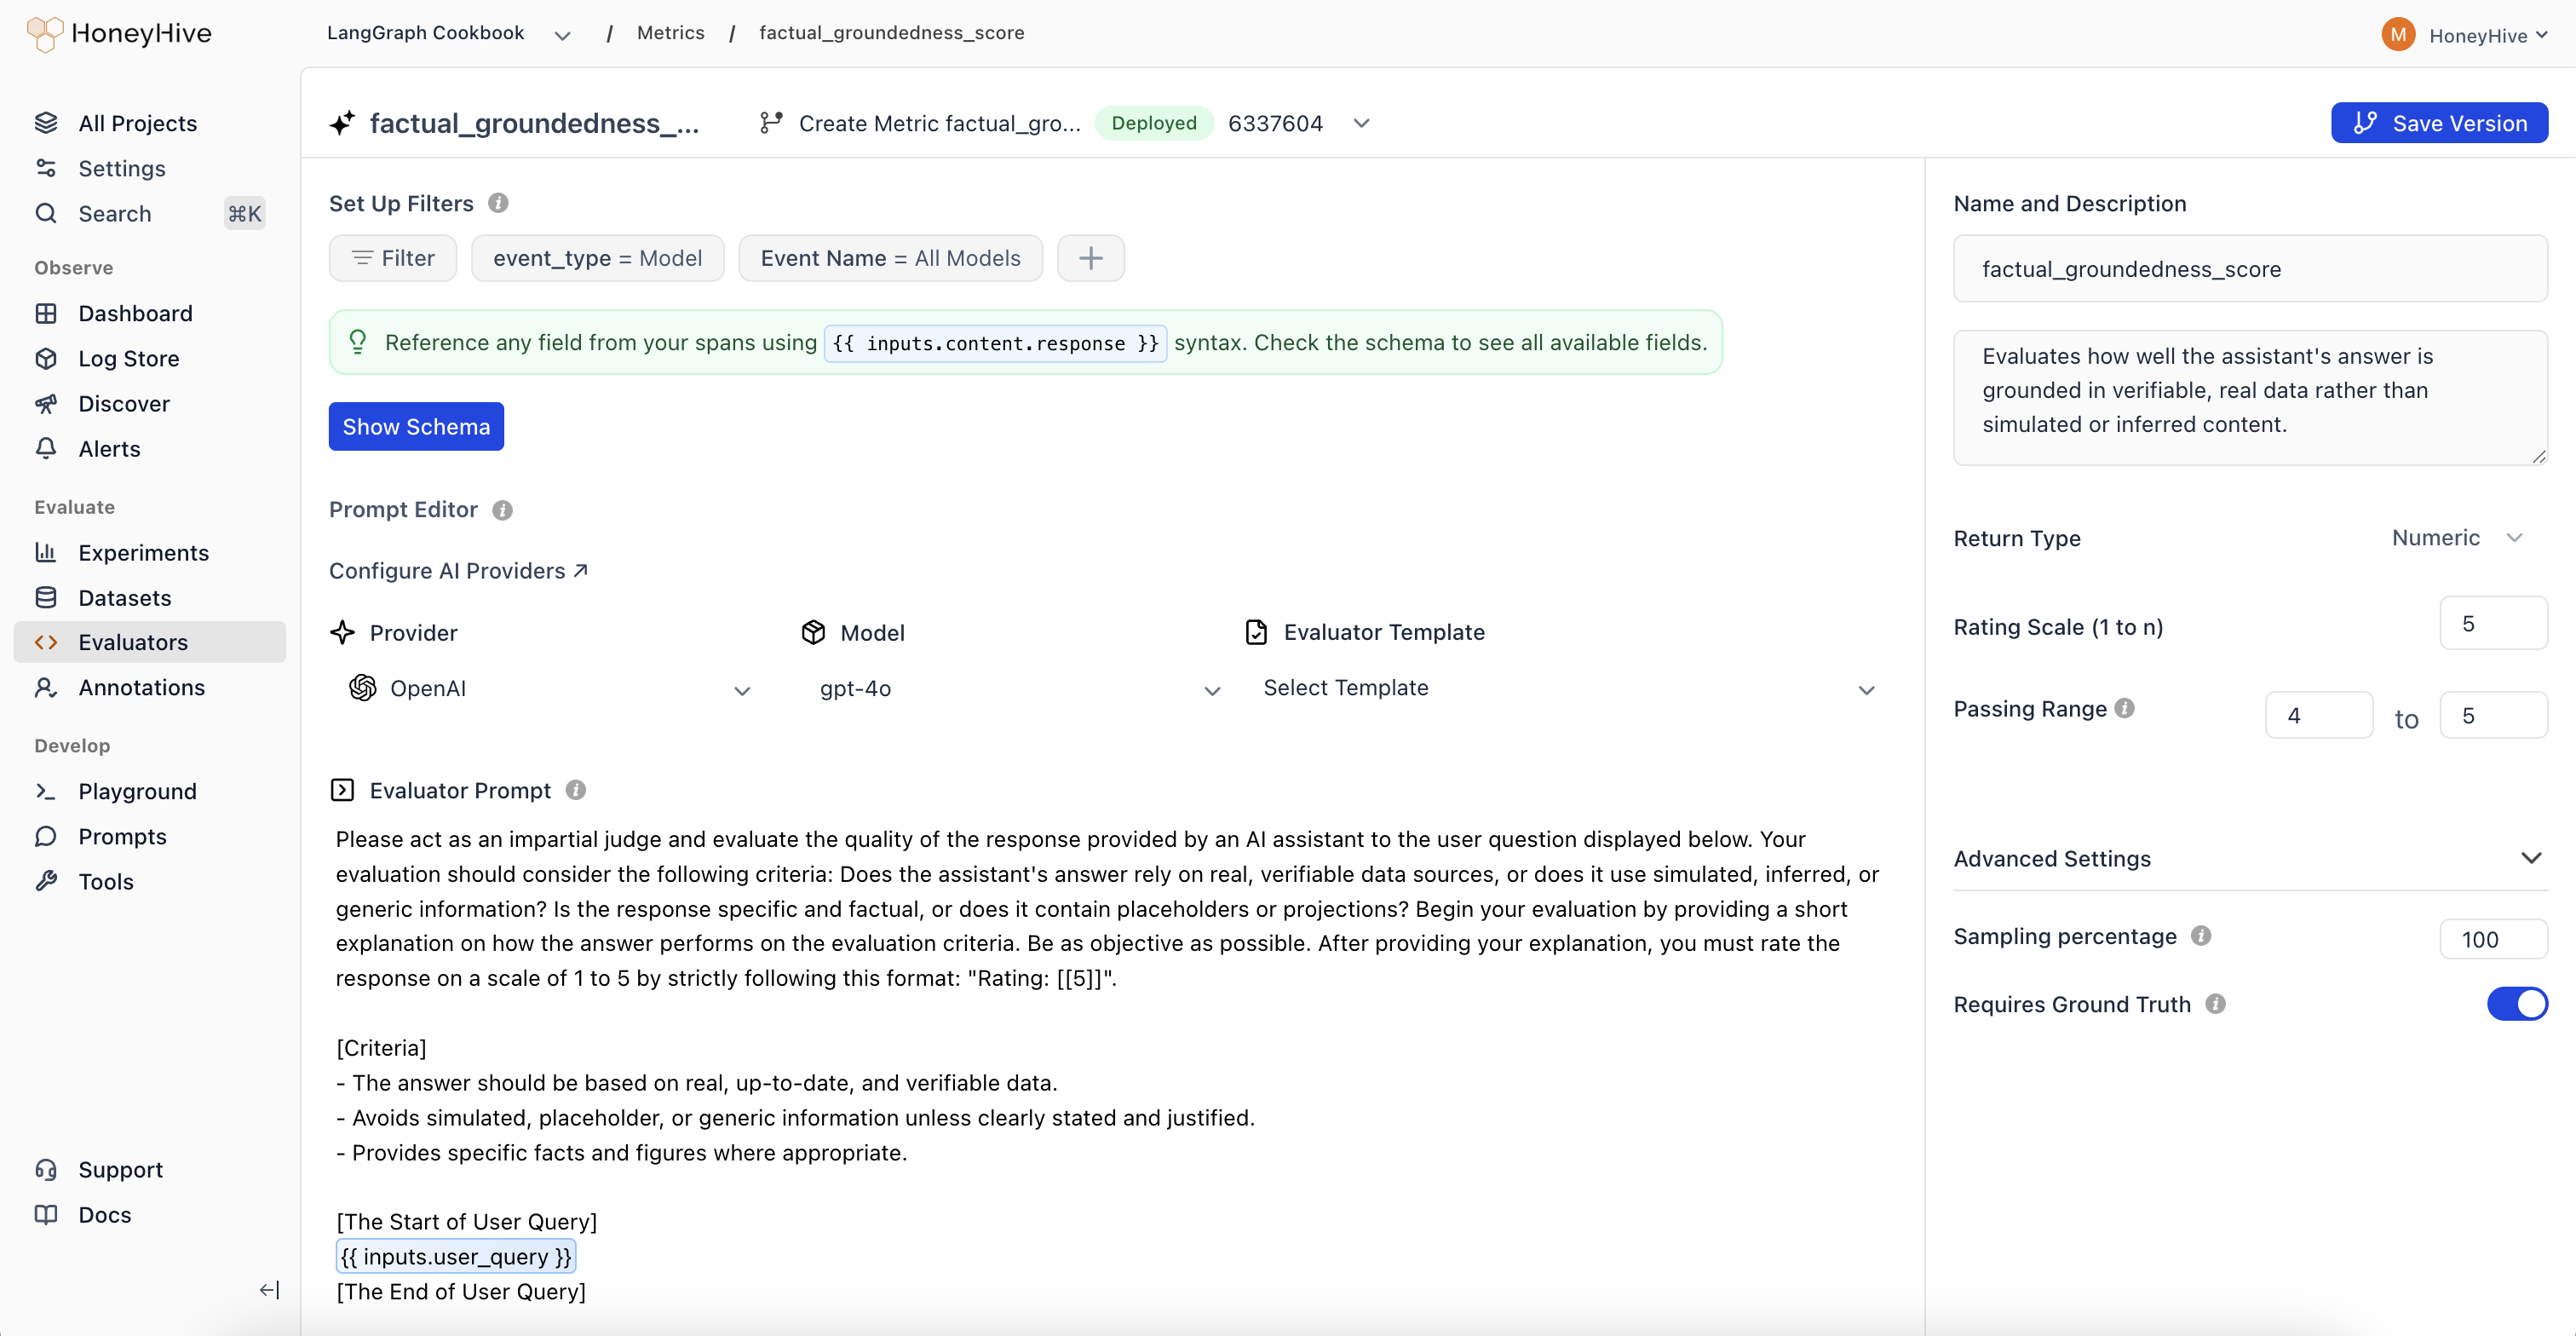 Toggle the **Enabled** switch in the evaluators table. This tells HoneyHive to run this evaluator on all matching traces.
Set the **Sampling percentage** to control what fraction of matching events get evaluated (e.g., 25%). This controls cost for LLM-based evaluators at high volumes.
## Event Filters
Each evaluator has event filters that determine which traces it runs on. You can filter by event type, event name, and any event property from your schema. For example, you might run a hallucination evaluator only on `model` events named `generate_response`, or add a filter like `metadata.environment is production` to limit evaluation to specific contexts.
See [Event Filters](/v2/evaluators/llm#event-filters) for the full list of supported filter options and operators (which vary by field type).
## Sampling
LLM-based evaluators incur model costs for every evaluation. At production scale, use sampling to control spend:
| Volume | Suggested Sampling | Rationale |
| ------------------- | ------------------ | ---------------------------------------------- |
| \< 1K events/day | 100% | Full coverage is affordable |
| 1K - 10K events/day | 25 - 50% | Good signal with moderate cost |
| 10K+ events/day | 5 - 25% | Statistical significance with controlled spend |
Python evaluators are much cheaper to run than LLM evaluators. You can often run Python evaluators at 100% sampling even at high volumes.
## Viewing Results
Online evaluation results are available in two places:
* **Dashboard charts**: Select your evaluator as a metric in [Custom Charts](/v2/monitoring/charts) to track quality over time, group by properties, and set up [alerts](/v2/monitoring/alerts/alerts_overview)
* **Individual traces**: Each evaluated trace shows its evaluator scores alongside inputs, outputs, and other metadata
Toggle the **Enabled** switch in the evaluators table. This tells HoneyHive to run this evaluator on all matching traces.
Set the **Sampling percentage** to control what fraction of matching events get evaluated (e.g., 25%). This controls cost for LLM-based evaluators at high volumes.
## Event Filters
Each evaluator has event filters that determine which traces it runs on. You can filter by event type, event name, and any event property from your schema. For example, you might run a hallucination evaluator only on `model` events named `generate_response`, or add a filter like `metadata.environment is production` to limit evaluation to specific contexts.
See [Event Filters](/v2/evaluators/llm#event-filters) for the full list of supported filter options and operators (which vary by field type).
## Sampling
LLM-based evaluators incur model costs for every evaluation. At production scale, use sampling to control spend:
| Volume | Suggested Sampling | Rationale |
| ------------------- | ------------------ | ---------------------------------------------- |
| \< 1K events/day | 100% | Full coverage is affordable |
| 1K - 10K events/day | 25 - 50% | Good signal with moderate cost |
| 10K+ events/day | 5 - 25% | Statistical significance with controlled spend |
Python evaluators are much cheaper to run than LLM evaluators. You can often run Python evaluators at 100% sampling even at high volumes.
## Viewing Results
Online evaluation results are available in two places:
* **Dashboard charts**: Select your evaluator as a metric in [Custom Charts](/v2/monitoring/charts) to track quality over time, group by properties, and set up [alerts](/v2/monitoring/alerts/alerts_overview)
* **Individual traces**: Each evaluated trace shows its evaluator scores alongside inputs, outputs, and other metadata
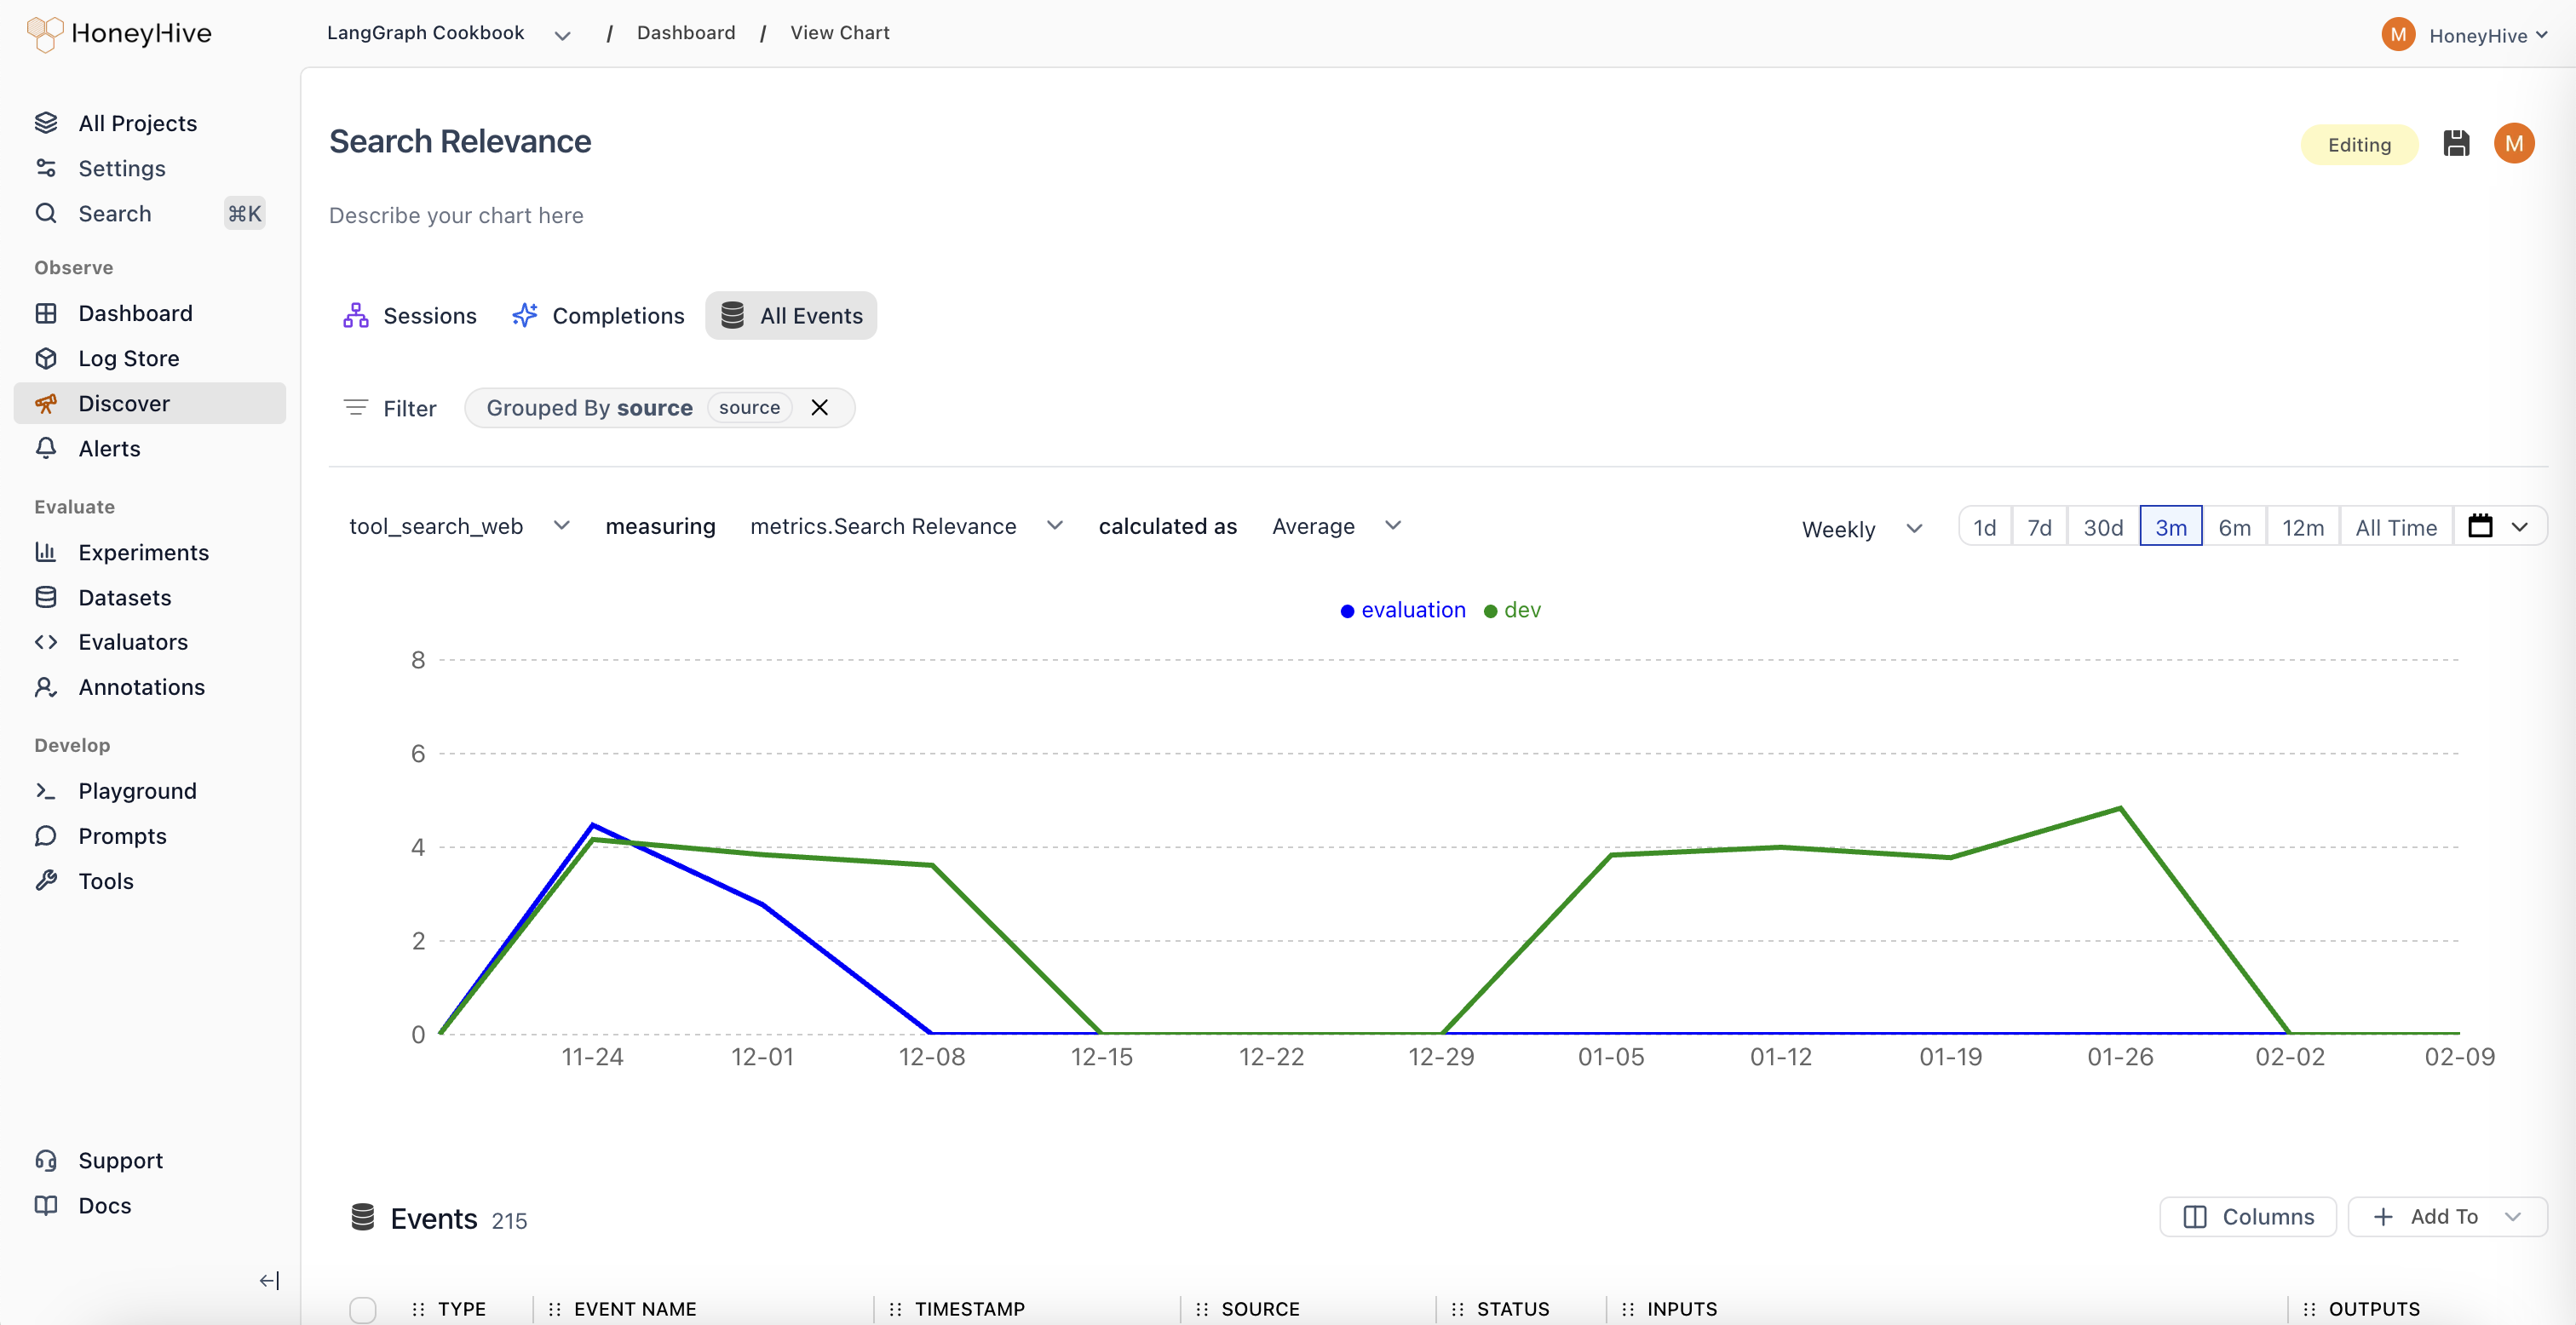
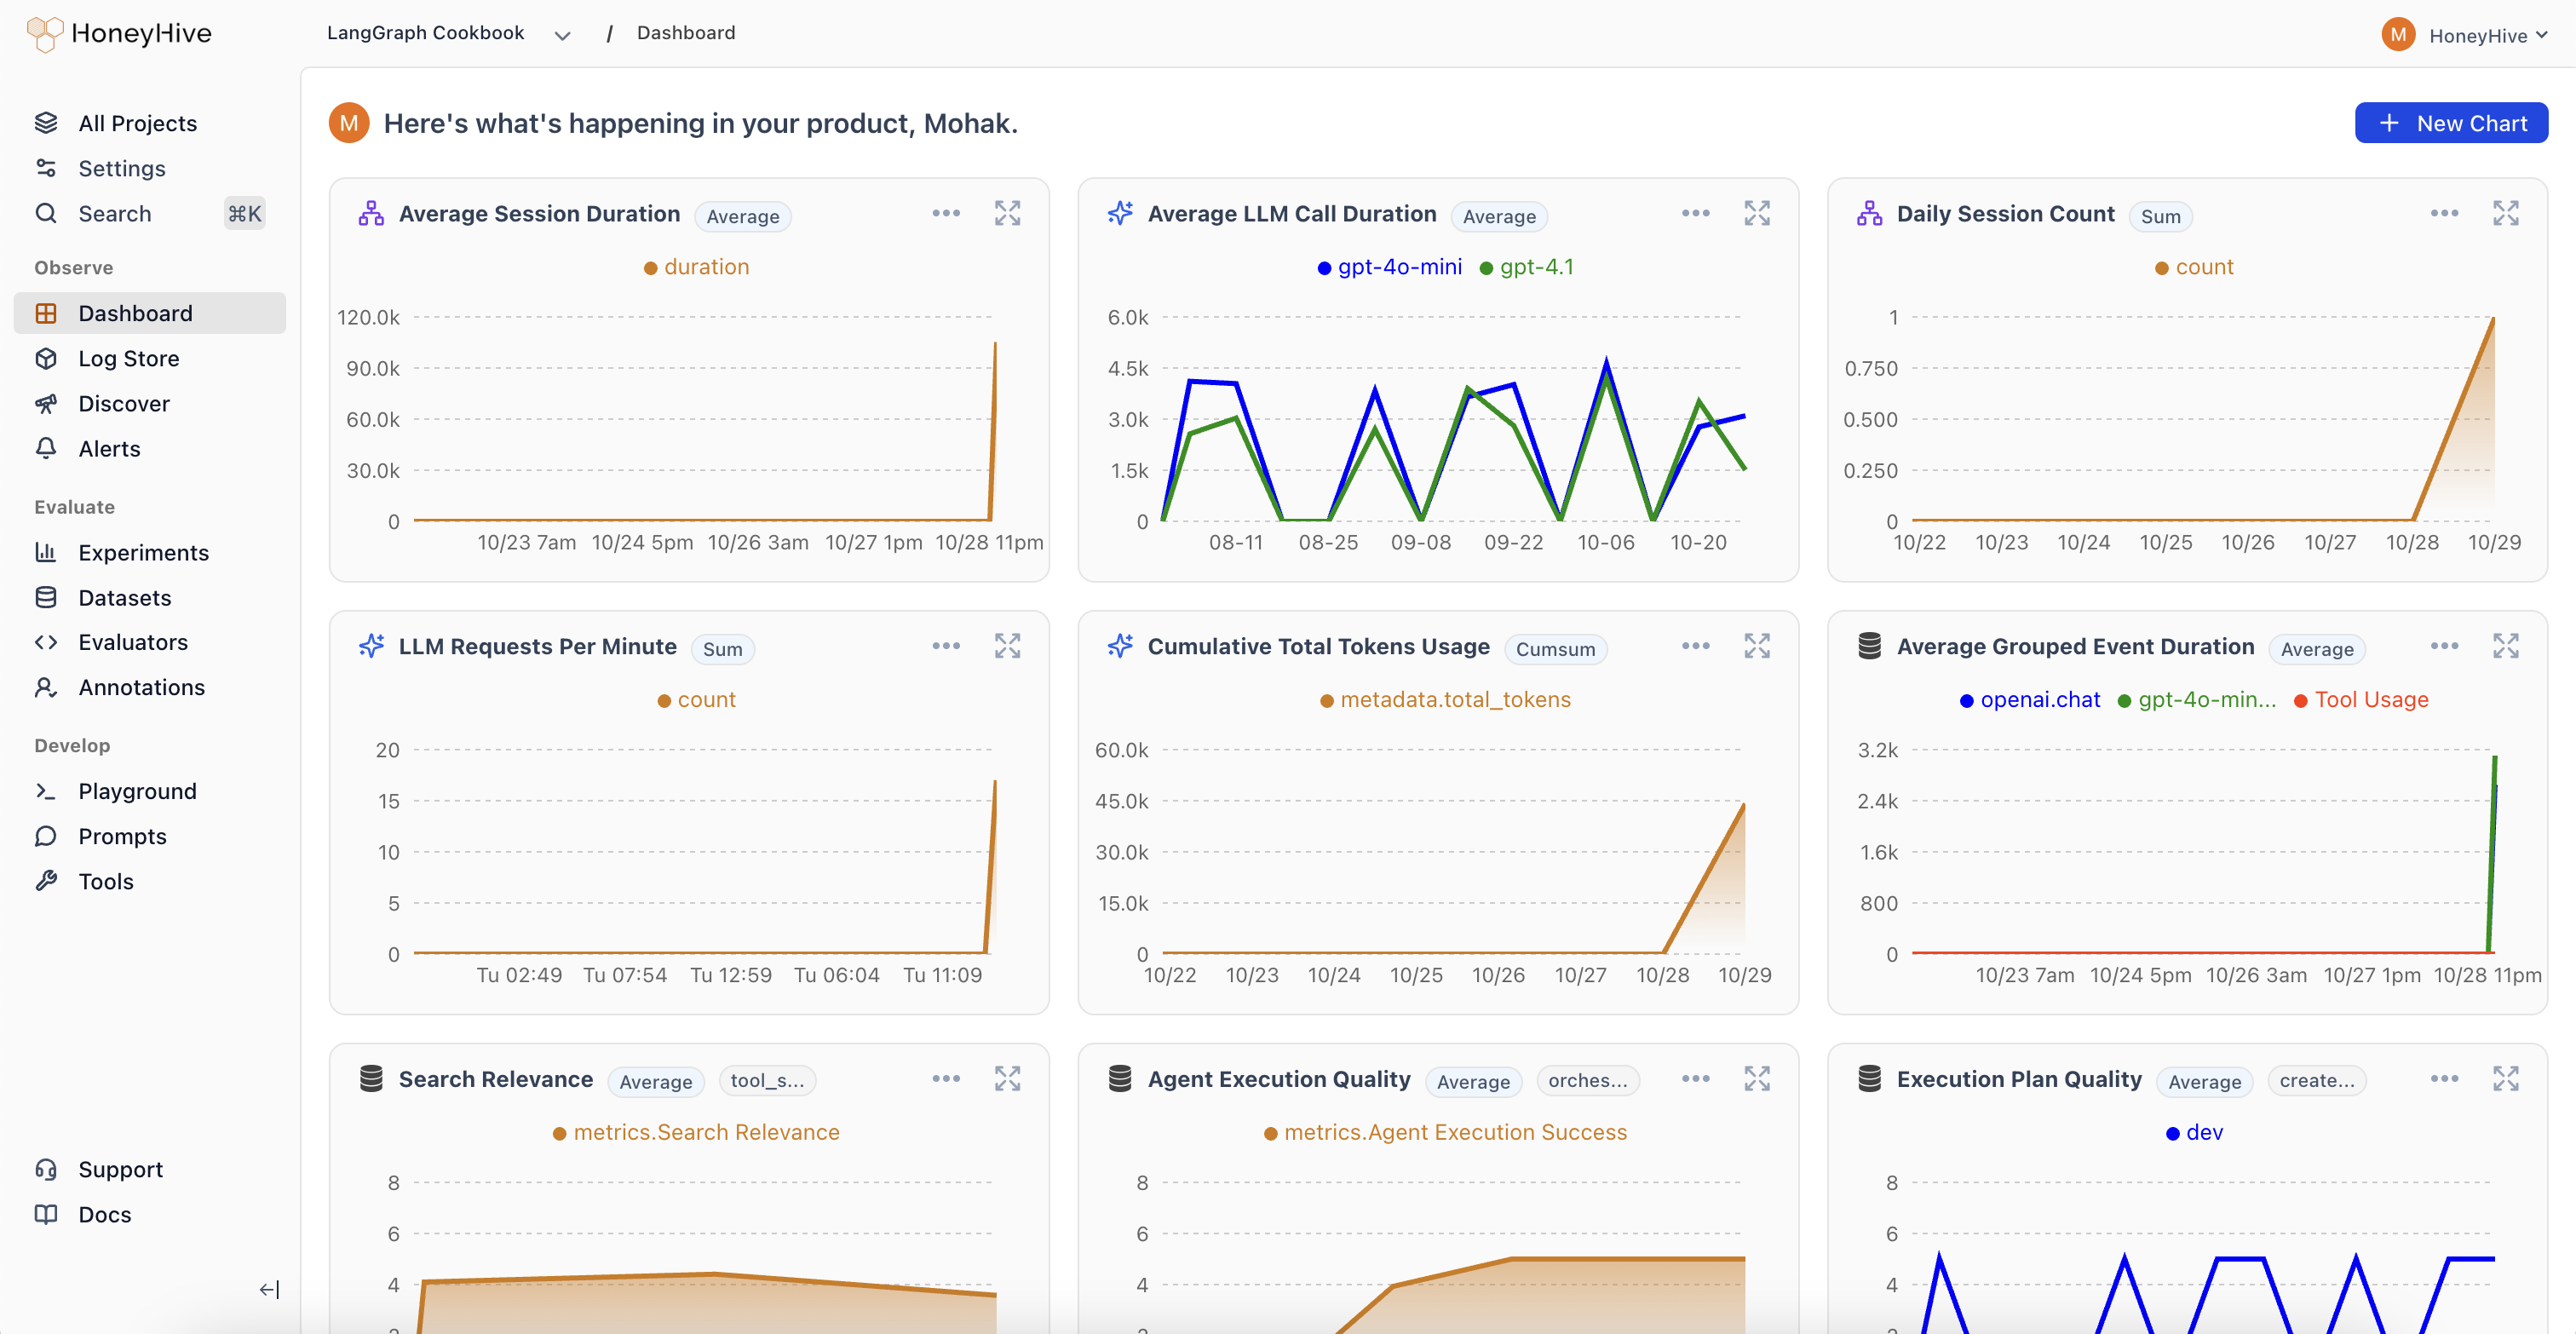 You can also use the Discover view to build custom queries on evaluator scores, filter by source, and drill into individual events.
 ## Choosing Between Client-Side and Server-Side
| | Client-Side | Server-Side (Online) |
| ------------------ | ---------------------------------------- | ------------------------------------- |
| **Runs** | In your application | On HoneyHive after ingestion |
| **Latency impact** | Adds to request time | None |
| **Best for** | Guardrails, format checks, PII detection | LLM-as-judge, complex quality scoring |
| **Managed in** | Your code | HoneyHive UI |
Use [client-side evaluators](/v2/evaluators/client_side) for checks that need to happen during execution (guardrails, blocking unsafe responses). Use online evaluations for quality scoring that can happen asynchronously.
## Troubleshooting
### Evaluator not running on expected events
* **Check event filters**: Verify the evaluator's event type and event name filters match your traces. Filters are AND-ed, so all conditions must match.
* **Check enabled status**: The evaluator must be toggled **Enabled** in the evaluators table.
* **Check sampling**: At low sampling percentages, some matching events are intentionally skipped. Increase sampling to verify the evaluator works, then reduce.
* **Check event properties**: Property-based filters use dot-path matching (e.g. `metadata.environment`). Verify the property exists on your events and the value matches.
### Evaluator was auto-disabled
If an evaluator fails 100+ times within 1 hour, HoneyHive automatically disables it and creates a version snapshot. This prevents a broken evaluator from consuming resources across all your traces.
To recover:
1. Go to the **Evaluators** table and find the disabled evaluator
2. Check the error by running the evaluator manually against a sample event
3. Fix the evaluation logic
4. Re-enable the evaluator
### Results not appearing on traces
* Evaluations run asynchronously after ingestion. There is a short delay before scores appear.
* Check the evaluator's return type matches your expected output (boolean, numeric, or string).
## Next Steps
Create code-based evaluators for programmatic checks
Use LLMs to score quality, relevance, and tone
Start from ready-made Python, LLM, and conversation templates
Visualize evaluator scores in dashboards
Get notified when quality metrics drop
## Choosing Between Client-Side and Server-Side
| | Client-Side | Server-Side (Online) |
| ------------------ | ---------------------------------------- | ------------------------------------- |
| **Runs** | In your application | On HoneyHive after ingestion |
| **Latency impact** | Adds to request time | None |
| **Best for** | Guardrails, format checks, PII detection | LLM-as-judge, complex quality scoring |
| **Managed in** | Your code | HoneyHive UI |
Use [client-side evaluators](/v2/evaluators/client_side) for checks that need to happen during execution (guardrails, blocking unsafe responses). Use online evaluations for quality scoring that can happen asynchronously.
## Troubleshooting
### Evaluator not running on expected events
* **Check event filters**: Verify the evaluator's event type and event name filters match your traces. Filters are AND-ed, so all conditions must match.
* **Check enabled status**: The evaluator must be toggled **Enabled** in the evaluators table.
* **Check sampling**: At low sampling percentages, some matching events are intentionally skipped. Increase sampling to verify the evaluator works, then reduce.
* **Check event properties**: Property-based filters use dot-path matching (e.g. `metadata.environment`). Verify the property exists on your events and the value matches.
### Evaluator was auto-disabled
If an evaluator fails 100+ times within 1 hour, HoneyHive automatically disables it and creates a version snapshot. This prevents a broken evaluator from consuming resources across all your traces.
To recover:
1. Go to the **Evaluators** table and find the disabled evaluator
2. Check the error by running the evaluator manually against a sample event
3. Fix the evaluation logic
4. Re-enable the evaluator
### Results not appearing on traces
* Evaluations run asynchronously after ingestion. There is a short delay before scores appear.
* Check the evaluator's return type matches your expected output (boolean, numeric, or string).
## Next Steps
Create code-based evaluators for programmatic checks
Use LLMs to score quality, relevance, and tone
Start from ready-made Python, LLM, and conversation templates
Visualize evaluator scores in dashboards
Get notified when quality metrics drop