> ## Documentation Index
> Fetch the complete documentation index at: https://docs.honeyhive.ai/llms.txt
> Use this file to discover all available pages before exploring further.
# Monitor AI Application Performance in HoneyHive
> Track cost, latency, token usage, and evaluator scores in HoneyHive's monitoring dashboard to detect failures and quality drift in production.
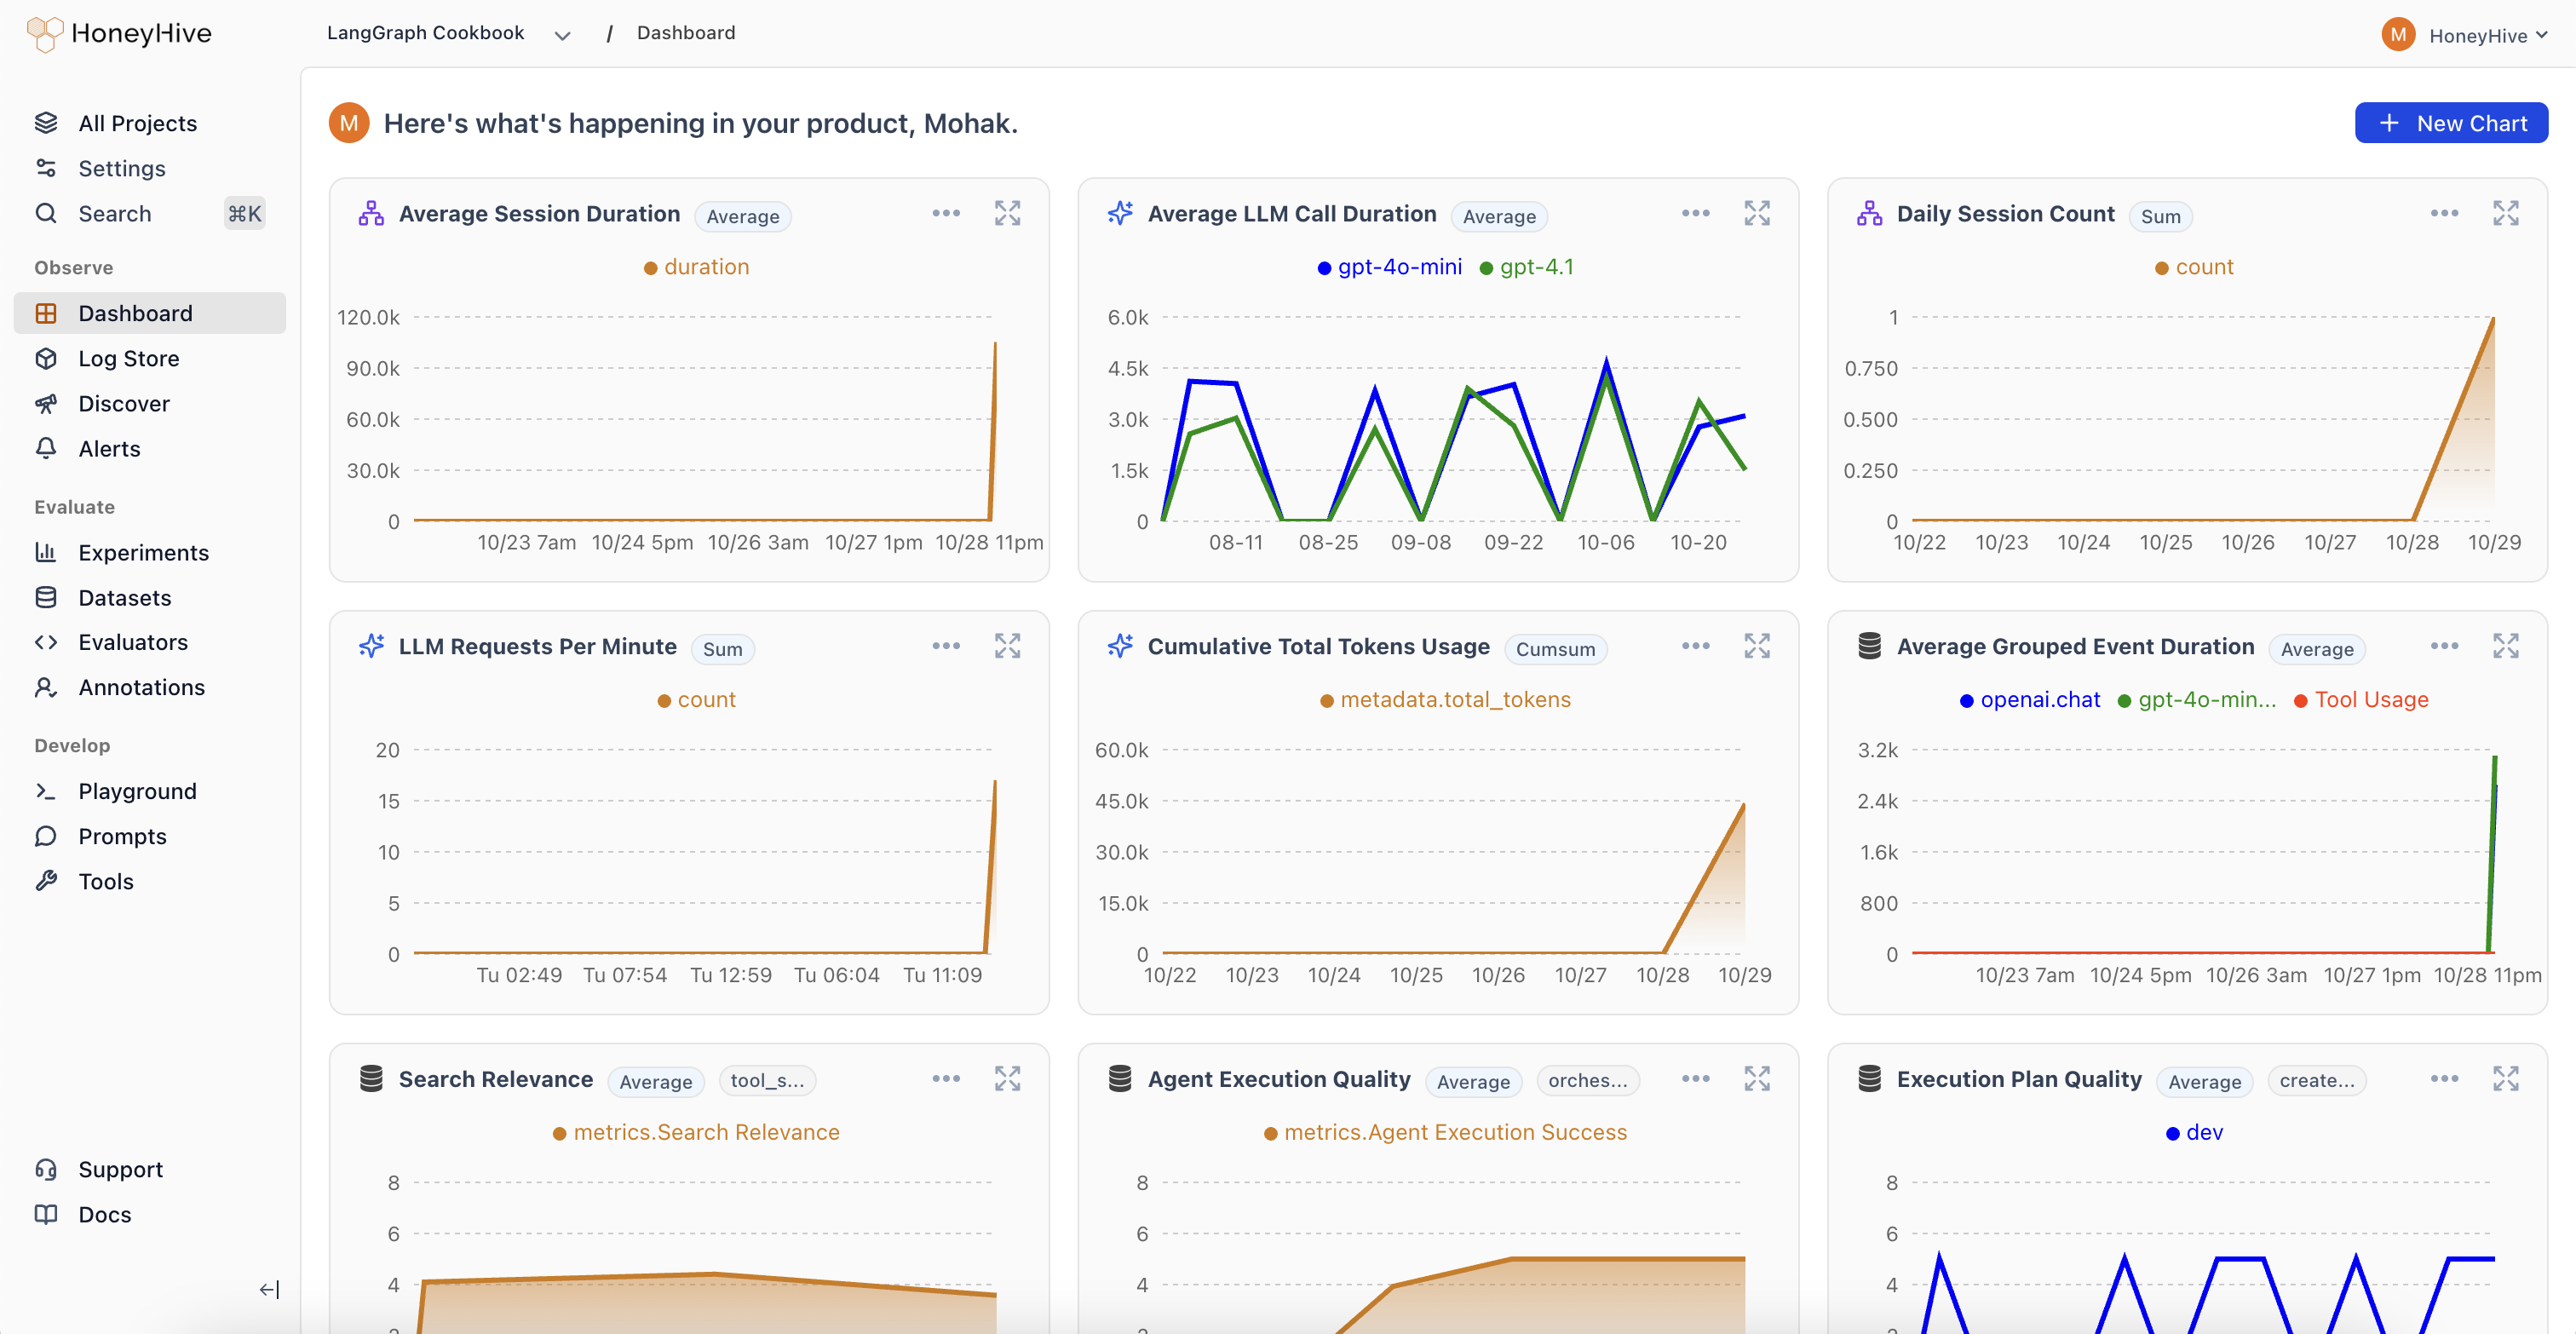
The HoneyHive monitoring dashboard aggregates production traces, evaluations, and user feedback so you can track cost, latency, and quality in one place. Build [custom charts](/v2/monitoring/charts) to explore trends, configure [online evaluations](/v2/monitoring/onlineevals) to score live traffic, and set [alerts](/v2/monitoring/alerts/alerts_overview) before issues reach users.
 ## How does the monitoring dashboard work?
HoneyHive aggregates all your production data (traces, evaluations, and user feedback) in one place. This unified view lets you:
* **Detect Failures:** Catch anomalies across your cost, usage, and quality metrics.
* **Set Up Proactive Monitoring:** Create automated alerts to notify you when metrics exceed thresholds or drift from expected values.
* **Form Hypotheses:** "I think response quality drops for after 5 agent actions." "Our new RAG might be causing unintended hallucinations."
* **Explore Your Data:** Craft queries to validate or refute these hypotheses in real-time.
* **Iterate Continuously:** Use insights to tweak prompts, swap models, or refine pipelines, then immediately see the impact.
## Where should you start with monitoring?
Build custom queries and save charts to your project dashboard
Configure automated evaluations to run on your production traces
Set up automated alerts to catch issues before they impact users
## How does the monitoring dashboard work?
HoneyHive aggregates all your production data (traces, evaluations, and user feedback) in one place. This unified view lets you:
* **Detect Failures:** Catch anomalies across your cost, usage, and quality metrics.
* **Set Up Proactive Monitoring:** Create automated alerts to notify you when metrics exceed thresholds or drift from expected values.
* **Form Hypotheses:** "I think response quality drops for after 5 agent actions." "Our new RAG might be causing unintended hallucinations."
* **Explore Your Data:** Craft queries to validate or refute these hypotheses in real-time.
* **Iterate Continuously:** Use insights to tweak prompts, swap models, or refine pipelines, then immediately see the impact.
## Where should you start with monitoring?
Build custom queries and save charts to your project dashboard
Configure automated evaluations to run on your production traces
Set up automated alerts to catch issues before they impact users