> ## Documentation Index
> Fetch the complete documentation index at: https://docs.honeyhive.ai/llms.txt
> Use this file to discover all available pages before exploring further.
# HoneyHive Tracing Concepts
> Learn HoneyHive's tracing data model: sessions, events, wide-event schema, and OpenTelemetry architecture for AI application observability.
HoneyHive organizes trace data as a tree of **events** grouped into **sessions**, using a wide-event model where each record carries inputs, outputs, timing, metrics, and errors in one place. After this overview, use [enrich traces](/v2/tracing/enrich-traces) to add custom context and [tracer initialization](/v2/tracing/tracer-initialization) to wire tracing into your runtime.
## What are sessions and events in HoneyHive?
The base unit of data in HoneyHive is an **event**. HoneyHive uses a "wide-event" data model, where every event carries its full context in a single record: inputs, outputs, timing, metrics, metadata, feedback, and errors. Unlike the traditional three-pillar approach (separate stores for traces, logs, and metrics joined at query time), all data for a given operation lives on one record. There is no separate log or metrics pipeline to correlate.
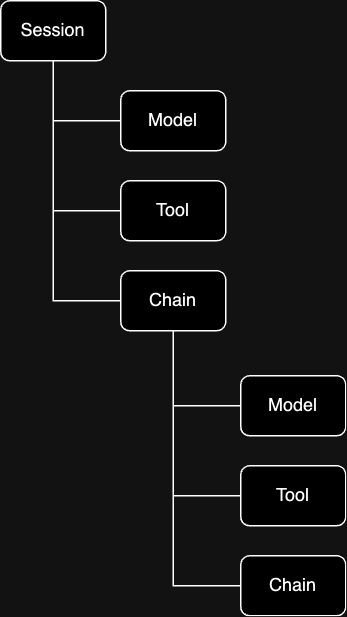
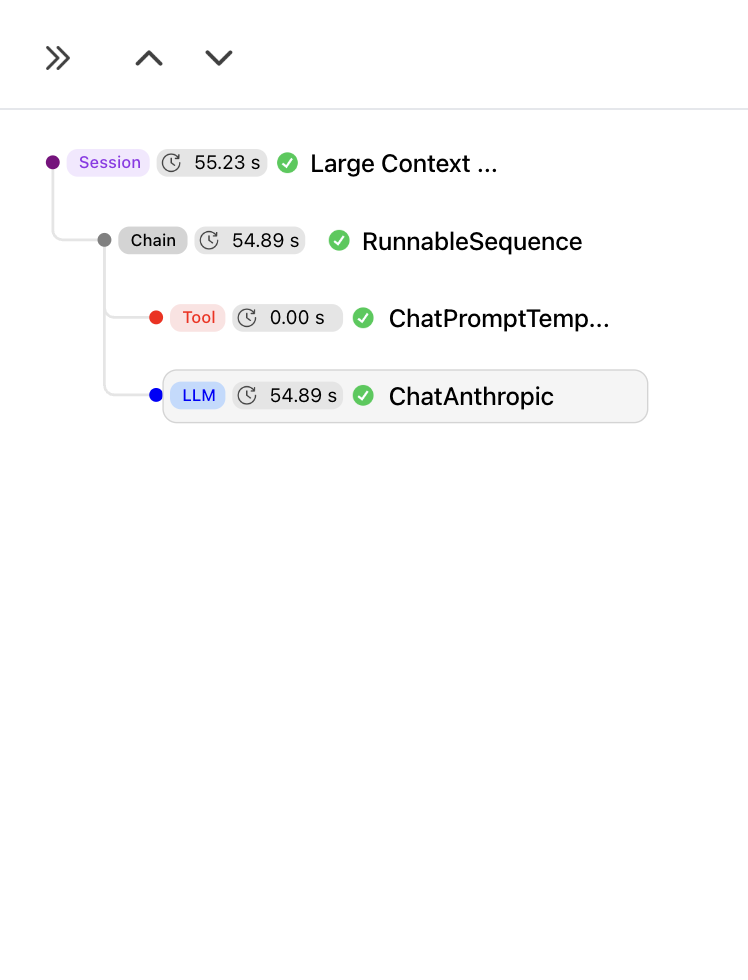
Events form a hierarchical tree:
 ```text theme={null}
customer_support_session # event_type: session (root)
├── validate_input # event_type: tool
├── retrieve_context # event_type: tool
├── llm_completion # event_type: model
│ ├── prompt_preparation
│ └── api_call
└── format_response # event_type: chain
```
### Sessions
The root of every tree is a **session**. A session is itself an event with `event_type: "session"`. It shares the same schema as every other event (inputs, outputs, metrics, etc.), but serves a specific role: it carries a `session_id` that all child events share to belong to the same trace.
Sessions can be single-turn or multi-turn. A single-turn session groups the events from one request. A multi-turn session groups events across an entire conversation. We chose "session" over "trace" for this reason: in traditional distributed tracing, one inbound request equals one trace, and correlating multiple requests into a conversation requires external tooling. In HoneyHive, a session is the correlation unit, and it handles both cases natively.
If you're coming from APM tools (Datadog, Jaeger, etc.): a session is equivalent to a trace, and an event is equivalent to a span. If you're coming from LangSmith or LangFuse: the concepts map to runs/traces/spans.
### Events
Child events represent discrete operations. Each has an `event_type` that determines what it represents:
| `event_type` | What it represents | Examples |
| ------------ | ------------------------------------ | -------------------------------------------------- |
| **`model`** | An LLM API request | GPT-4 completion, Claude message |
| **`tool`** | An external service or function call | Vector DB search, API call, database query |
| **`chain`** | A logical grouping of child events | RAG pipeline, agent workflow, multi-step reasoning |
Events nest via `parent_id`. A `chain` event can contain `model` and `tool` children, and chains can nest inside other chains. This lets you represent arbitrarily complex execution graphs.
### Event Schema
All event types (including sessions) share the same schema:
| Field | Description |
| ------------------------- | ---------------------------------------------------------------------------- |
| `event_id` | Unique identifier (UUID) |
| `session_id` | Shared identifier that groups all events in the same trace |
| `parent_id` | Links child to parent event (`null` for the session) |
| `event_type` | `"session"`, `"model"`, `"tool"`, or `"chain"` |
| `event_name` | Human-readable operation name |
| `start_time` / `end_time` | Timestamps |
| `duration_ms` | Execution time in milliseconds |
| `inputs` | Input data (messages, parameters) |
| `outputs` | Output data (responses, results) |
| `config` | Configuration (model hyperparameters, prompt template, version, git context) |
| `metadata` | Custom key-value pairs |
| `metrics` | Numeric measurements (latency, tokens, cost) |
| `feedback` | User ratings, corrections |
| `error` | Error details if failed |
```json theme={null}
{
"event_id": "fead4996-5bec-4710-bc71-c1f97d311782",
"session_id": "397c9cbc-297f-42e9-bc1d-b2b0db850df5",
"parent_id": "397c9cbc-297f-42e9-bc1d-b2b0db850df5",
"event_type": "model",
"event_name": "openai-chat-completion",
"start_time": 1710147521798,
"end_time": 1710147531367,
"duration": 9569,
"config": {
"model": "gpt-4o",
"provider": "openai",
"temperature": 0.7,
"max_tokens": 1024,
"template": [
{"role": "system", "content": "Answer using the provided context.\n\nContext: {{context}}"},
{"role": "user", "content": "{{question}}"}
]
},
"inputs": {
"messages": [
{"role": "system", "content": "Answer using the provided context.\n\nContext: ..."},
{"role": "user", "content": "How do I build an integration?"}
]
},
"outputs": {
"choices": [
{"message": {"role": "assistant", "content": "To build an integration, you need to..."}}
]
},
"metrics": {
"cost": 0.0048,
"tokens_per_second": 42.3
},
"metadata": {
"total_tokens": 305,
"prompt_tokens": 203,
"completion_tokens": 102
},
"feedback": {},
"error": null
}
```
For complete field types and per-event-type details, see the [Python SDK schema reference](https://honeyhiveai.github.io/python-sdk/reference/data-models/events.html).
***
## How do you enrich traces?
Events are automatically populated with inputs, outputs, timing, and instrumentor-specific metadata. You can enrich any event with additional context:
* **Config**: Model hyperparameters, prompt template, app version, git context, or any configuration that defines how the operation ran
* **Metadata**: Custom key-value pairs (user ID, environment, request ID, etc.)
* **Metrics**: Numeric scores from evaluators, custom KPIs, or business metrics
* **Feedback**: End-user ratings, corrections, or thumbs up/down signals
* **User properties**: User-level attributes (tier, tenant, country) for filtering and segmentation
Enrichments can be set from your application code at trace time, or added later via the API or UI. They apply to any event type, including the session itself.
How to add config, metadata, feedback, metrics, and user properties to events
***
## How does HoneyHive use OpenTelemetry?
HoneyHive is built on [OpenTelemetry](https://opentelemetry.io/) (OTel). The SDK wraps an OTel `TracerProvider` and exports spans via OTLP.
```mermaid theme={null}
graph TB
subgraph "Your Application"
A[Application Code] --> B[@trace Decorator]
B --> C[HoneyHive Tracer]
end
subgraph "HoneyHive SDK"
C --> D[OTel TracerProvider]
D --> E[Span Processor]
E --> F[OTLP Exporter]
end
subgraph "Backends"
F --> G[HoneyHive API]
F -.->|"Optional"| H[Existing OTel Backend]
end
```
This means:
* Any OTel-compatible instrumentor works with HoneyHive
* Traces follow W3C Trace Context and are portable to other backends
* You can export to HoneyHive and your existing backend simultaneously by adding multiple span processors
### How HoneyHive Captures Data
When your application runs, data flows through several layers before reaching the HoneyHive dashboard. Your code calls an LLM provider as usual. The instrumentor (e.g. OpenAI instrumentor) intercepts that call, records the request and response as OTel span attributes, and the HoneyHive exporter sends them to the API via OTLP when each span completes.
**Handling sensitive data:** Instrumentors capture full request and response payloads for your LLM calls, which can include PII (names, emails, phone numbers, and similar fields). Redact or mask sensitive values in your application code before data reaches the LLM call. For organizations with strict compliance requirements, HoneyHive also offers [self-hosted deployments](/v2/setup/self-hosted).
```mermaid theme={null}
sequenceDiagram
participant App as Your Application
participant SDK as HoneyHive SDK
participant Inst as Instrumentor
participant LLM as LLM Provider
participant OTEL as OpenTelemetry
participant Exp as HoneyHive Exporter
participant API as HoneyHive API
App->>SDK: @trace decorator creates span
SDK->>OTEL: Register span in TracerProvider
App->>LLM: LLM API call (e.g. openai.chat.completions.create)
Inst->>OTEL: Intercept call, start child span
LLM-->>Inst: API response
Inst->>OTEL: Record model, tokens, latency, messages
OTEL->>Exp: Span completed
Exp->>API: Send span via OTLP
API-->>Exp: Acknowledge
```
### Semantic Conventions
HoneyHive uses the official [OTel GenAI semantic conventions](https://opentelemetry.io/docs/specs/semconv/gen-ai/) as its primary standard for AI-specific attributes:
| Attribute | Description |
| -------------------------------- | ----------------------------------------------- |
| `gen_ai.system` | AI provider (`"openai"`, `"anthropic"`) |
| `gen_ai.model` | Model identifier (`"gpt-4"`, `"claude-3-opus"`) |
| `gen_ai.usage.prompt_tokens` | Input token count |
| `gen_ai.usage.completion_tokens` | Output token count |
HoneyHive also supports [OpenInference](https://github.com/Arize-ai/openinference) and [OpenLLMetry](https://github.com/traceloop/openllmetry) conventions, so instrumentors from either ecosystem work out of the box.
### BYOI: Bring Your Own Instrumentor
The HoneyHive SDK itself has zero dependencies on AI libraries. Instrumentors (the packages that know how to trace OpenAI, Anthropic, etc.) are installed separately. This means the core SDK never conflicts with your application's dependency versions, and you only install instrumentors for the providers you actually use. For setup, see the [Quickstart](/v2/introduction/tracing-quickstart) or individual [Integration Guides](/v2/integrations/openai).
### Context Propagation
Within a single process, trace context flows automatically. Child events created inside a traced function are linked to their parent without any manual wiring.
Across service boundaries, context propagates via W3C `traceparent` headers. The client injects trace context into outgoing HTTP headers; the server extracts it from incoming headers. All events on the server side then join the same session as the client.
```mermaid theme={null}
sequenceDiagram
participant Client as Client Request
participant Gateway as API Gateway
participant UserSvc as User Service
participant LLMSvc as LLM Service
Client->>Gateway: HTTP Request
```text theme={null}
customer_support_session # event_type: session (root)
├── validate_input # event_type: tool
├── retrieve_context # event_type: tool
├── llm_completion # event_type: model
│ ├── prompt_preparation
│ └── api_call
└── format_response # event_type: chain
```
### Sessions
The root of every tree is a **session**. A session is itself an event with `event_type: "session"`. It shares the same schema as every other event (inputs, outputs, metrics, etc.), but serves a specific role: it carries a `session_id` that all child events share to belong to the same trace.
Sessions can be single-turn or multi-turn. A single-turn session groups the events from one request. A multi-turn session groups events across an entire conversation. We chose "session" over "trace" for this reason: in traditional distributed tracing, one inbound request equals one trace, and correlating multiple requests into a conversation requires external tooling. In HoneyHive, a session is the correlation unit, and it handles both cases natively.
If you're coming from APM tools (Datadog, Jaeger, etc.): a session is equivalent to a trace, and an event is equivalent to a span. If you're coming from LangSmith or LangFuse: the concepts map to runs/traces/spans.
### Events
Child events represent discrete operations. Each has an `event_type` that determines what it represents:
| `event_type` | What it represents | Examples |
| ------------ | ------------------------------------ | -------------------------------------------------- |
| **`model`** | An LLM API request | GPT-4 completion, Claude message |
| **`tool`** | An external service or function call | Vector DB search, API call, database query |
| **`chain`** | A logical grouping of child events | RAG pipeline, agent workflow, multi-step reasoning |
Events nest via `parent_id`. A `chain` event can contain `model` and `tool` children, and chains can nest inside other chains. This lets you represent arbitrarily complex execution graphs.
### Event Schema
All event types (including sessions) share the same schema:
| Field | Description |
| ------------------------- | ---------------------------------------------------------------------------- |
| `event_id` | Unique identifier (UUID) |
| `session_id` | Shared identifier that groups all events in the same trace |
| `parent_id` | Links child to parent event (`null` for the session) |
| `event_type` | `"session"`, `"model"`, `"tool"`, or `"chain"` |
| `event_name` | Human-readable operation name |
| `start_time` / `end_time` | Timestamps |
| `duration_ms` | Execution time in milliseconds |
| `inputs` | Input data (messages, parameters) |
| `outputs` | Output data (responses, results) |
| `config` | Configuration (model hyperparameters, prompt template, version, git context) |
| `metadata` | Custom key-value pairs |
| `metrics` | Numeric measurements (latency, tokens, cost) |
| `feedback` | User ratings, corrections |
| `error` | Error details if failed |
```json theme={null}
{
"event_id": "fead4996-5bec-4710-bc71-c1f97d311782",
"session_id": "397c9cbc-297f-42e9-bc1d-b2b0db850df5",
"parent_id": "397c9cbc-297f-42e9-bc1d-b2b0db850df5",
"event_type": "model",
"event_name": "openai-chat-completion",
"start_time": 1710147521798,
"end_time": 1710147531367,
"duration": 9569,
"config": {
"model": "gpt-4o",
"provider": "openai",
"temperature": 0.7,
"max_tokens": 1024,
"template": [
{"role": "system", "content": "Answer using the provided context.\n\nContext: {{context}}"},
{"role": "user", "content": "{{question}}"}
]
},
"inputs": {
"messages": [
{"role": "system", "content": "Answer using the provided context.\n\nContext: ..."},
{"role": "user", "content": "How do I build an integration?"}
]
},
"outputs": {
"choices": [
{"message": {"role": "assistant", "content": "To build an integration, you need to..."}}
]
},
"metrics": {
"cost": 0.0048,
"tokens_per_second": 42.3
},
"metadata": {
"total_tokens": 305,
"prompt_tokens": 203,
"completion_tokens": 102
},
"feedback": {},
"error": null
}
```
For complete field types and per-event-type details, see the [Python SDK schema reference](https://honeyhiveai.github.io/python-sdk/reference/data-models/events.html).
***
## How do you enrich traces?
Events are automatically populated with inputs, outputs, timing, and instrumentor-specific metadata. You can enrich any event with additional context:
* **Config**: Model hyperparameters, prompt template, app version, git context, or any configuration that defines how the operation ran
* **Metadata**: Custom key-value pairs (user ID, environment, request ID, etc.)
* **Metrics**: Numeric scores from evaluators, custom KPIs, or business metrics
* **Feedback**: End-user ratings, corrections, or thumbs up/down signals
* **User properties**: User-level attributes (tier, tenant, country) for filtering and segmentation
Enrichments can be set from your application code at trace time, or added later via the API or UI. They apply to any event type, including the session itself.
How to add config, metadata, feedback, metrics, and user properties to events
***
## How does HoneyHive use OpenTelemetry?
HoneyHive is built on [OpenTelemetry](https://opentelemetry.io/) (OTel). The SDK wraps an OTel `TracerProvider` and exports spans via OTLP.
```mermaid theme={null}
graph TB
subgraph "Your Application"
A[Application Code] --> B[@trace Decorator]
B --> C[HoneyHive Tracer]
end
subgraph "HoneyHive SDK"
C --> D[OTel TracerProvider]
D --> E[Span Processor]
E --> F[OTLP Exporter]
end
subgraph "Backends"
F --> G[HoneyHive API]
F -.->|"Optional"| H[Existing OTel Backend]
end
```
This means:
* Any OTel-compatible instrumentor works with HoneyHive
* Traces follow W3C Trace Context and are portable to other backends
* You can export to HoneyHive and your existing backend simultaneously by adding multiple span processors
### How HoneyHive Captures Data
When your application runs, data flows through several layers before reaching the HoneyHive dashboard. Your code calls an LLM provider as usual. The instrumentor (e.g. OpenAI instrumentor) intercepts that call, records the request and response as OTel span attributes, and the HoneyHive exporter sends them to the API via OTLP when each span completes.
**Handling sensitive data:** Instrumentors capture full request and response payloads for your LLM calls, which can include PII (names, emails, phone numbers, and similar fields). Redact or mask sensitive values in your application code before data reaches the LLM call. For organizations with strict compliance requirements, HoneyHive also offers [self-hosted deployments](/v2/setup/self-hosted).
```mermaid theme={null}
sequenceDiagram
participant App as Your Application
participant SDK as HoneyHive SDK
participant Inst as Instrumentor
participant LLM as LLM Provider
participant OTEL as OpenTelemetry
participant Exp as HoneyHive Exporter
participant API as HoneyHive API
App->>SDK: @trace decorator creates span
SDK->>OTEL: Register span in TracerProvider
App->>LLM: LLM API call (e.g. openai.chat.completions.create)
Inst->>OTEL: Intercept call, start child span
LLM-->>Inst: API response
Inst->>OTEL: Record model, tokens, latency, messages
OTEL->>Exp: Span completed
Exp->>API: Send span via OTLP
API-->>Exp: Acknowledge
```
### Semantic Conventions
HoneyHive uses the official [OTel GenAI semantic conventions](https://opentelemetry.io/docs/specs/semconv/gen-ai/) as its primary standard for AI-specific attributes:
| Attribute | Description |
| -------------------------------- | ----------------------------------------------- |
| `gen_ai.system` | AI provider (`"openai"`, `"anthropic"`) |
| `gen_ai.model` | Model identifier (`"gpt-4"`, `"claude-3-opus"`) |
| `gen_ai.usage.prompt_tokens` | Input token count |
| `gen_ai.usage.completion_tokens` | Output token count |
HoneyHive also supports [OpenInference](https://github.com/Arize-ai/openinference) and [OpenLLMetry](https://github.com/traceloop/openllmetry) conventions, so instrumentors from either ecosystem work out of the box.
### BYOI: Bring Your Own Instrumentor
The HoneyHive SDK itself has zero dependencies on AI libraries. Instrumentors (the packages that know how to trace OpenAI, Anthropic, etc.) are installed separately. This means the core SDK never conflicts with your application's dependency versions, and you only install instrumentors for the providers you actually use. For setup, see the [Quickstart](/v2/introduction/tracing-quickstart) or individual [Integration Guides](/v2/integrations/openai).
### Context Propagation
Within a single process, trace context flows automatically. Child events created inside a traced function are linked to their parent without any manual wiring.
Across service boundaries, context propagates via W3C `traceparent` headers. The client injects trace context into outgoing HTTP headers; the server extracts it from incoming headers. All events on the server side then join the same session as the client.
```mermaid theme={null}
sequenceDiagram
participant Client as Client Request
participant Gateway as API Gateway
participant UserSvc as User Service
participant LLMSvc as LLM Service
Client->>Gateway: HTTP Request
trace-id: abc123
Gateway->>UserSvc: Internal Call
trace-id: abc123
UserSvc->>LLMSvc: LLM Request
trace-id: abc123
LLMSvc->>LLMSvc: OpenAI Call
LLMSvc-->>UserSvc: LLM Response
UserSvc-->>Gateway: Result
Gateway-->>Client: Final Response
Note over Client,LLMSvc: All operations linked by trace-id
```
The trace ID threads through every hop. In HoneyHive, all events from all services appear in a single session, giving you a unified view of the entire request.
For implementation details, see [Distributed Tracing](/v2/tracing/distributed-tracing).
### Multi-Instance Tracing
HoneyHive supports multiple tracer instances in a single application. Each instance maintains its own session context and configuration, and can target a different project. This is relevant for multi-tenant platforms, environment-based routing, A/B testing, or isolating traces from different agents in a multi-agent system.
Each tracer instance has its own OTel `TracerProvider` and span processor pipeline. Instances do not share context.
```mermaid theme={null}
graph TB
subgraph "Application"
A[Request 1] --> B[Tracer 1]
C[Request 2] --> D[Tracer 2]
E[Request 3] --> F[Tracer 3]
end
subgraph "Isolated Sessions"
B --> G["Session A (tenant: acme)"]
D --> H["Session B (tenant: globex)"]
F --> I["Session C (tenant: acme)"]
end
G --> J[HoneyHive API]
H --> J
I --> J
```
For setup patterns, see [Multi-Instance Tracing](/v2/tracing/multi-instance).
### Sampling
High-volume applications can use sampling to control cost and overhead. HoneyHive traces asynchronously and batches span exports, so overhead is minimal, but at very high volumes you may want to selectively trace:
* Always trace errors and high-priority requests
* Always trace premium or flagged users
* Sample a percentage of regular traffic
For strategies and implementation, see [Sampling](/v2/tracing/sampling).