> ## Documentation Index
> Fetch the complete documentation index at: https://docs.honeyhive.ai/llms.txt
> Use this file to discover all available pages before exploring further.
# AI Application Tracing with HoneyHive
> Start tracing AI applications with HoneyHive: capture LLM calls, tool invocations, and agent steps in a hierarchical execution view using OpenTelemetry.
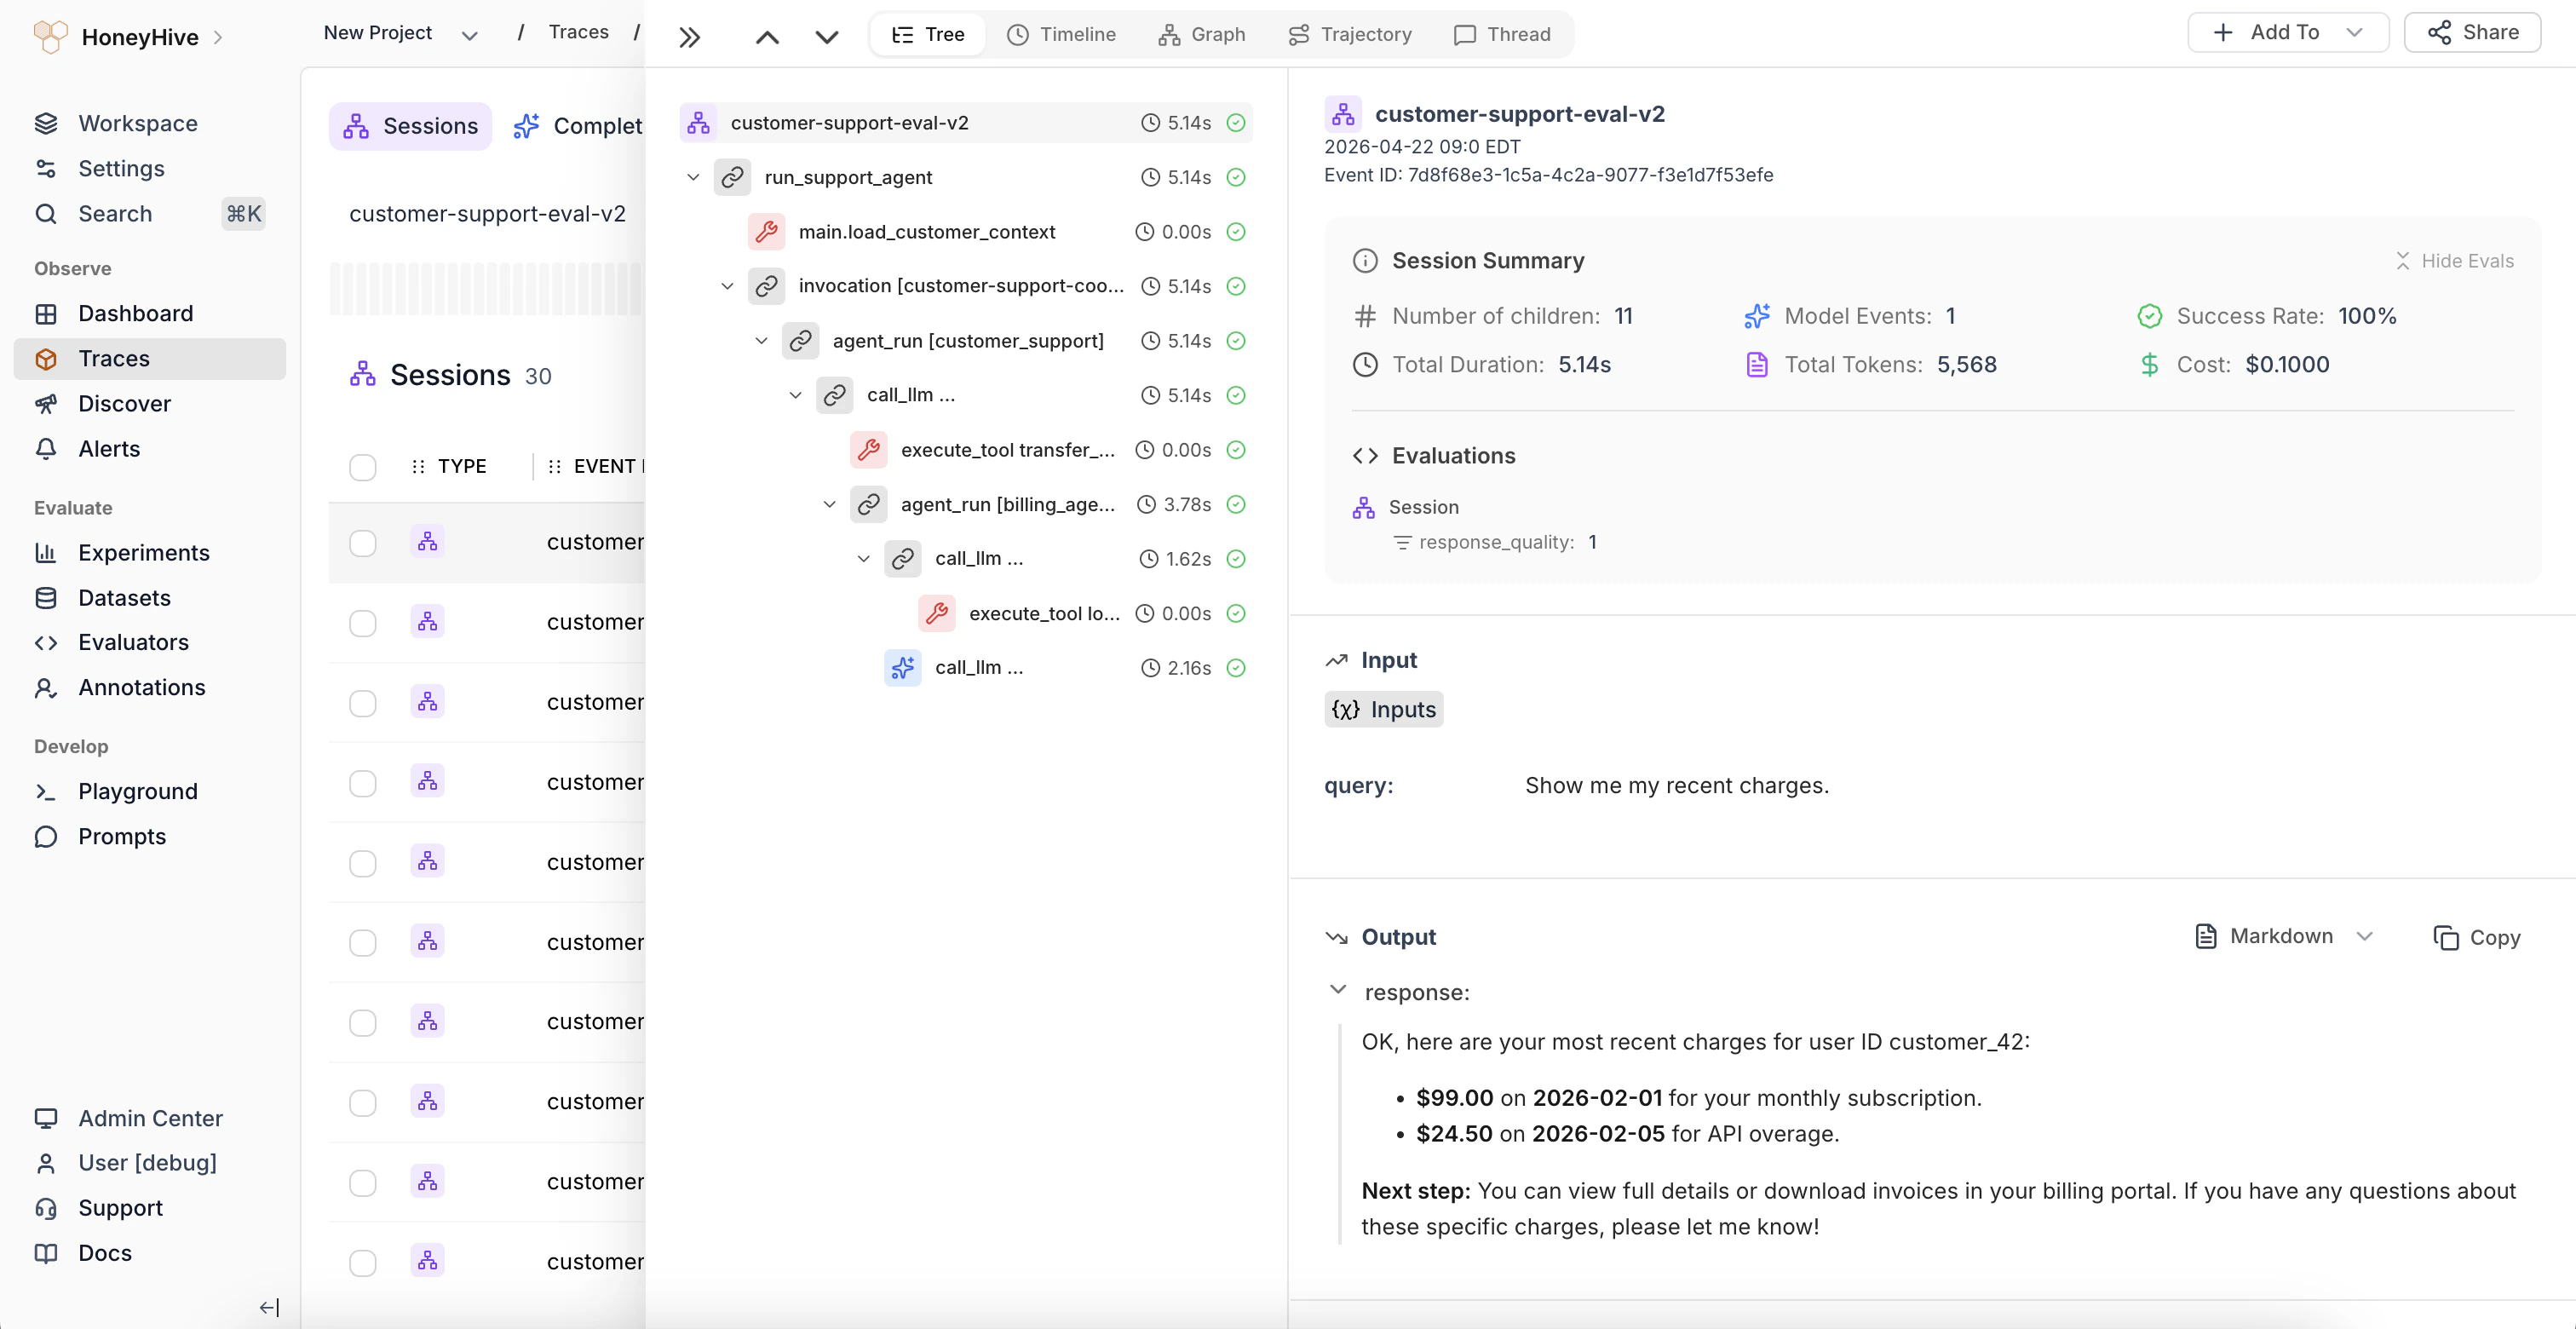
HoneyHive tracing captures every step of your AI application, from LLM requests and tool calls to agent handoffs, in a hierarchical execution view you can debug in the dashboard. Follow the [tracing quickstart](/v2/introduction/tracing-quickstart) to send your first trace, then read [tracing concepts](/v2/tracing/concepts) to understand sessions and events.
 ***
## How do you start tracing?
### How does automatic tracing work?
The fastest way to start is automatic tracing, which instruments major LLM providers and vector databases with minimal setup using OpenTelemetry semantic conventions.
**Using an agent framework?** We currently document framework-specific setup for [AWS Strands](/v2/integrations/strands), [Google ADK](/v2/integrations/google-adk), and [PydanticAI](/v2/integrations/pydantic-ai).
Begin tracing OpenAI requests with HoneyHive in minutes
Pre-built integrations for common model providers and frameworks
Deploying in Lambda, FastAPI, Flask, or Django? Read [Tracer Initialization](/v2/tracing/tracer-initialization) next to choose the right runtime setup pattern before you wire tracing into production.
### How do you trace custom business logic?
Automatic tracing covers LLM and vector DB calls. For preprocessing, postprocessing, or other business logic, use the `@trace()` decorator to create [custom spans](/v2/tracing/custom-spans) that appear in your trace tree.
Trace any function in Python/TS using decorators
### What advanced tracing features are available?
Propagate trace context across service boundaries so multi-service calls appear in a single session
Control which requests get traced in high-volume applications
Drop noisy framework spans using prefix-based rules
Run multiple tracer instances for multi-tenant, A/B testing, or environment routing
Trace pipelines that combine text, image, audio, or video operations
Propagate context across threads in Python applications
Log events directly via REST API for languages without SDK support
***
## How do you start tracing?
### How does automatic tracing work?
The fastest way to start is automatic tracing, which instruments major LLM providers and vector databases with minimal setup using OpenTelemetry semantic conventions.
**Using an agent framework?** We currently document framework-specific setup for [AWS Strands](/v2/integrations/strands), [Google ADK](/v2/integrations/google-adk), and [PydanticAI](/v2/integrations/pydantic-ai).
Begin tracing OpenAI requests with HoneyHive in minutes
Pre-built integrations for common model providers and frameworks
Deploying in Lambda, FastAPI, Flask, or Django? Read [Tracer Initialization](/v2/tracing/tracer-initialization) next to choose the right runtime setup pattern before you wire tracing into production.
### How do you trace custom business logic?
Automatic tracing covers LLM and vector DB calls. For preprocessing, postprocessing, or other business logic, use the `@trace()` decorator to create [custom spans](/v2/tracing/custom-spans) that appear in your trace tree.
Trace any function in Python/TS using decorators
### What advanced tracing features are available?
Propagate trace context across service boundaries so multi-service calls appear in a single session
Control which requests get traced in high-volume applications
Drop noisy framework spans using prefix-based rules
Run multiple tracer instances for multi-tenant, A/B testing, or environment routing
Trace pipelines that combine text, image, audio, or video operations
Propagate context across threads in Python applications
Log events directly via REST API for languages without SDK support