> ## Documentation Index
> Fetch the complete documentation index at: https://docs.honeyhive.ai/llms.txt
> Use this file to discover all available pages before exploring further.
# Trajectory View
> Visualize agent behavior in HoneyHive Trajectory View as a bubble chart to spot loops, stuck steps, outliers, and costly execution paths across steps.
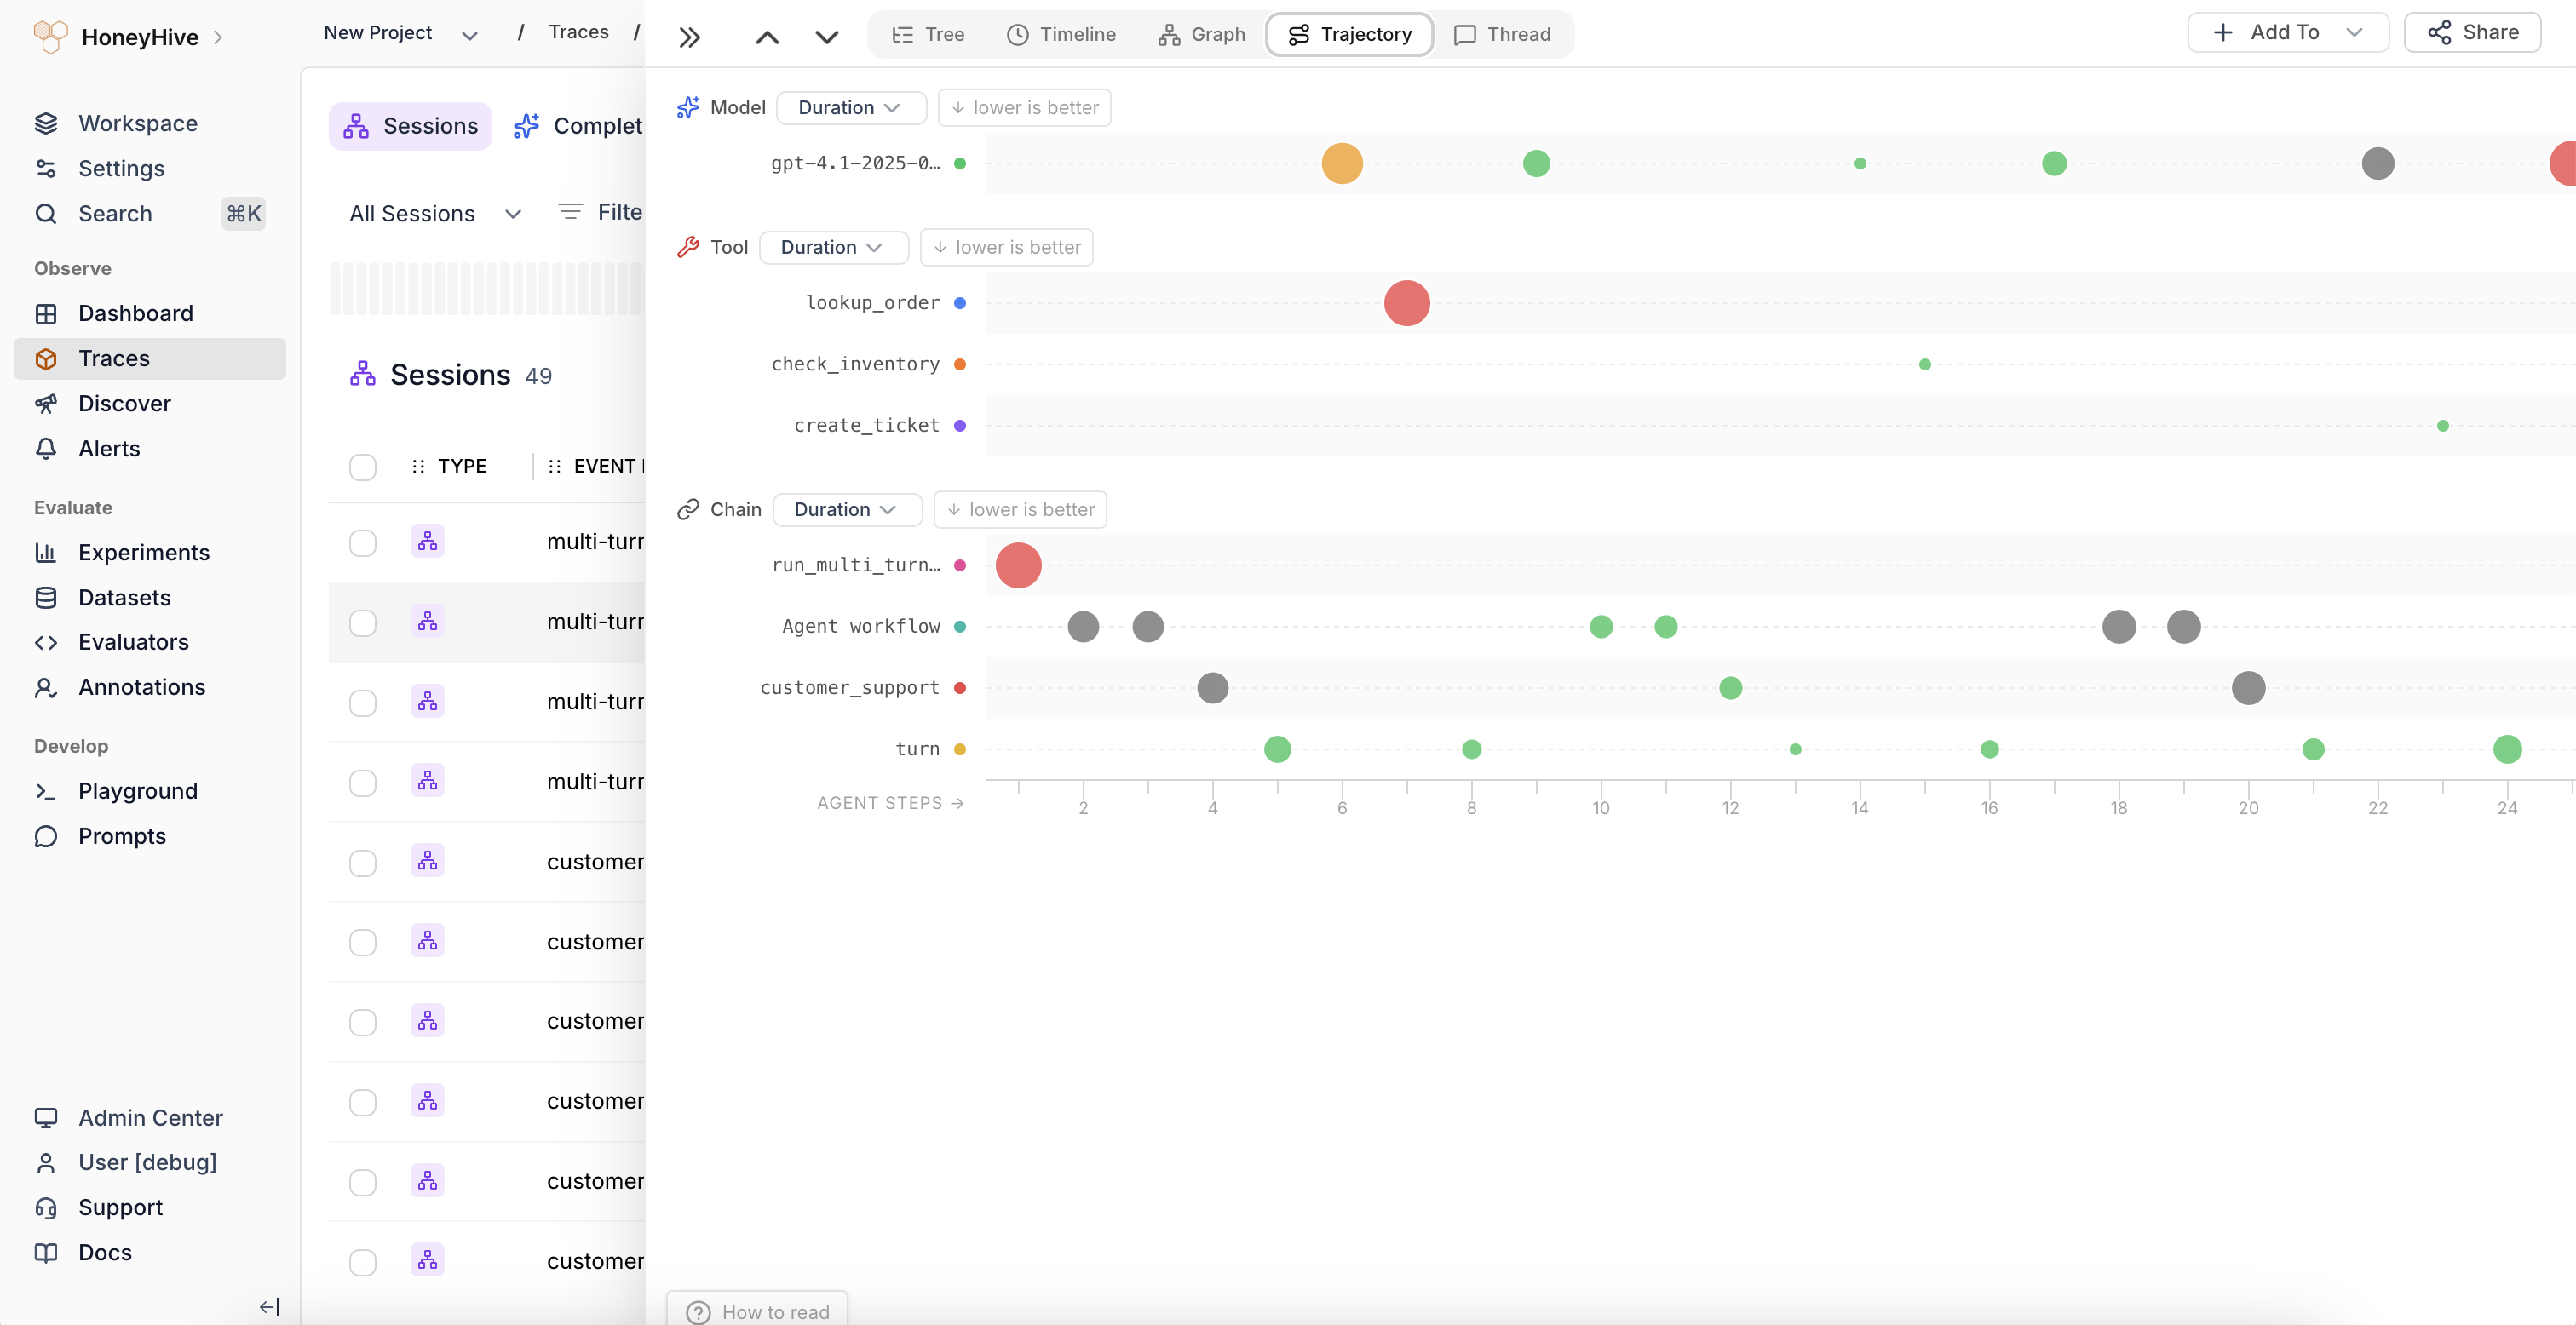
The Trajectory view plots each span as a bubble on a category-by-step grid, providing a visual fingerprint of how an agent session unfolded.
 ## Reading the chart
* **Y-axis** groups spans by event type and name (e.g., Model: `customer_support`, Tool: `search_knowledge_base`)
* **X-axis** shows chronological step order (Agent Steps 1, 2, 3...)
* **Bubble size** represents the selected metric value (duration by default). Larger bubbles indicate higher values, making outliers easy to spot
* **Bubble color** uses a green-to-red gradient based on the metric. Green indicates good performance, red indicates poor performance, relative to whether higher or lower values are better for that metric
## Switching metrics
Each event-type group (Model, Tool, Chain) has a dropdown to switch the displayed metric:
* **Duration** - how long each span took
* **Cost** - estimated cost of the operation
* **Evaluator scores** - any evaluator metrics attached to the spans
The "lower is better" / "higher is better" indicator next to each dropdown shows the direction of the color scale.
## Interacting with bubbles
Click any bubble to jump to that span in the [Tree view](/v2/tracing/tree-view), where you can inspect its full inputs, outputs, and metadata.
## When to use
Use the Trajectory view to:
* Spot behavioral patterns across agent steps (e.g., repeated tool calls, escalating latency)
* Compare how different agent runs unfold structurally
* Identify anomalous steps where a metric spikes unexpectedly
* Understand the rhythm of model-tool-chain interactions in agentic workflows
## Reading the chart
* **Y-axis** groups spans by event type and name (e.g., Model: `customer_support`, Tool: `search_knowledge_base`)
* **X-axis** shows chronological step order (Agent Steps 1, 2, 3...)
* **Bubble size** represents the selected metric value (duration by default). Larger bubbles indicate higher values, making outliers easy to spot
* **Bubble color** uses a green-to-red gradient based on the metric. Green indicates good performance, red indicates poor performance, relative to whether higher or lower values are better for that metric
## Switching metrics
Each event-type group (Model, Tool, Chain) has a dropdown to switch the displayed metric:
* **Duration** - how long each span took
* **Cost** - estimated cost of the operation
* **Evaluator scores** - any evaluator metrics attached to the spans
The "lower is better" / "higher is better" indicator next to each dropdown shows the direction of the color scale.
## Interacting with bubbles
Click any bubble to jump to that span in the [Tree view](/v2/tracing/tree-view), where you can inspect its full inputs, outputs, and metadata.
## When to use
Use the Trajectory view to:
* Spot behavioral patterns across agent steps (e.g., repeated tool calls, escalating latency)
* Compare how different agent runs unfold structurally
* Identify anomalous steps where a metric spikes unexpectedly
* Understand the rhythm of model-tool-chain interactions in agentic workflows