> ## Documentation Index
> Fetch the complete documentation index at: https://docs.honeyhive.ai/llms.txt
> Use this file to discover all available pages before exploring further.
# Tree View
> Use HoneyHive Tree View to inspect parent-child span relationships, drill into LLM and tool events, and debug hierarchical AI agent execution.
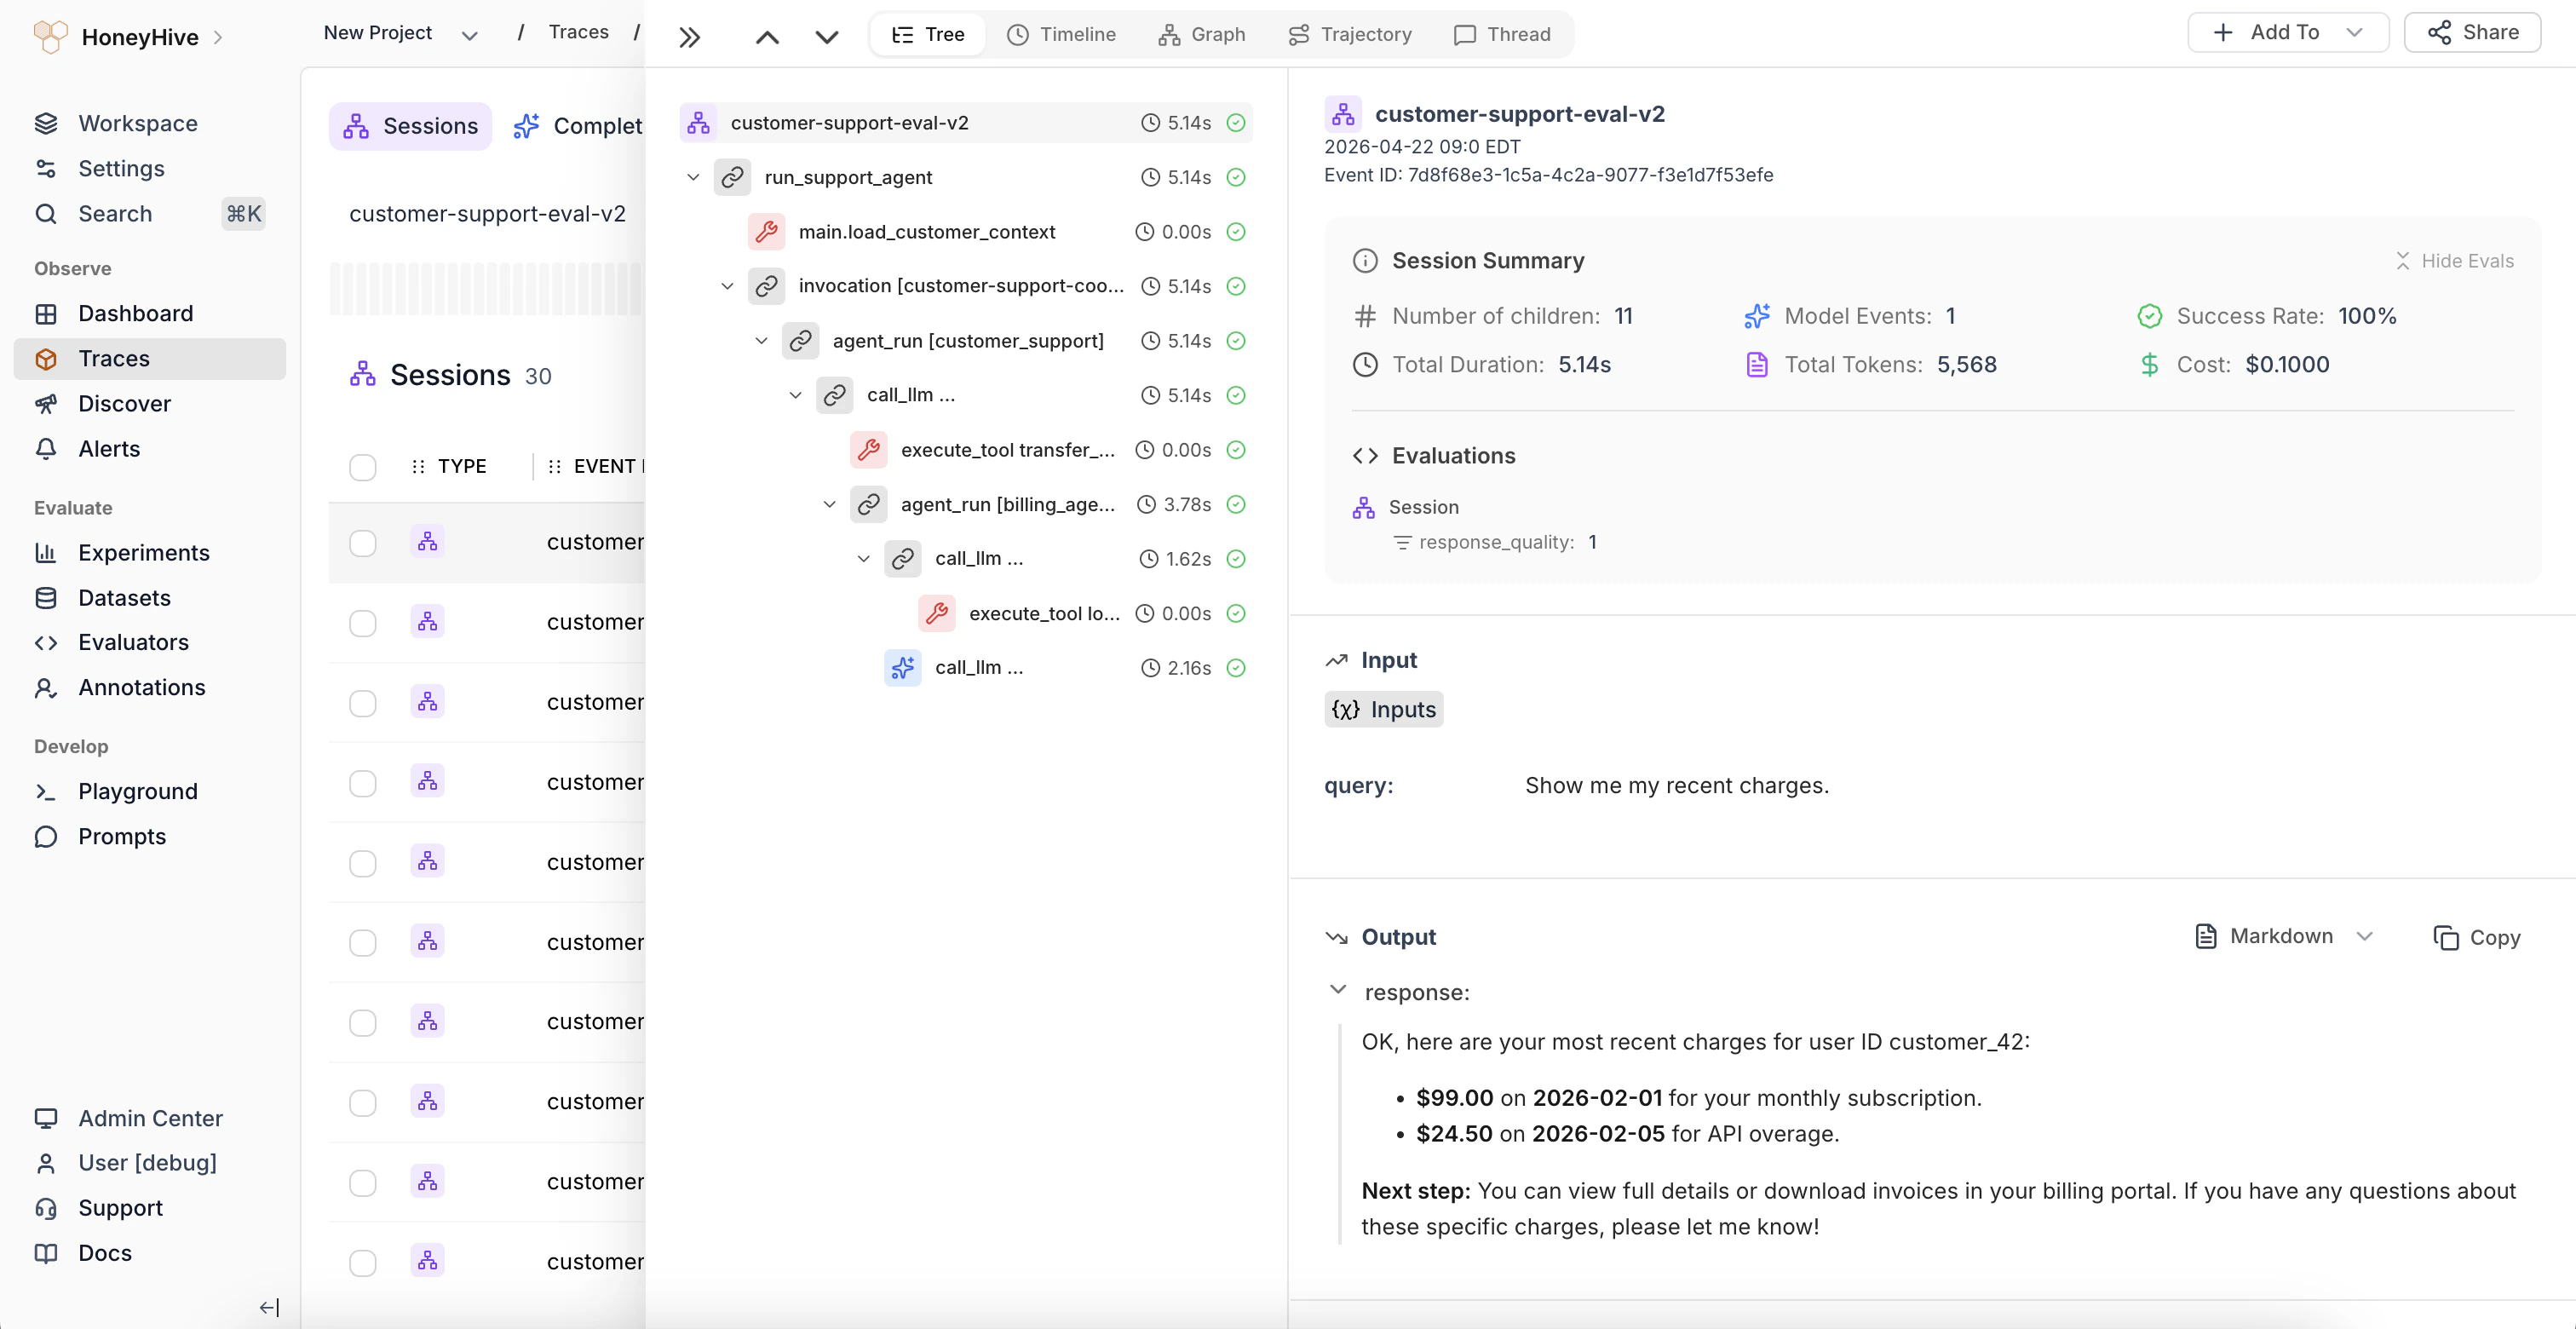
The Tree view is the default visualization when you open a session. It displays every span as a nested hierarchy, reflecting model events, tool events, and chain events in your trace.
 ## Reading the tree
Each row represents a single span (event). Indentation shows parent-child relationships - a child span is nested under the span that created it.
* **Icons** indicate the event type: model, tool, or chain
* **Duration** is shown next to each span name
* **Status indicators** (green/red) show whether the span completed successfully
Click any span to view its details in the right panel, including inputs, outputs, metadata, and evaluation scores.
## Session Summary
At the top of the right panel, the Session Summary shows aggregate stats for the entire trace:
* **Number of children** - total span count
* **Model Events** - number of LLM calls
* **Success Rate** - percentage of spans that completed without errors
* **Total Duration** - end-to-end latency
* **Total Tokens** - combined token usage across all LLM calls
* **Cost** - estimated cost from token usage
## Evaluations
Below the summary, the Evaluations section displays scores from automated evaluators and human feedback. When the same evaluator runs on multiple child spans, results are grouped with count, average, min, and max. Click a grouped metric to expand per-span values.
## When to use
Use the Tree view to:
* Understand the full execution flow of a request
* Find which specific span produced an unexpected output
* Check inputs and outputs at each step in the pipeline
* Review evaluation scores for individual spans
## Reading the tree
Each row represents a single span (event). Indentation shows parent-child relationships - a child span is nested under the span that created it.
* **Icons** indicate the event type: model, tool, or chain
* **Duration** is shown next to each span name
* **Status indicators** (green/red) show whether the span completed successfully
Click any span to view its details in the right panel, including inputs, outputs, metadata, and evaluation scores.
## Session Summary
At the top of the right panel, the Session Summary shows aggregate stats for the entire trace:
* **Number of children** - total span count
* **Model Events** - number of LLM calls
* **Success Rate** - percentage of spans that completed without errors
* **Total Duration** - end-to-end latency
* **Total Tokens** - combined token usage across all LLM calls
* **Cost** - estimated cost from token usage
## Evaluations
Below the summary, the Evaluations section displays scores from automated evaluators and human feedback. When the same evaluator runs on multiple child spans, results are grouped with count, average, min, and max. Click a grouped metric to expand per-span values.
## When to use
Use the Tree view to:
* Understand the full execution flow of a request
* Find which specific span produced an unexpected output
* Check inputs and outputs at each step in the pipeline
* Review evaluation scores for individual spans