> ## Documentation Index
> Fetch the complete documentation index at: https://docs.honeyhive.ai/llms.txt
> Use this file to discover all available pages before exploring further.
# Explore in UI
> Navigate the HoneyHive Traces page to debug sessions, inspect span trees, filter events, and curate production data for datasets and experiments.
The Traces page provides three views for exploring your traced data:
* **Sessions** - Navigate between complete traces (end-to-end user interactions)
* **Completions** - Browse individual LLM requests across all traces
* **All Events** - View every span and event in your project
## Session Side View
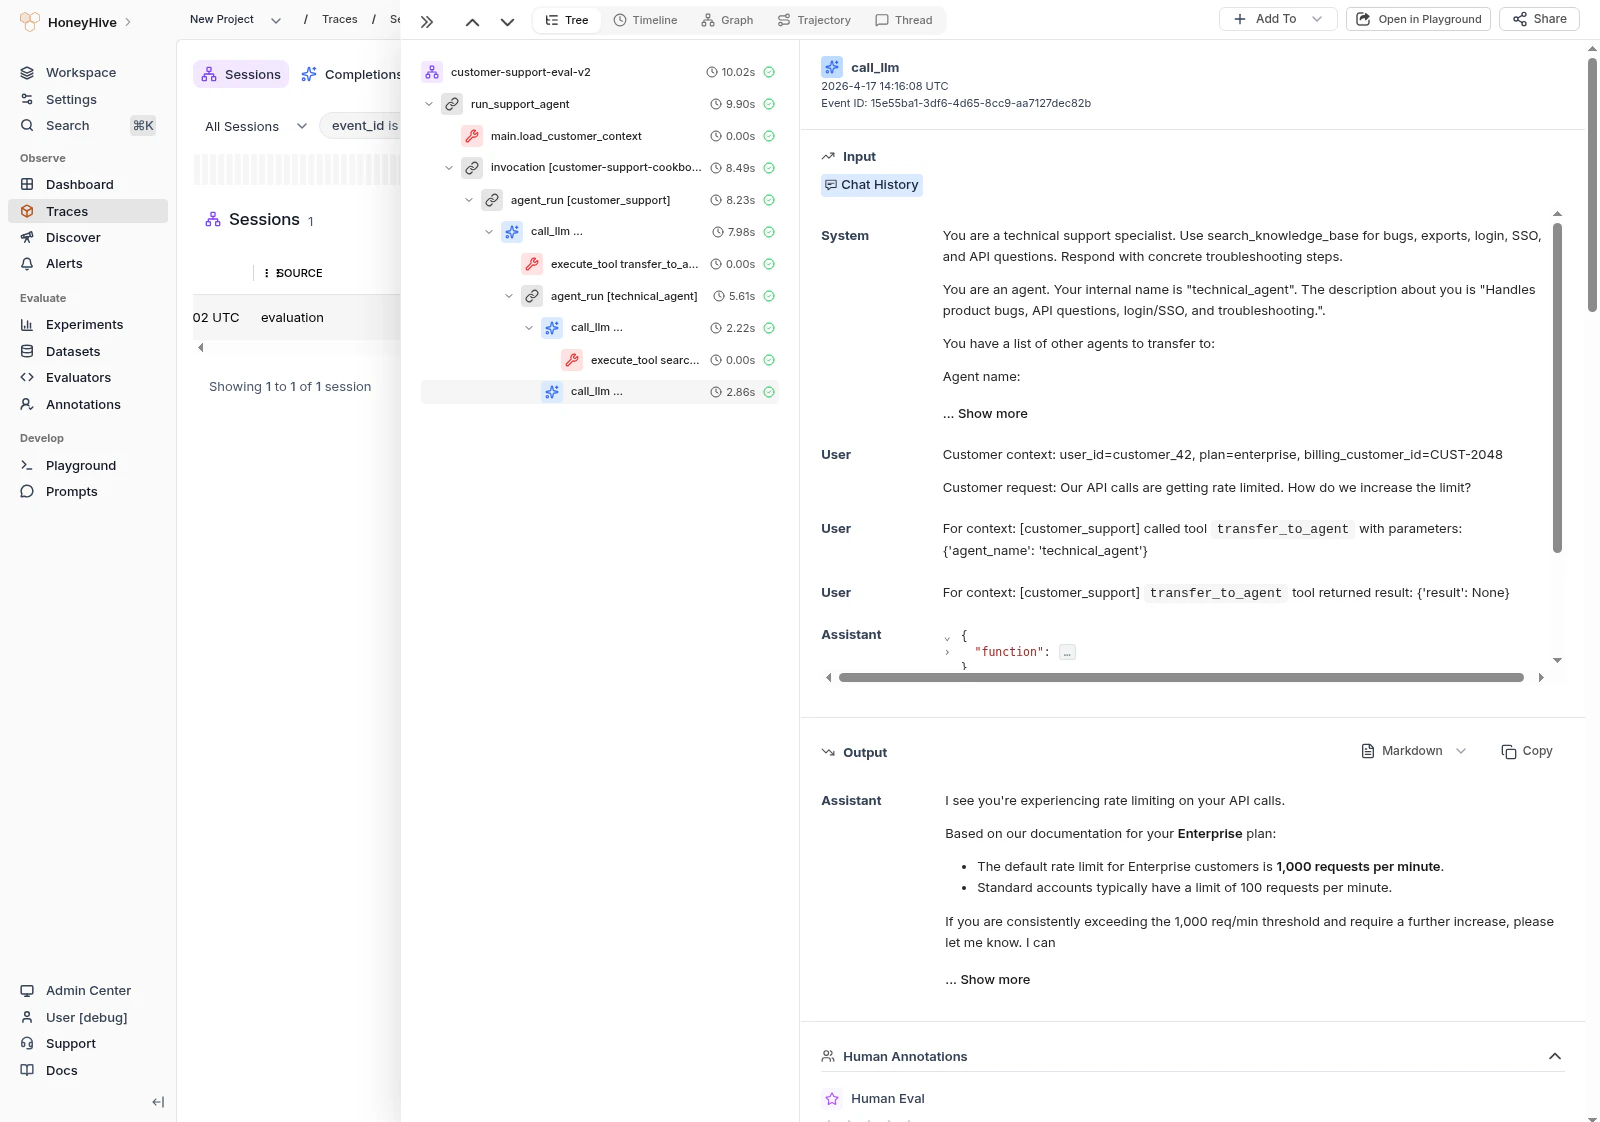
Click a session to open the side view. The side view provides five visualization tabs, each offering a different way to inspect the trace:
Hierarchical span tree showing parent-child relationships, session summary stats, and event details.
Gantt-style chart of span durations for spotting latency bottlenecks.
Directed graph of execution flow with latency bottlenecks and common agent paths.
Bubble chart of agent behavior patterns across execution steps.
Chronological message thread for conversational and multi-agent traces.
## Debug LLM requests in Playground
When an LLM output doesn't look right, you can debug it by opening the model event in the Playground to iterate on your prompt.
1. Click on any session in the Traces page to open the trace detail view
2. In the trace tree, click on the LLM completion you want to debug
3. Click the **Open in Playground** button in the top right
 ## Annotate outputs
For manual review workflows, see [Annotation Queues](/v2/evaluation/annotation-queues) to set up human evaluation criteria and organize events for review.
Use keyboard shortcuts ⬆️ and ⬇️ to quickly navigate between rows in the Traces page.
## Curate datasets
You can add any session, completion, or span to a dataset directly from the UI.
1. In the Traces page, use filters to find the events you want
2. Select one or more rows using the checkboxes
3. Click **+ Add To** → **Add to Dataset**
4. Select an existing dataset or create a new one
## Annotate outputs
For manual review workflows, see [Annotation Queues](/v2/evaluation/annotation-queues) to set up human evaluation criteria and organize events for review.
Use keyboard shortcuts ⬆️ and ⬇️ to quickly navigate between rows in the Traces page.
## Curate datasets
You can add any session, completion, or span to a dataset directly from the UI.
1. In the Traces page, use filters to find the events you want
2. Select one or more rows using the checkboxes
3. Click **+ Add To** → **Add to Dataset**
4. Select an existing dataset or create a new one
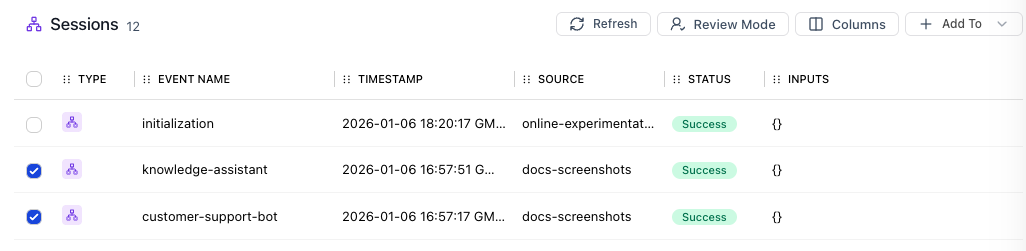 Use the **Completions** tab to curate individual LLM requests, or **Sessions** tab for complete traces.
## Share traces
Click the **Share** button in the top right of any trace to copy a shareable link. Anyone on your team with access to the project can view it.
If you share a child event, the link takes viewers directly to that specific event within the trace.
Use the **Completions** tab to curate individual LLM requests, or **Sessions** tab for complete traces.
## Share traces
Click the **Share** button in the top right of any trace to copy a shareable link. Anyone on your team with access to the project can view it.
If you share a child event, the link takes viewers directly to that specific event within the trace.