Documentation Index
Fetch the complete documentation index at: https://docs.honeyhive.ai/llms.txt
Use this file to discover all available pages before exploring further.
View the complete cookbook example on GitHub: honeyhiveai/cookbook/langgraph-cookbook
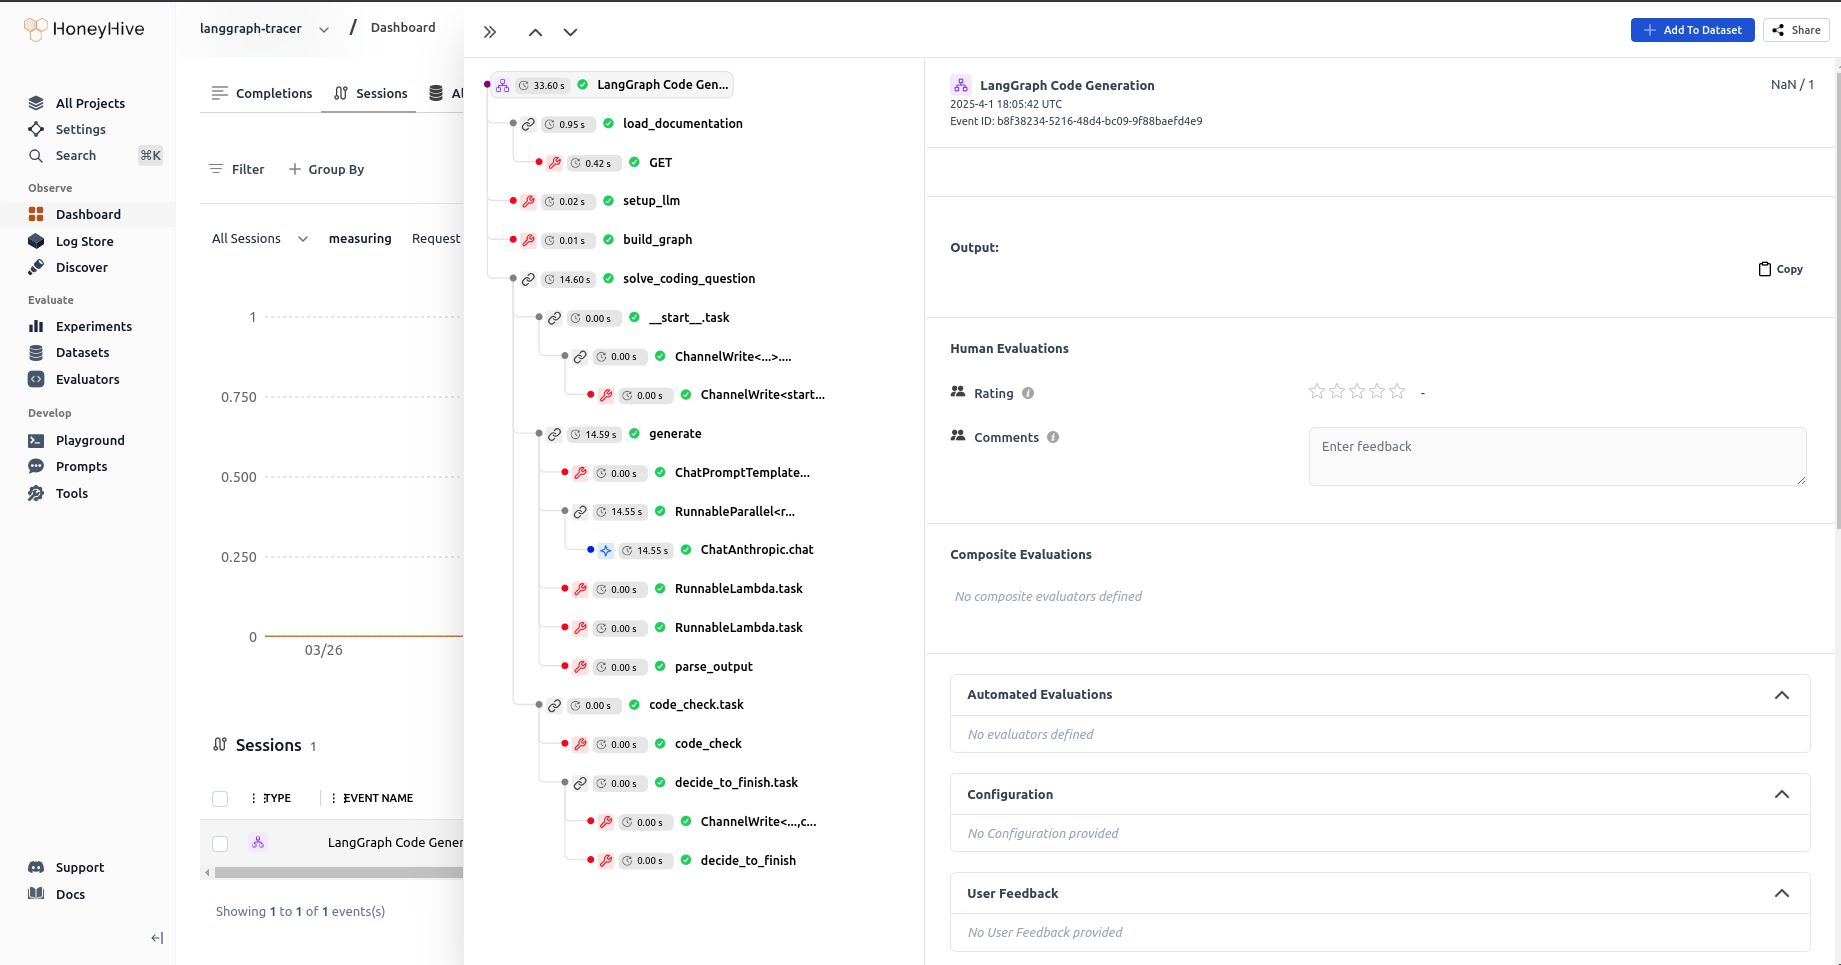
This guide demonstrates how to build a sophisticated code generation system using LangGraph and HoneyHive tracing. The system combines Retrieval Augmented Generation (RAG) with self-correction capabilities to generate reliable code solutions. HoneyHive’s tracing capabilities provide comprehensive visibility into the entire process, making debugging and optimization easier than ever.
Overview
The system consists of several key components:
- Documentation loading and processing (traced with HoneyHive)
- LLM setup with structured output (monitored for performance)
- A LangGraph workflow for code generation and validation (with detailed tracing)
- HoneyHive tracing for monitoring and debugging (real-time insights)
Prerequisites
Before running this code, ensure you have the following:
- Python 3.x
- Required API keys:
- HoneyHive API key (for comprehensive tracing)
- OpenAI API key
- Anthropic API key
- Required packages:
pip install langchain langchain-community langgraph beautifulsoup4 honeyhive langchain-openai langchain-anthropic
Code Implementation
Environment Setup and Imports
import getpass
import os
import sys
from bs4 import BeautifulSoup as Soup
from langchain_community.document_loaders.recursive_url_loader import RecursiveUrlLoader
from langchain_core.prompts import ChatPromptTemplate
from langchain_openai import ChatOpenAI
from langchain_anthropic import ChatAnthropic
from pydantic import BaseModel, Field
from typing import List
from typing_extensions import TypedDict, Annotated
from langgraph.graph import END, StateGraph, START
from honeyhive import HoneyHiveTracer, trace

# Set up environment variables
# Delete the below if it is already set in the environment
os.environ["HONEYHIVE_API_KEY"] = "your honeyhive api key"
os.environ["HONEYHIVE_PROJECT"] = "your honeyhive project"
os.environ["HONEYHIVE_SOURCE"] = "your honeyhive source"
os.environ["OPENAI_API_KEY"] = "your openai api key"
os.environ["ANTHROPIC_API_KEY"] = "your anthropic api key"
HoneyHive Tracing Setup
HoneyHive’s tracing setup provides comprehensive monitoring capabilities:
# Initialize HoneyHive tracer with detailed configuration
HoneyHiveTracer.init(
    api_key=os.environ.get("HONEYHIVE_API_KEY", "your honeyhive api key"),
    project=os.environ.get("HONEYHIVE_PROJECT", "your honeyhive project"),
    source="development",
    session_name="LangGraph Code Generation"
)
- Real-time monitoring of all traced functions
- Detailed performance metrics
- Error tracking and debugging
- Session-based analytics
- Custom metadata support
Documentation Loading
The system uses RecursiveUrlLoader with HoneyHive tracing to monitor documentation loading:
@trace
def load_documentation(url):
    """Load documentation from a URL"""
    print("---LOADING DOCUMENTATION---")
    loader = RecursiveUrlLoader(
        url=url, max_depth=20, extractor=lambda x: Soup(x, "html.parser").text
    )
    docs = loader.load()

    # Sort and concatenate documentation
    d_sorted = sorted(docs, key=lambda x: x.metadata["source"])
    d_reversed = list(reversed(d_sorted))
    concatenated_content = "\n\n\n --- \n\n\n".join(
        [doc.page_content for doc in d_reversed]
    )
    print("---DOCUMENTATION LOADED---")
    return concatenated_content
- Loading time metrics
- Document count tracking
- Error handling for failed loads
- Memory usage monitoring
- URL accessibility tracking
Data Model
The system uses Pydantic with HoneyHive tracing for structured output validation:
class code(BaseModel):
    """Schema for code solutions to questions about HoneyHive."""
    prefix: str = Field(description="Description of the problem and approach")
    imports: str = Field(description="Code block import statements")
    code: str = Field(description="Code block not including import statements")
- Model validation success rates
- Field completion rates
- Schema compliance
- Data quality metrics
LLM Setup
The system uses Claude with HoneyHive tracing for comprehensive LLM monitoring:
code_gen_prompt_claude = ChatPromptTemplate.from_messages([
    (
        "system",
        """<instructions> You are a coding assistant with expertise in HoneyHive. \n
        Here is the LCEL documentation:  \n ------- \n  {context} \n ------- \n Answer the user  question based on the \n
        above provided documentation. Ensure any code you provide can be executed with all required imports and variables \n
        defined. Structure your answer: 1) a prefix describing the code solution, 2) the imports, 3) the functioning code block. \n
        Invoke the code tool to structure the output correctly. </instructions> \n Here is the user question:""",
    ),
    ("placeholder", "{messages}"),
])

@trace
def setup_llm():
    """Set up the LLM with structured output"""
    expt_llm_claude = "claude-3-7-sonnet-latest"
    llm_claude = ChatAnthropic(
        model=expt_llm_claude,
        default_headers={"anthropic-beta": "tools-2024-04-04"},
    )
    structured_llm_claude = llm_claude.with_structured_output(code, include_raw=True)
    return structured_llm_claude

llm = setup_llm()
- LLM response time tracking
- Token usage monitoring
- Error rate tracking
- Model performance analytics
- Cost tracking per request
Documentation Loading and Chain Setup
First, load the documentation and set up the code generation chain:
# Load HoneyHive documentation
documentation = load_documentation("https://docs.honeyhive.ai/introduction/quickstart")

# Helper function for Claude output processing
@trace
def parse_output(solution):
    """Parse the structured output from Claude"""
    if "parsed" in solution:
        return solution["parsed"]
    return solution

# Set up the code generation chain
code_gen_chain = code_gen_prompt_claude | llm | parse_output
LangGraph Implementation
The system uses LangGraph with HoneyHive tracing for workflow monitoring:
- State Definition:
class GraphState(TypedDict):
    """
    Represents the state of our graph.

    Attributes:
        error : Binary flag for control flow to indicate whether test error was tripped
        messages : With user question, error messages, reasoning
        generation : str with code solution
        iterations : Number of tries
    """
    error: str
    messages: List
    generation: str
    iterations: int
- Graph Nodes with HoneyHive tracing:
Generate Node:
@trace
def generate(state: GraphState):
    """
    Generate a code solution

    Args:
        state (dict): The current graph state

    Returns:
        state (dict): New key added to state, generation
    """
    print("---GENERATING CODE SOLUTION---")
    messages = state["messages"]

    # Generate the code solution
    generation = code_gen_chain.invoke(
        {"messages": messages, "context": documentation}
    )

    print("---CODE SOLUTION GENERATED---")
    return {"generation": generation, "iterations": state["iterations"] + 1}
@trace
def code_check(state: GraphState):
    """
    Verify that the code solution works by:
    1. Checking that imports don't error
    2. Checking that code execution doesn't error

    Args:
        state (dict): The current graph state with the code solution

    Returns:
        state (dict): State with updated error flag and messages
    """
    print("---CHECKING CODE SOLUTION---")
    generation = state["generation"]

    # Extract imports and code
    imports = generation.imports
    code_block = generation.code

    # Check imports
    error_msg = None
    try:
        print("---CHECKING IMPORTS---")
        exec(imports)
        print("Imports OK!")
    except Exception as e:
        error_msg = f"Import error: {str(e)}"
        print(f"Import error: {e}")

    # If imports okay, check code execution
    if not error_msg:
        try:
            print("---CHECKING CODE EXECUTION---")
            # Only syntax check (don't execute the code for safety)
            compile(code_block, "<string>", "exec")
            print("Code syntax OK!")
        except Exception as e:
            error_msg = f"Code execution error: {str(e)}"
            print(f"Code execution error: {e}")

    # Update state based on checks
    has_error = error_msg is not None
    if has_error:
        messages = state["messages"] + [
            (
                "assistant",
                f"There was an error with the code: {error_msg}. Let me fix it.",
            )
        ]
        return {"error": "yes", "messages": messages}
    else:
        return {"error": "no"}
@trace
def reflect(state: GraphState):
    """
    Reflect on the code solution and improve it

    Args:
        state (dict): The current graph state

    Returns:
        state (dict): State with updated messages for reflection
    """
    print("---REFLECTING ON SOLUTION---")

    # Add a reflection step to messages for the next iteration
    messages = state["messages"] + [
        (
            "assistant",
            "Let me review the code once more to make sure it's correct and follows best practices."
        )
    ]

    return {"messages": messages}
@trace
def decide_to_finish(state: GraphState):
    """
    Decide whether to finish or try again

    Args:
        state (dict): The current graph state

    Returns:
        str: "reflect", "finish", or "generate"
    """
    error = state["error"]
    iterations = state["iterations"]
    max_iterations = 3

    # If there's an error and we haven't reached max iterations, generate again
    if error == "yes" and iterations < max_iterations:
        print(f"---ERROR DETECTED, REGENERATING (Iteration {iterations}/{max_iterations})---")
        return "generate"

    # If no error but want to reflect before finishing (optional)
    # Change flag to "reflect" to enable this branch
    flag = "do not reflect"  # Change to "reflect" to enable reflection
    if error == "no" and flag == "reflect":
        print("---NO ERROR, REFLECTING BEFORE FINISHING---")
        return "reflect"

    # Otherwise, finish
    print("---FINISHING---")
    return "finish"
- Graph Construction with comprehensive tracing:
@trace
def build_graph():
    """Build the LangGraph for code generation"""
    # Create a graph
    graph_builder = StateGraph(GraphState)

    # Add nodes
    graph_builder.add_node("generate", generate)
    graph_builder.add_node("code_check", code_check)
    graph_builder.add_node("reflect", reflect)

    # Add edges
    graph_builder.add_edge(START, "generate")
    graph_builder.add_edge("generate", "code_check")

    # Add conditional edges
    graph_builder.add_conditional_edges(
        "code_check",
        decide_to_finish,
        {
            "generate": "generate",
            "reflect": "reflect",
            "finish": END,
        },
    )
    graph_builder.add_edge("reflect", "generate")

    # Compile the graph
    return graph_builder.compile()

# Create the graph
graph = build_graph()
Main Execution Function
The main function to run the graph with a question:
# Function to run the graph with a question
@trace
def solve_coding_question(question):
    """Run the graph to solve a coding question"""
    # Initialize the state
    state = {
        "error": "no",
        "messages": [("human", question)],
        "generation": None,
        "iterations": 0,
    }

    # Execute the graph
    result = graph.invoke(state)

    # Return the generated code solution
    return result["generation"]
- Node execution time tracking
- Edge traversal monitoring
- State transition tracking
- Error propagation analysis
- Performance bottlenecks identification
Usage
To use the code generation system with HoneyHive monitoring:
# Example usage
if __name__ == "__main__":
    question = "How can I use HoneyHive tracing with LangGraph?"
    solution = solve_coding_question(question)

    print("\n=== FINAL SOLUTION ===")
    print(f"\n{solution.prefix}\n")
    print(f"IMPORTS:\n{solution.imports}\n")
    print(f"CODE:\n{solution.code}")

    # This will end the current session in HoneyHive
    # For a new session, call HoneyHiveTracer.init() again
Key Features
- RAG Integration: HoneyHive traces document retrieval and processing
- Self-Correction: Monitors validation and improvement cycles
- Structured Output: Tracks schema compliance and data quality
- HoneyHive Tracing: Provides comprehensive monitoring and debugging
- Maximum Iterations: Tracks iteration counts and success rates
Best Practices
- Always set up proper environment variables before running
- Monitor the HoneyHive dashboard for:
- Performance metrics
- Error rates
- Cost analysis
- Usage patterns
- Adjust the max_depth parameter in RecursiveUrlLoader based on your needs
- Customize the reflection step based on your specific use case
- Implement proper error handling for production use
HoneyHive Dashboard Insights
The HoneyHive dashboard provides valuable insights:
- Performance Metrics:
- Response times
- Throughput
- Resource usage
- Error Tracking:
- Error rates
- Stack traces
- Error patterns
- Cost Analysis:
- API usage costs
- Resource consumption
- Cost optimization opportunities
- Usage Patterns:
- Peak usage times
- Common operations
- User behavior

Conclusion
This implementation provides a robust foundation for code generation with self-correction capabilities. The combination of LangGraph and HoneyHive tracing ensures reliable and monitored code generation processes. HoneyHive’s comprehensive tracing capabilities make it easier to:
- Debug issues
- Optimize performance
- Track costs
- Monitor quality
- Scale the system


