

1
Create a project
Go to HoneyHive Projects and click New Project. Name it
my-first-project.2
Get your API key
Go to Settings > Project > API Keys. The page opens on the Ingestion tab. Click Create API Key, name the key, and click Create Key. Copy the key from the dialog and store it as
HH_INGESTION_API_KEY - it is only shown once.An ingestion key can only send traces and events. To run experiments or read data back, also create a project API key on the Project tab and store it as HH_API_KEY. The SDK uses each key where it applies. See Ingestion keys.3
Install dependencies
Requires Python 3.11+.
4
Run this script
Create a new file called Run the script:
quickstart.py and paste the following code. It reads your ingestion API key from HH_INGESTION_API_KEY, so export that first (API keys are project-scoped).This quickstart keeps tracing setup simple: initialize the tracer first, then initialize the instrumentor with
tracer.provider.5
View your trace
Go to the Traces page in HoneyHive. Click on your trace to see the full request and response.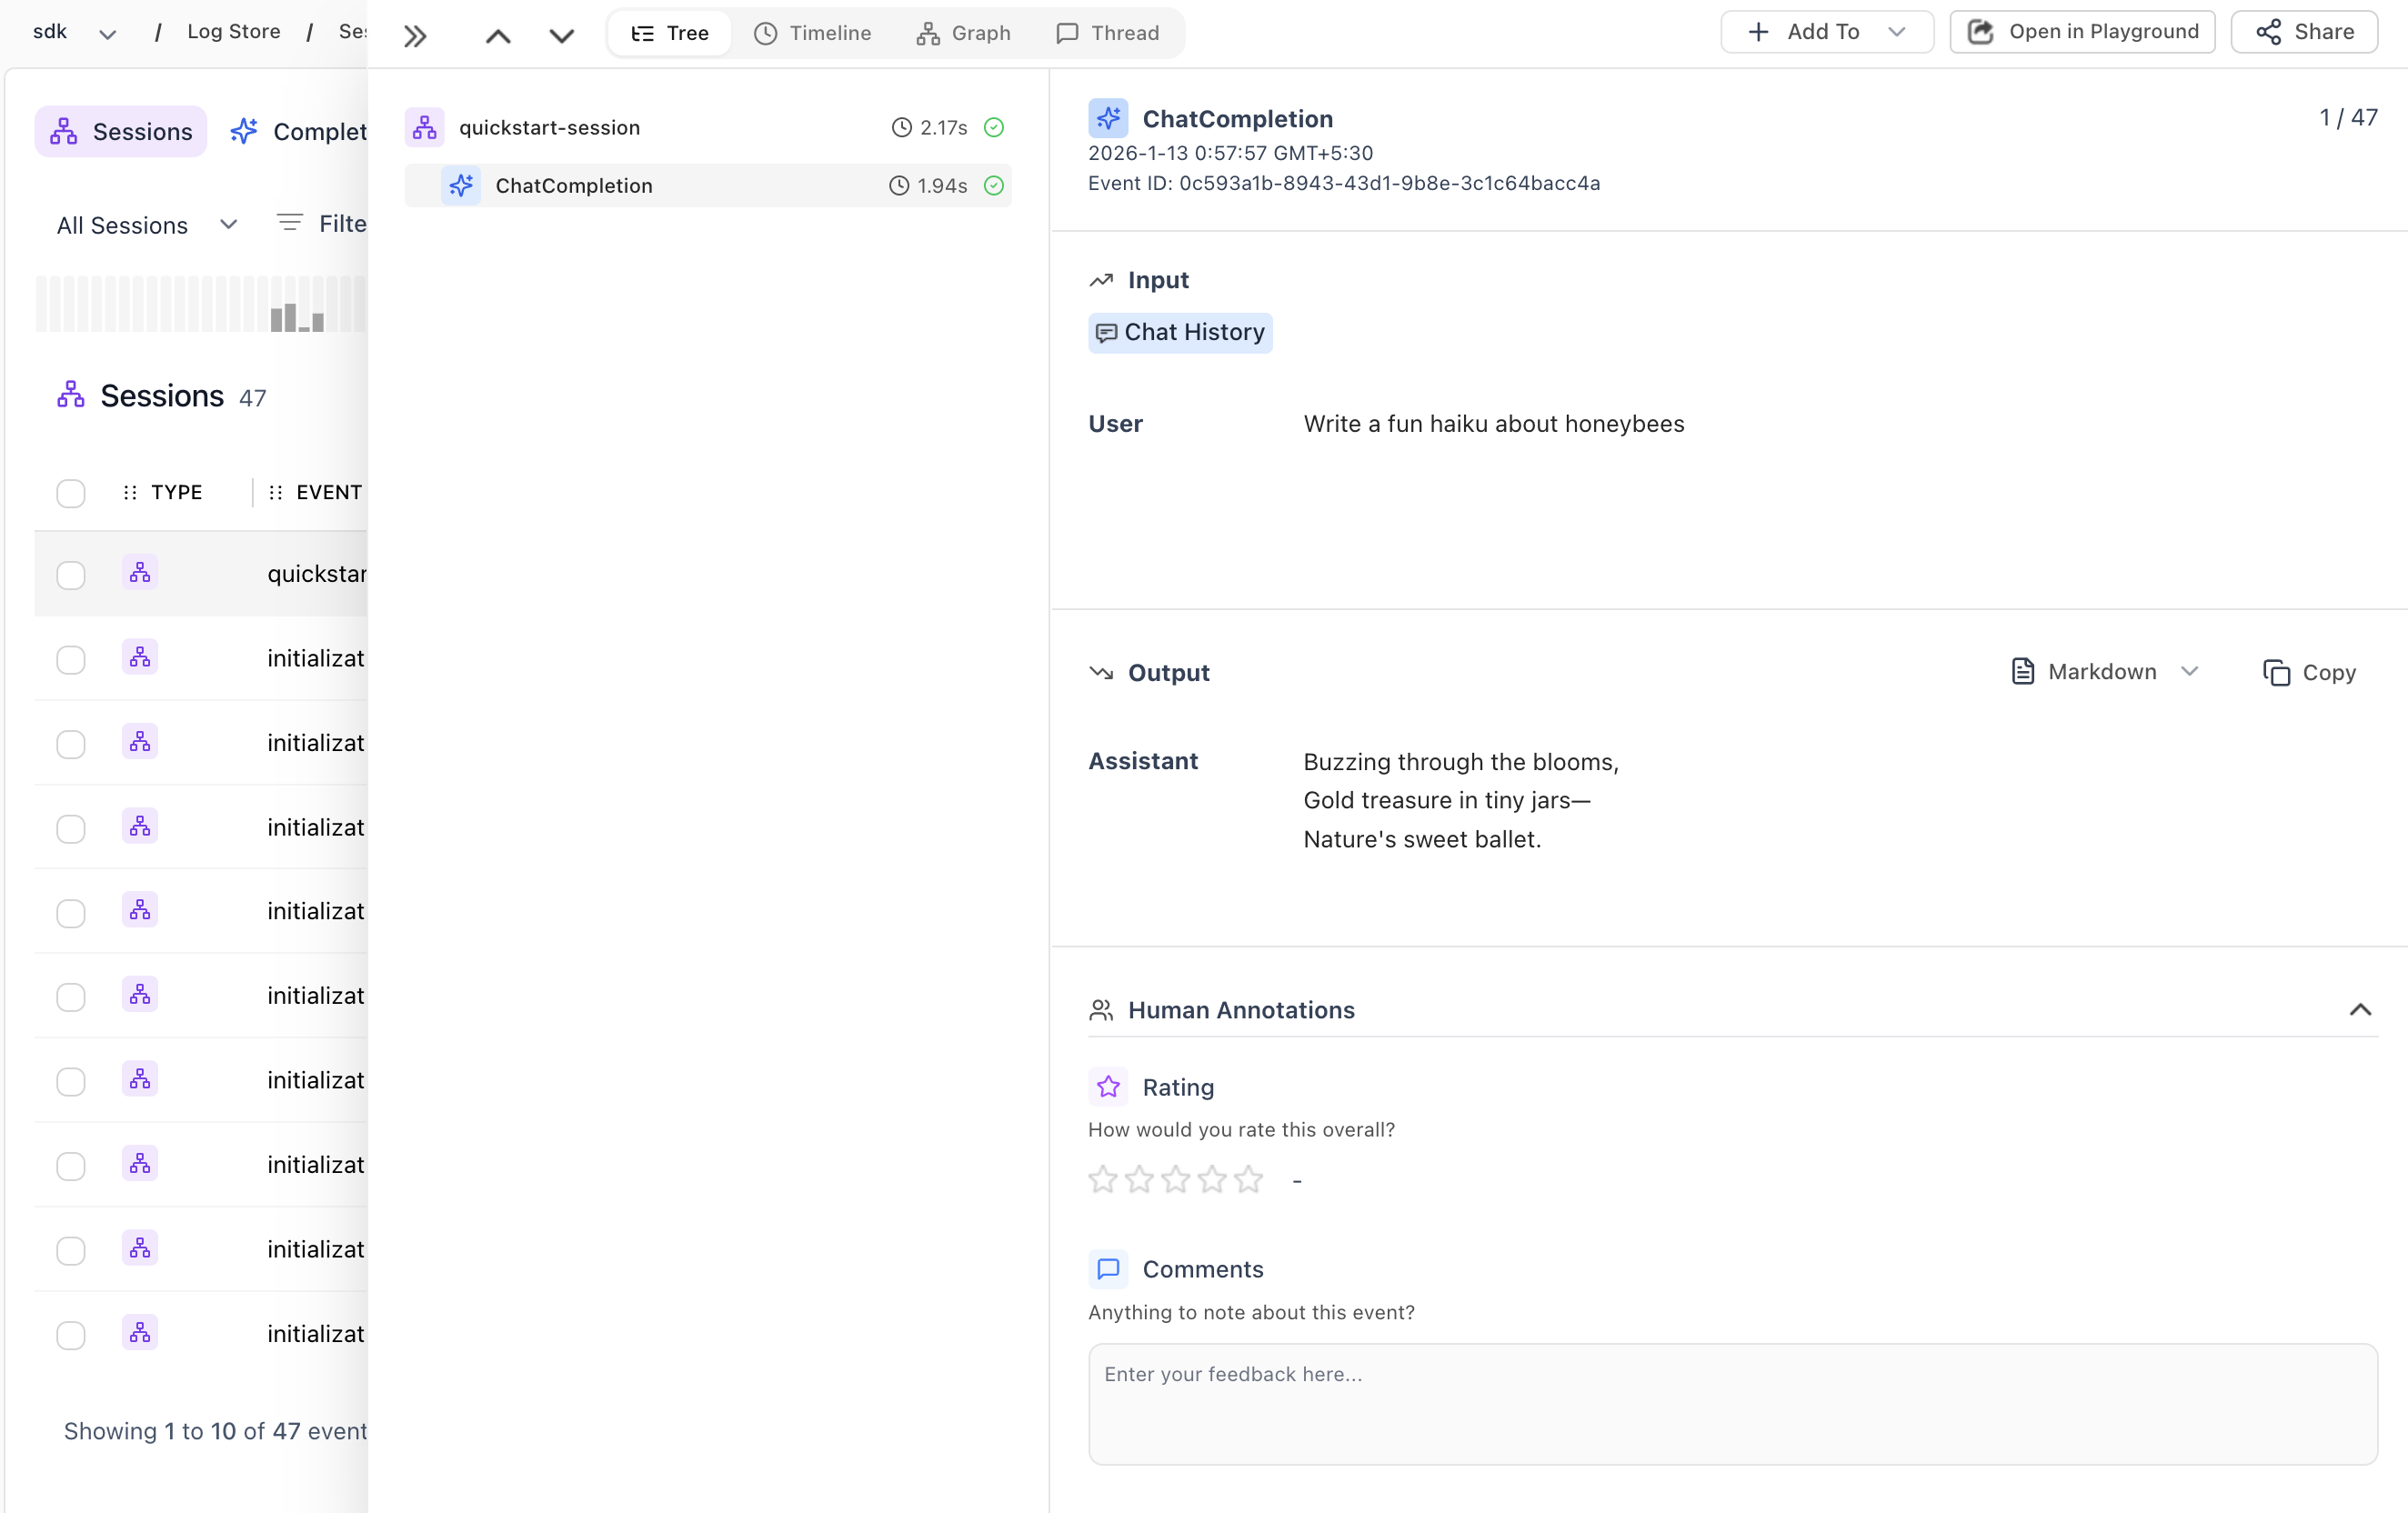
What should you do next?
Now that you’re tracing, try the Experiments Quickstart to run your first evaluation and compare prompt variations. To understand how HoneyHive structures sessions and events, read tracing concepts. To trace your own business logic beyond LLM calls, see custom spans.Choose runtime setup
See where to initialize the tracer for Lambda, web servers, and script-style apps.
Add more providers
Trace Anthropic, Google, AWS Bedrock, and more.
Trace custom functions
Use decorators to trace your own business logic.
Enrich your traces
Add feedback, metadata, and user information.
Run evaluations
Set up automated evaluations on your traces.