Documentation Index
Fetch the complete documentation index at: https://docs.honeyhive.ai/llms.txt
Use this file to discover all available pages before exploring further.
Learn how to integrate Qdrant with HoneyHive for vector database monitoring and tracing in RAG applications.
Qdrant
Qdrant is an open-source vector database optimized for storing and searching high-dimensional vectors. By integrating Qdrant with HoneyHive, you can:
- Trace vector database operations
- Monitor latency, embedding quality, and context relevance
- Evaluate retrieval performance in your RAG pipelines
- Optimize paramaters such as
chunk_size or chunk_overlap
Prerequisites
- A HoneyHive account and API key
- Python 3.8+
- Basic understanding of vector databases and RAG pipelines
Installation
Install the required packages:
pip install qdrant-client openai honeyhive
Basic Integration Example
The following example demonstrates a complete RAG pipeline with HoneyHive tracing for Qdrant operations. We’ll break down each component step by step.
Initialize Clients and Setup
First, set up the necessary clients and configuration for HoneyHive, OpenAI, and Qdrant:
from qdrant_client import QdrantClient
from qdrant_client.http.models import PointStruct, VectorParams, Distance
import openai
import os
from honeyhive.tracer import HoneyHiveTracer
from honeyhive.tracer.custom import trace
from openai import OpenAI

# Set API Keys
openai.api_key = os.getenv("OPENAI_API_KEY")
honeyhive_api_key = os.getenv("HONEYHIVE_API_KEY")

# Initialize HoneyHive Tracer
HoneyHiveTracer.init(
    api_key=honeyhive_api_key,
    project="qdrant-rag-example",
    session_name="qdrant-integration-demo"
)

# Initialize OpenAI client
openai_client = OpenAI(api_key=openai.api_key)
Connect to Qdrant
You can connect to Qdrant in two ways: self-hosted (local) or cloud-hosted (Qdrant Cloud):
Option 1: Self-Hosted Qdrant (Local)
To run Qdrant locally, you need to have Docker installed and run the following command:
docker pull qdrant/qdrant
docker run -p 6333:6333 -p 6334:6334 -v "$(pwd)/qdrant_storage:/qdrant/storage" qdrant/qdrant
# Connect to local Qdrant
client = QdrantClient(url="http://localhost:6333")
print("Connected to local Qdrant instance")
Option 2: Qdrant Cloud
For Qdrant Cloud, you’ll need your cluster host and API key:
# Qdrant Cloud configuration
QDRANT_HOST = os.getenv("QDRANT_HOST")  # e.g., "your-cluster-id.eu-central.aws.cloud.qdrant.io"
QDRANT_API_KEY = os.getenv("QDRANT_API_KEY")

# Connect to Qdrant Cloud
client = QdrantClient(url=QDRANT_HOST, api_key=QDRANT_API_KEY)
print("Connected to Qdrant Cloud")
Create a Collection
Create a collection to store document embeddings:
collection_name = "documents"
vector_size = 1536  # For text-embedding-3-small
vector_distance = Distance.COSINE

# Create collection if it doesn't exist
if not client.collection_exists(collection_name):
    client.create_collection(
        collection_name=collection_name,
        vectors_config=VectorParams(size=vector_size, distance=vector_distance)
    )
Define Embedding Function with Tracing
Create a function to generate embeddings with HoneyHive tracing:
@trace()
def embed_text(text: str) -> list:
    """Generate embeddings for a text using OpenAI's API."""
    response = openai_client.embeddings.create(
        model="text-embedding-3-small",
        input=text
    )
    return response.data[0].embedding
Insert Documents with Tracing
Create a function to insert documents into Qdrant with tracing:
@trace()
def insert_documents(docs):
    """Insert documents into Qdrant collection."""
    points = []
    for idx, doc in enumerate(docs):
        vector = embed_text(doc)
        points.append(PointStruct(
            id=idx + 1,
            vector=vector,
            payload={"text": doc}
        ))

    client.upsert(
        collection_name=collection_name,
        points=points
    )
    return len(points)

# Sample documents
documents = [
    "Qdrant is a vector database optimized for storing and searching high-dimensional vectors.",
    "HoneyHive provides observability for AI applications, including RAG pipelines.",
    "Retrieval-Augmented Generation (RAG) combines retrieval systems with generative models.",
    "Vector databases like Qdrant are essential for efficient similarity search in RAG systems.",
    "OpenAI's embedding models convert text into high-dimensional vectors for semantic search."
]

# Insert documents
num_inserted = insert_documents(documents)
Retrieve Documents with Tracing
Create a function to retrieve relevant documents from Qdrant with tracing:
@trace()
def get_relevant_docs(query: str, top_k: int = 3) -> list:
    """Retrieve relevant documents for a query."""
    # Embed the query
    q_vector = embed_text(query)

    # Search in Qdrant
    search_response = client.query_points(
        collection_name=collection_name,
        query=q_vector,
        limit=top_k,
        with_payload=True
    )

    # Extract results
    docs = []
    for point in search_response.points:
        docs.append({
            "id": point.id,
            "text": point.payload.get("text"),
            "score": point.score
        })

    return docs
Generate Response with Tracing
Create a function to generate a response using OpenAI with tracing:
@trace()
def answer_query(query: str, relevant_docs: list) -> str:
    """Generate an answer for a query using retrieved documents."""
    if not relevant_docs:
        return "Could not retrieve relevant documents to answer the query."

    # Format context from retrieved documents
    context_parts = []
    for i, doc in enumerate(relevant_docs):
        context_parts.append(f"Document {i+1} (ID: {doc['id']}, Score: {doc['score']:.4f}):\n{doc['text']}")
    context = "\n\n".join(context_parts)

    # Create prompt
    prompt = f"""Answer the question based ONLY on the following context:

Context:
{context}

Question: {query}

Answer:"""

    # Generate answer
    completion = openai_client.chat.completions.create(
        model="gpt-4o-mini",
        messages=[
            {"role": "system", "content": "You are a helpful assistant that answers questions based strictly on the provided context. If the answer is not in the context, say so clearly."},
            {"role": "user", "content": prompt}
        ],
        temperature=0.2
    )

    return completion.choices[0].message.content.strip()
Complete RAG Pipeline
Create a function to run the complete RAG pipeline with tracing:
@trace()
def rag_pipeline(query: str) -> dict:
    """End-to-end RAG pipeline."""
    # Get relevant documents
    relevant_docs = get_relevant_docs(query)

    # Generate answer
    answer = answer_query(query, relevant_docs)

    return {
        "query": query,
        "answer": answer,
        "retrieved_documents": relevant_docs
    }
Batch Processing
For larger document sets, you can use batch processing to improve performance:
@trace()
def batch_insert_documents(documents_to_insert, batch_size=10, start_id_offset=0):
    """Insert documents in batches."""
    total_inserted = 0

    for i in range(0, len(documents_to_insert), batch_size):
        batch_docs = documents_to_insert[i:i+batch_size]
        points = []

        for local_idx, doc in enumerate(batch_docs):
            relative_idx = i + local_idx
            vector = embed_text(doc)
            point_id = relative_idx + start_id_offset + 1
            points.append(PointStruct(
                id=point_id,
                vector=vector,
                payload={"text": doc}
            ))

        if points:
            client.upsert(
                collection_name=collection_name,
                points=points
            )
            total_inserted += len(points)

    return total_inserted
Test the RAG Pipeline
Here’s how to test the complete RAG pipeline:
# Test query
test_query = "What is Qdrant used for?"
result = rag_pipeline(test_query)

print(f"Query: {result['query']}")
print(f"Answer: {result['answer']}")
print("\nRetrieved Documents:")
for i, doc in enumerate(result['retrieved_documents']):
    print(f"Document {i+1} (ID: {doc['id']}, Score: {doc['score']:.4f}): {doc['text']}")
Viewing Traces in HoneyHive
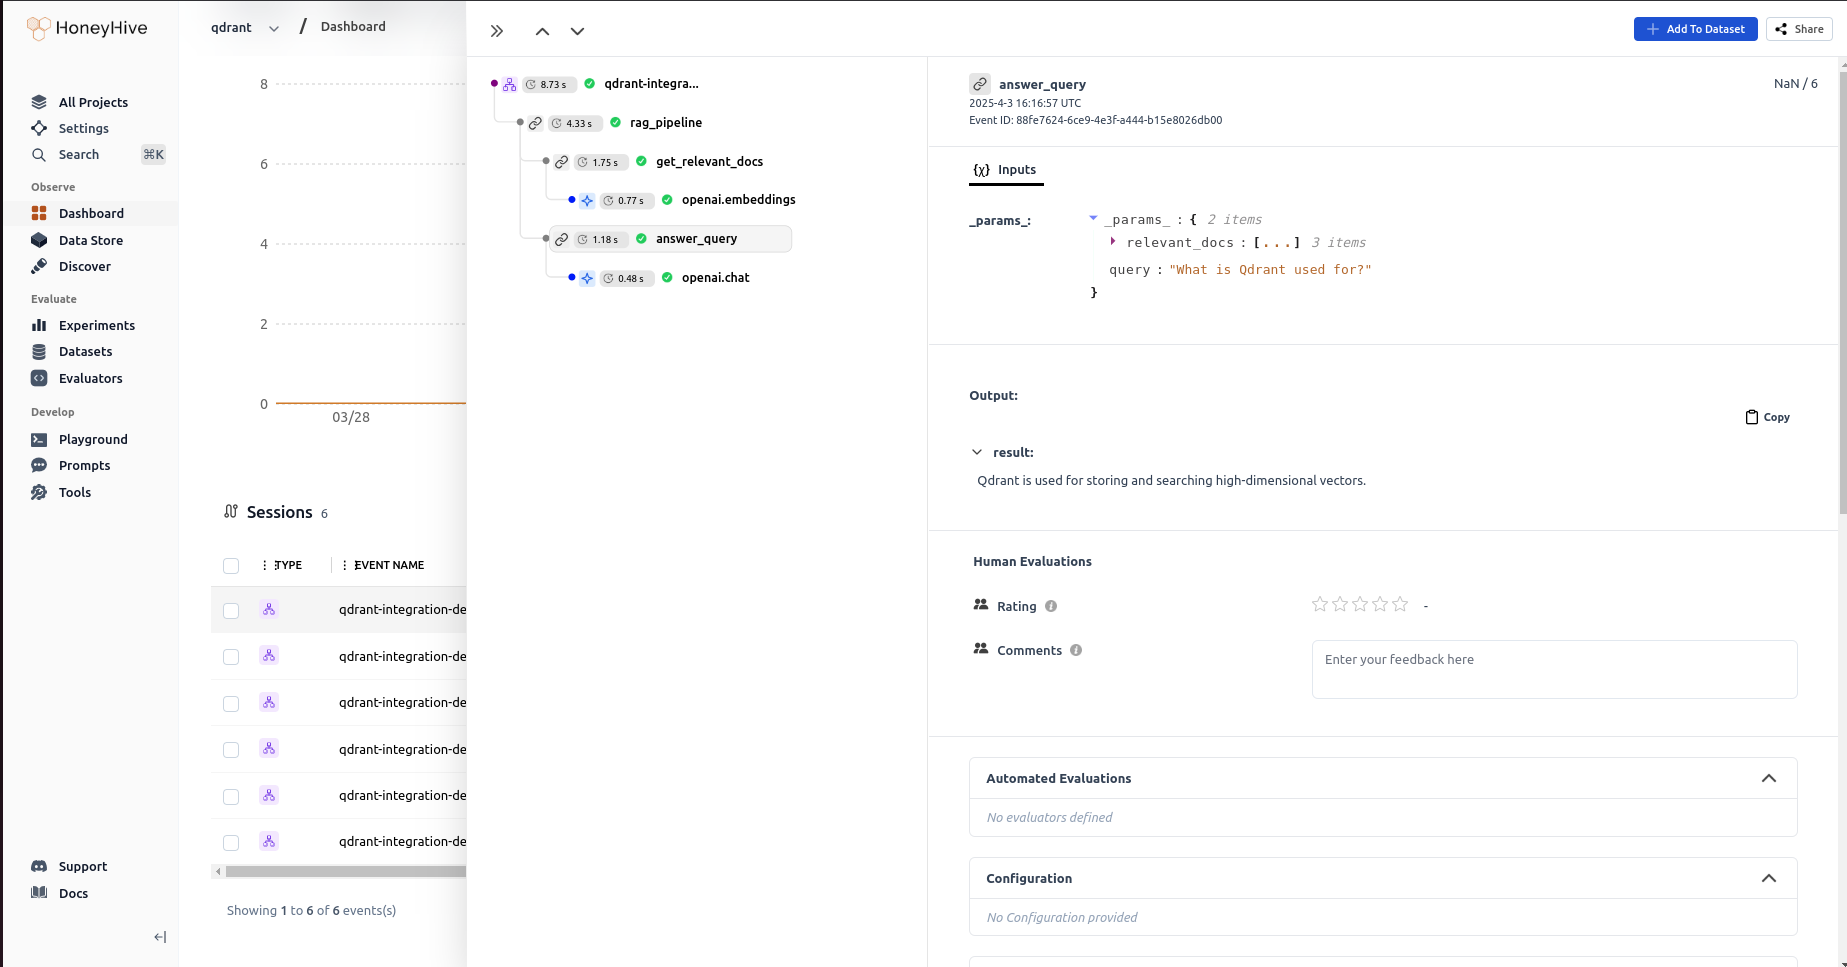
After running your RAG pipeline with Qdrant, you can view the traces in the HoneyHive UI:
- Navigate to your project in the HoneyHive dashboard
- Click on the “Traces” tab to see all the traces from your RAG pipeline
- Click on a specific trace to see detailed information about each step in the pipeline
- Analyze the performance of your vector operations, embeddings, and retrieval processes
 With HoneyHive, you can easily monitor and optimize your Qdrant-powered RAG pipeline, ensuring that it delivers the best possible results for your users.
Visit the Qdrant documentation and the HoneyHive documentation.
 With HoneyHive, you can easily monitor and optimize your Qdrant-powered RAG pipeline, ensuring that it delivers the best possible results for your users.
Visit the Qdrant documentation and the HoneyHive documentation.
