What You Can Monitor
- Performance metrics: Latency, error rates, and API response times
- Quality metrics: Evaluator scores, safety violations, and content quality
- Business metrics: Usage costs, request volumes, and user satisfaction
- Custom fields: Any metric or metadata field in your events and sessions
Understanding Alert States
- Active: Normal monitoring - alert is checking thresholds regularly
- Triggered: Threshold exceeded, notifications sent, investigation needed
- Resolved: Issue cleared, alert returning to normal monitoring
- Paused: Monitoring temporarily stopped (manual action required to resume)
- Muted: Still monitoring but notifications disabled
Alert Types
Aggregate Alerts: Monitor when metrics cross absolute thresholds (e.g., “Alert when average toxicity score exceeds 30%”)Alert Actions
Pause an Alert- Temporarily stop monitoring (useful during maintenance)
- No threshold checks or notifications until resumed
- Keeps all configuration for easy restart
- Continue monitoring but silence notifications
- Alert still evaluates and tracks state changes
- Perfect when you’re already aware of an ongoing issue
- Manually clear a triggered alert
- Moves back to active monitoring immediately
- Sends resolution notification to keep team informed
- Permanently remove the alert and all its history
- Cannot be undone - use carefully
- Clean up alerts that are no longer relevant
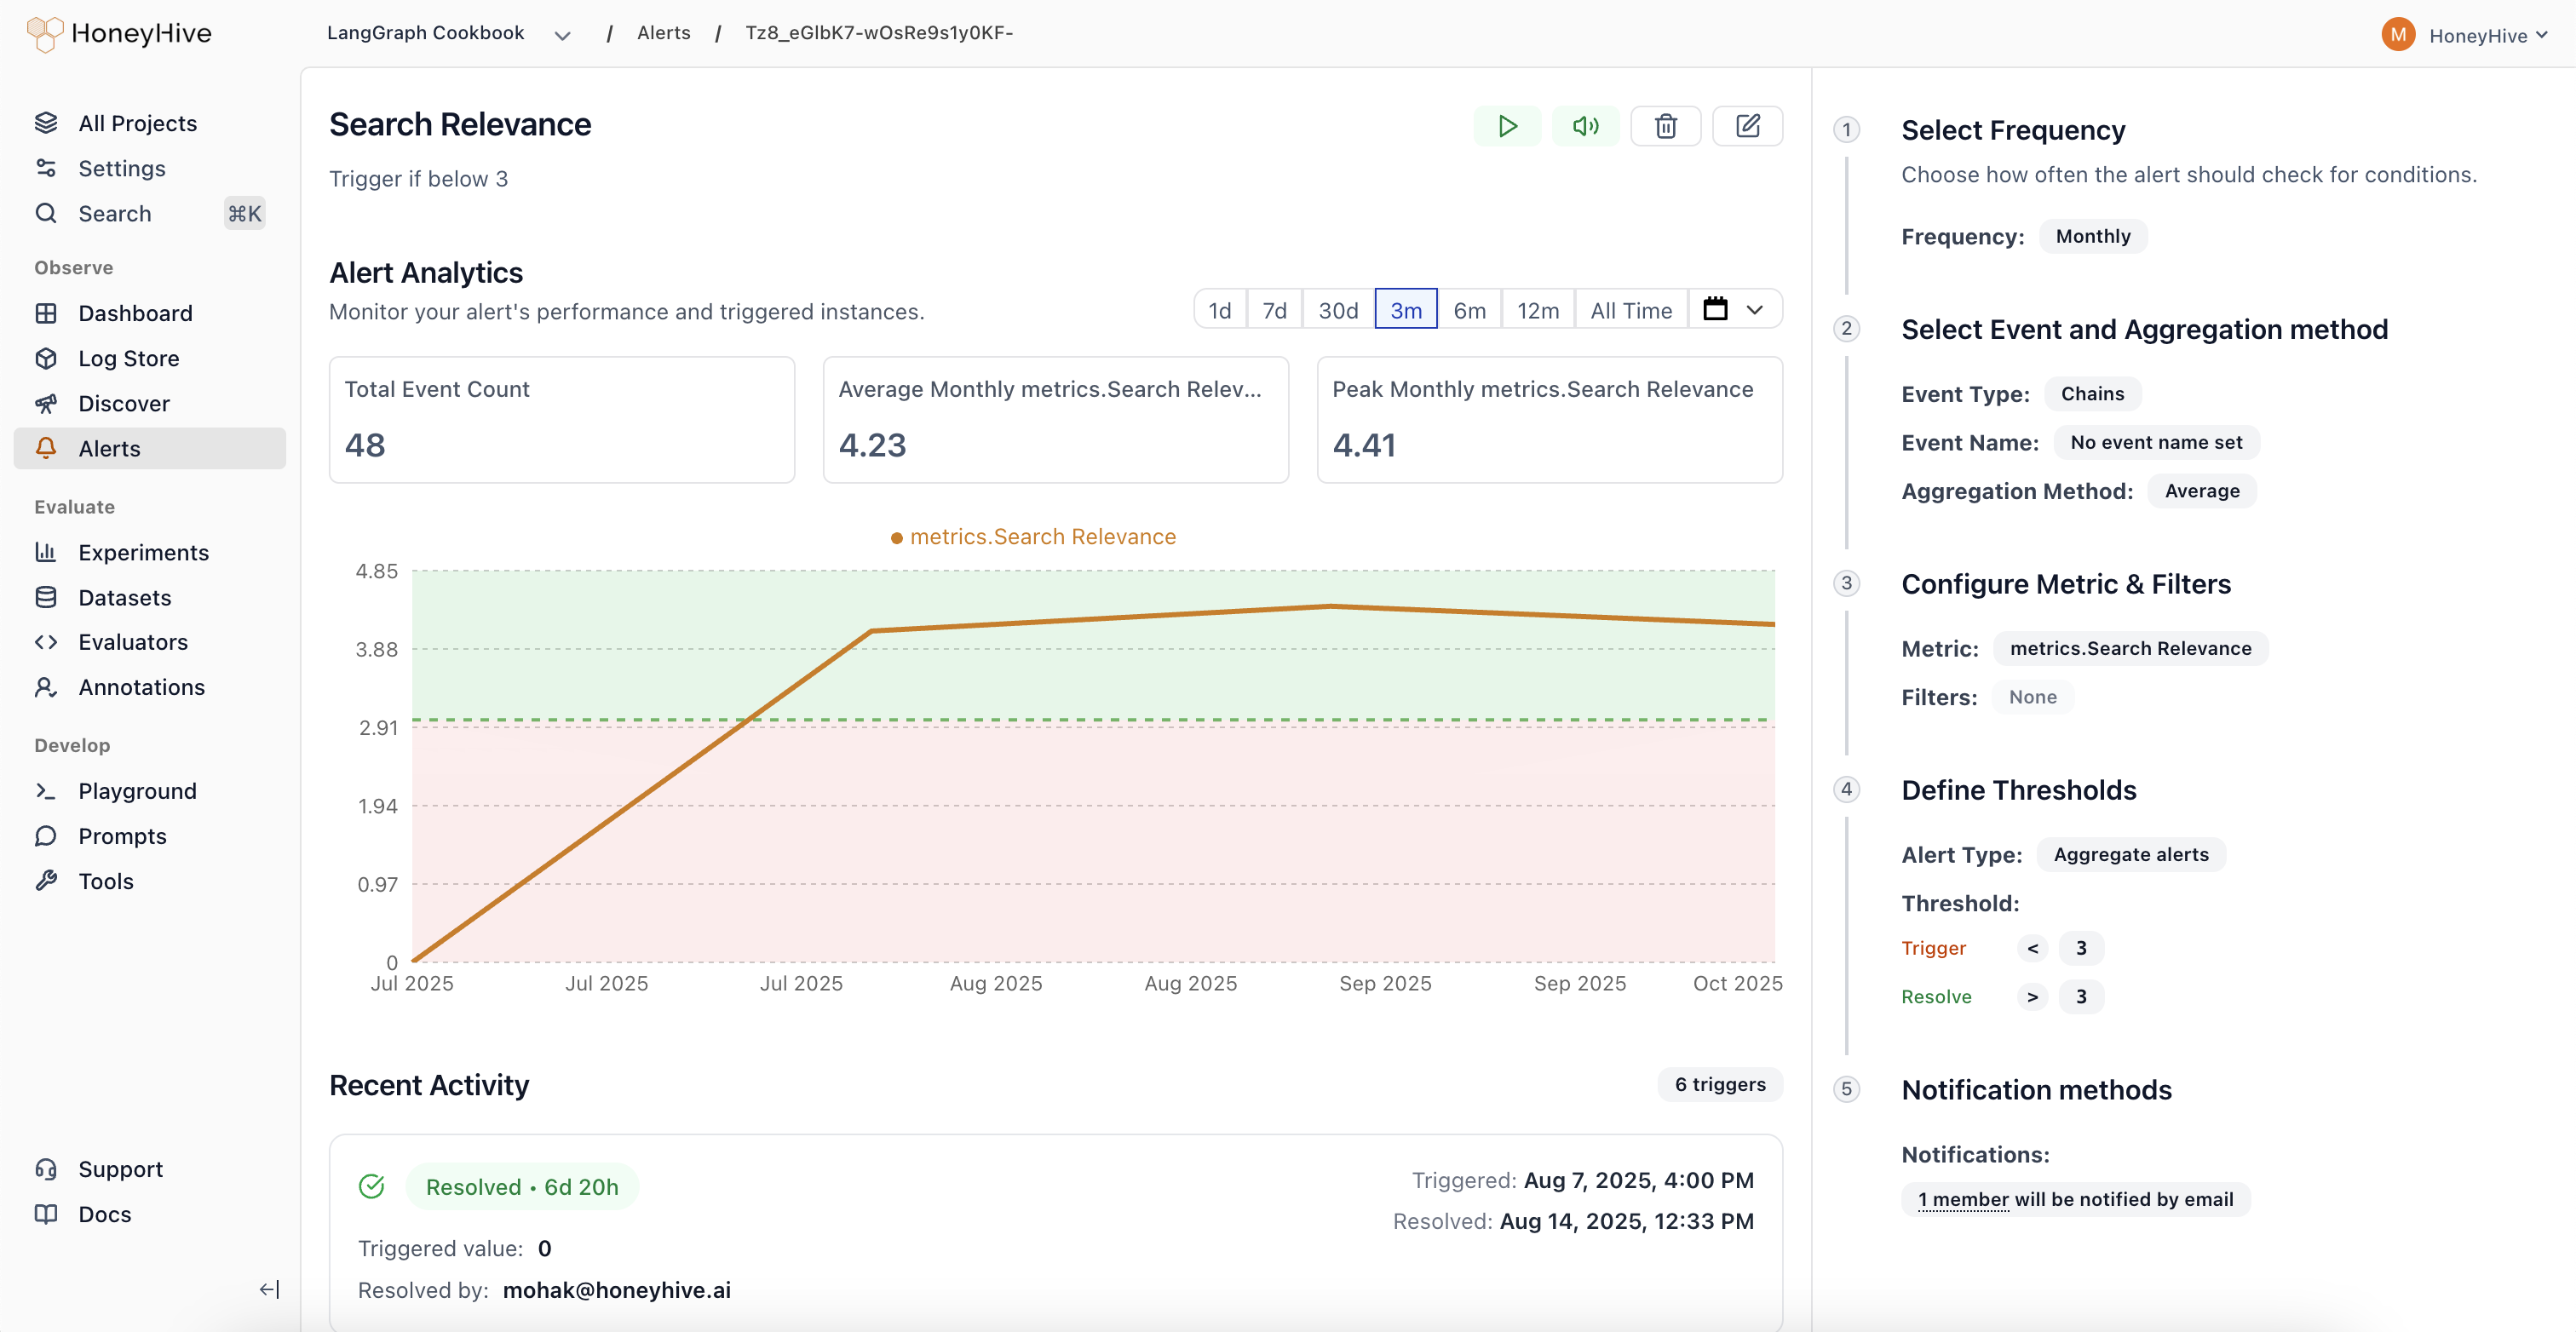
Investigating Triggered Alerts
When an alert triggers, you’ll receive a notification with:- The actual metric value that caused the trigger
- A direct link to the alert investigation page
- Context about when the threshold was crossed
- Real-time chart: Visual trend showing how the metric changed over time
- Triggering events: Sample events that contributed to the alert
- Historical context: Previous triggers and patterns
- Quick actions: Resolve, mute, or escalate the alert
Common Alert Patterns
Error Rate Monitoring- Monitor when error rates spike above normal levels
- Set up both absolute thresholds (>5%) and drift detection (50% increase)
- Track P95 latency to ensure user experience remains smooth
- Alert when response times exceed acceptable limits
- Monitor daily API spend to prevent budget overruns
- Set both warning and critical thresholds
- Track evaluation scores to catch model performance degradation
- Alert on safety violations or content quality issues
Tips for Effective Alerting
- Start with critical metrics: Focus on what directly impacts users first
- Avoid alert fatigue: Set appropriate thresholds that indicate real problems
- Use both types: Combine absolute thresholds with drift detection for comprehensive coverage
- Test your alerts: Verify they trigger correctly and provide actionable information
- Review regularly: Adjust thresholds as your application evolves