Documentation Index
Fetch the complete documentation index at: https://docs.honeyhive.ai/llms.txt
Use this file to discover all available pages before exploring further.
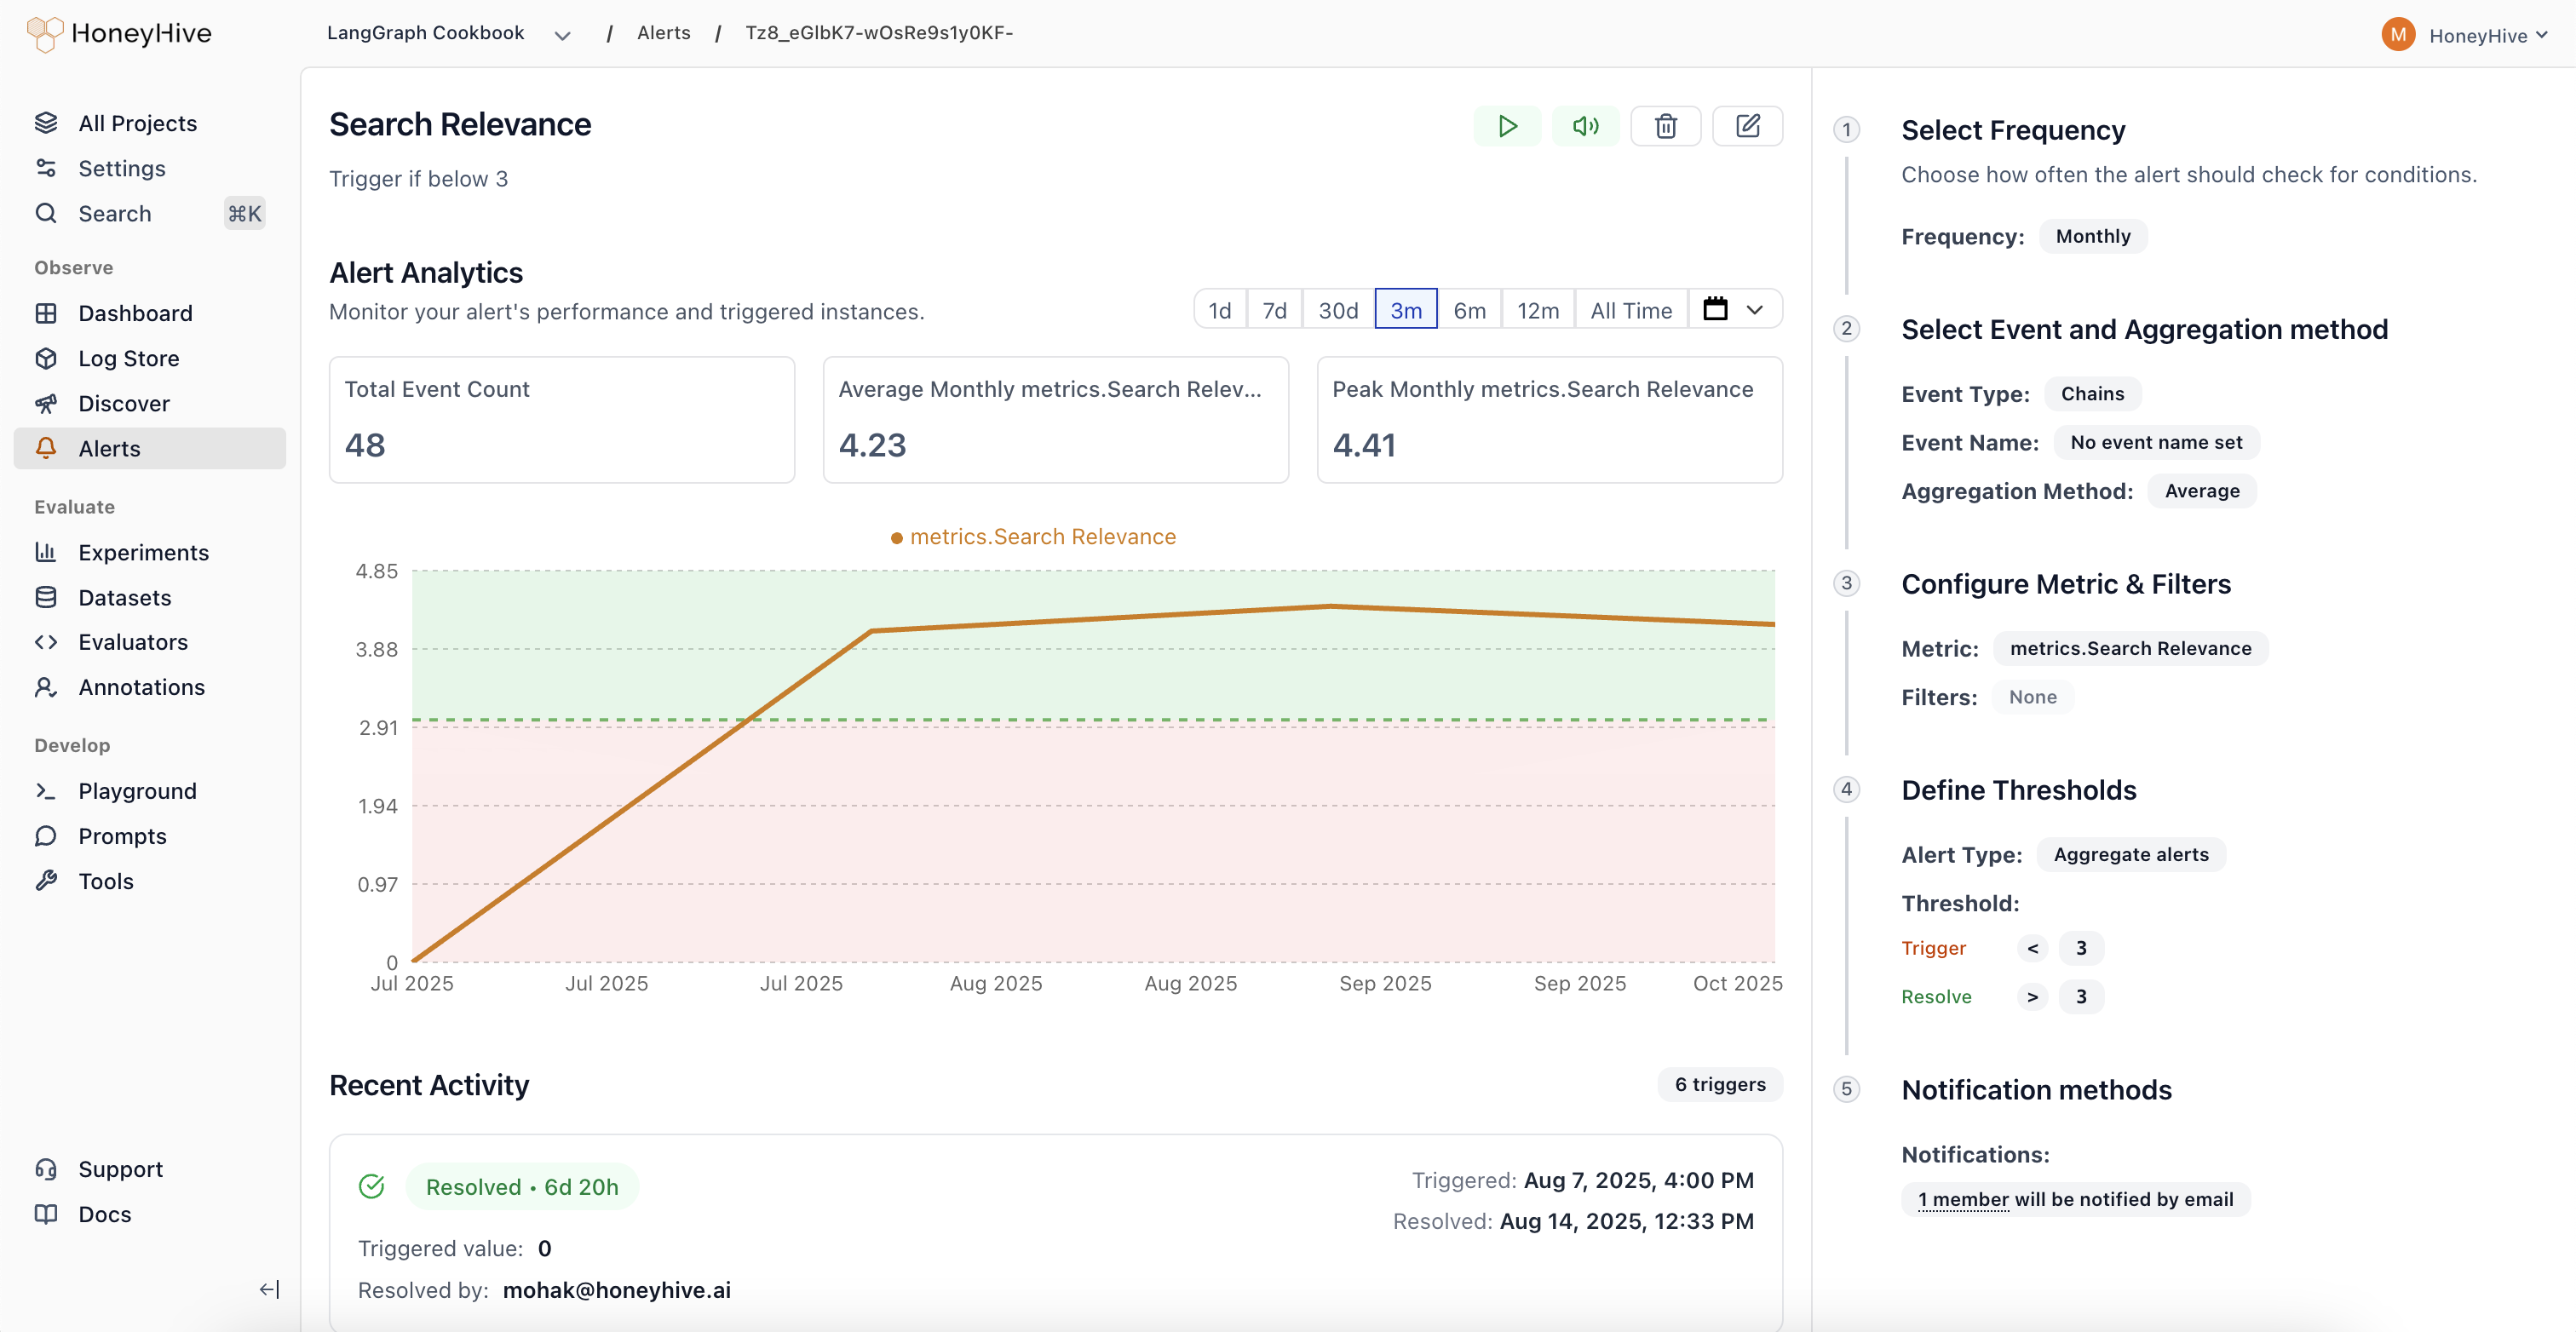
Alert Page Components
- The chart displays a real-time preview of your alert. Adjusting the date does not impact the alert configuration
- The right panel is where you configure the alert or view the saved configuration
- Action buttons at the top allow you to pause, mute, resolve, or delete the alert
- Recent activity at the bottom shows a list of triggered events for this alert
Quick Start: Building Your First Alert
Name and describe your alert
Give your alert a clear name and description so your team knows what it monitors.
Choose monitoring frequency
Select how often to evaluate your alert:
- Hourly: Checked every hour for immediate detection
- Daily: Checked every hour but evaluated over daily periods
- Weekly: Checked daily but evaluated over weekly periods
- Monthly: Checked daily but evaluated over monthly periods
Select what to monitor
Event Type: Choose the data source for your alert
- Models: Individual LLM API calls and completions
- Sessions: Complete user conversations or workflows
- Tools: Function calls and external integrations
- Chains: Multi-step workflows and complex pipelines
- Filter by event name, tenant, or any custom metadata
- Example: Only monitor production traffic or specific model versions
Define the metric and aggregation
Metric: What to measure (latency, error rate, custom evaluator scores, etc.)Aggregation: How to summarize the data
- COUNT: Total number of events
- AVERAGE: Mean value across events
- P90/P95/P99: Percentile values for performance monitoring
- SUM: Total of all values
- MIN/MAX: Extreme values
- MEDIAN: Middle value
Set alert thresholds
For Aggregate Alerts: Set the threshold value and comparison operator
- Example: “Average latency > 2 seconds”
- Example: “Current period is 25% worse than previous period”
Managing Your Alerts