Looking for the latest HoneyHive docs? See HoneyHive v2.
- Model inference calls as
modelevents - External API calls (like retrieval) as
toolevents - Collections of workflow steps as
chainevents - An entire trace of requests as a
session, which includes back-and-forth user turns
Logging a Trace
We use OpenTelemetry to automatically instrument your AI application. You can find the full list of supported packages here.
- You have already created a project in HoneyHive, as explained here.
- You have an API key for your project, as explained here.
1
Installation
To install our SDKs, run the following commands in the shell.
2
Authenticate the SDK & initialize the tracer
Initializing the
HoneyHiveTracer marks the beginning of your session and allows you to begin tracing your program.
To initialize, pass the following parameters:api_key: Get your API key from HoneyHive Account Settings.project: Create a project from HoneyHive Projects.- (optional)
source: An environment variable for the trace, e.g. “prod”, “dev”, etc. Defaults to “dev”. - (optional)
session_name: A custom name for your agent session. Defaults to the main module name.
server_url: The private HoneyHive endpoint found in the Settings page in the HoneyHive app.
3
Trace any custom spans using function decorators
The above initialization will auto-capture all interactions with our supported providers.To capture anything else, you can trace any function in your code and see its inputs, outputs, errors, duration, etc. by decorating it as follows.
The following method isn’t compatible with the LangChain callback handlers.
View the trace
Now that you have successfully traced your session, you can review it in the platform. Navigate to Log Store and click to view any trace.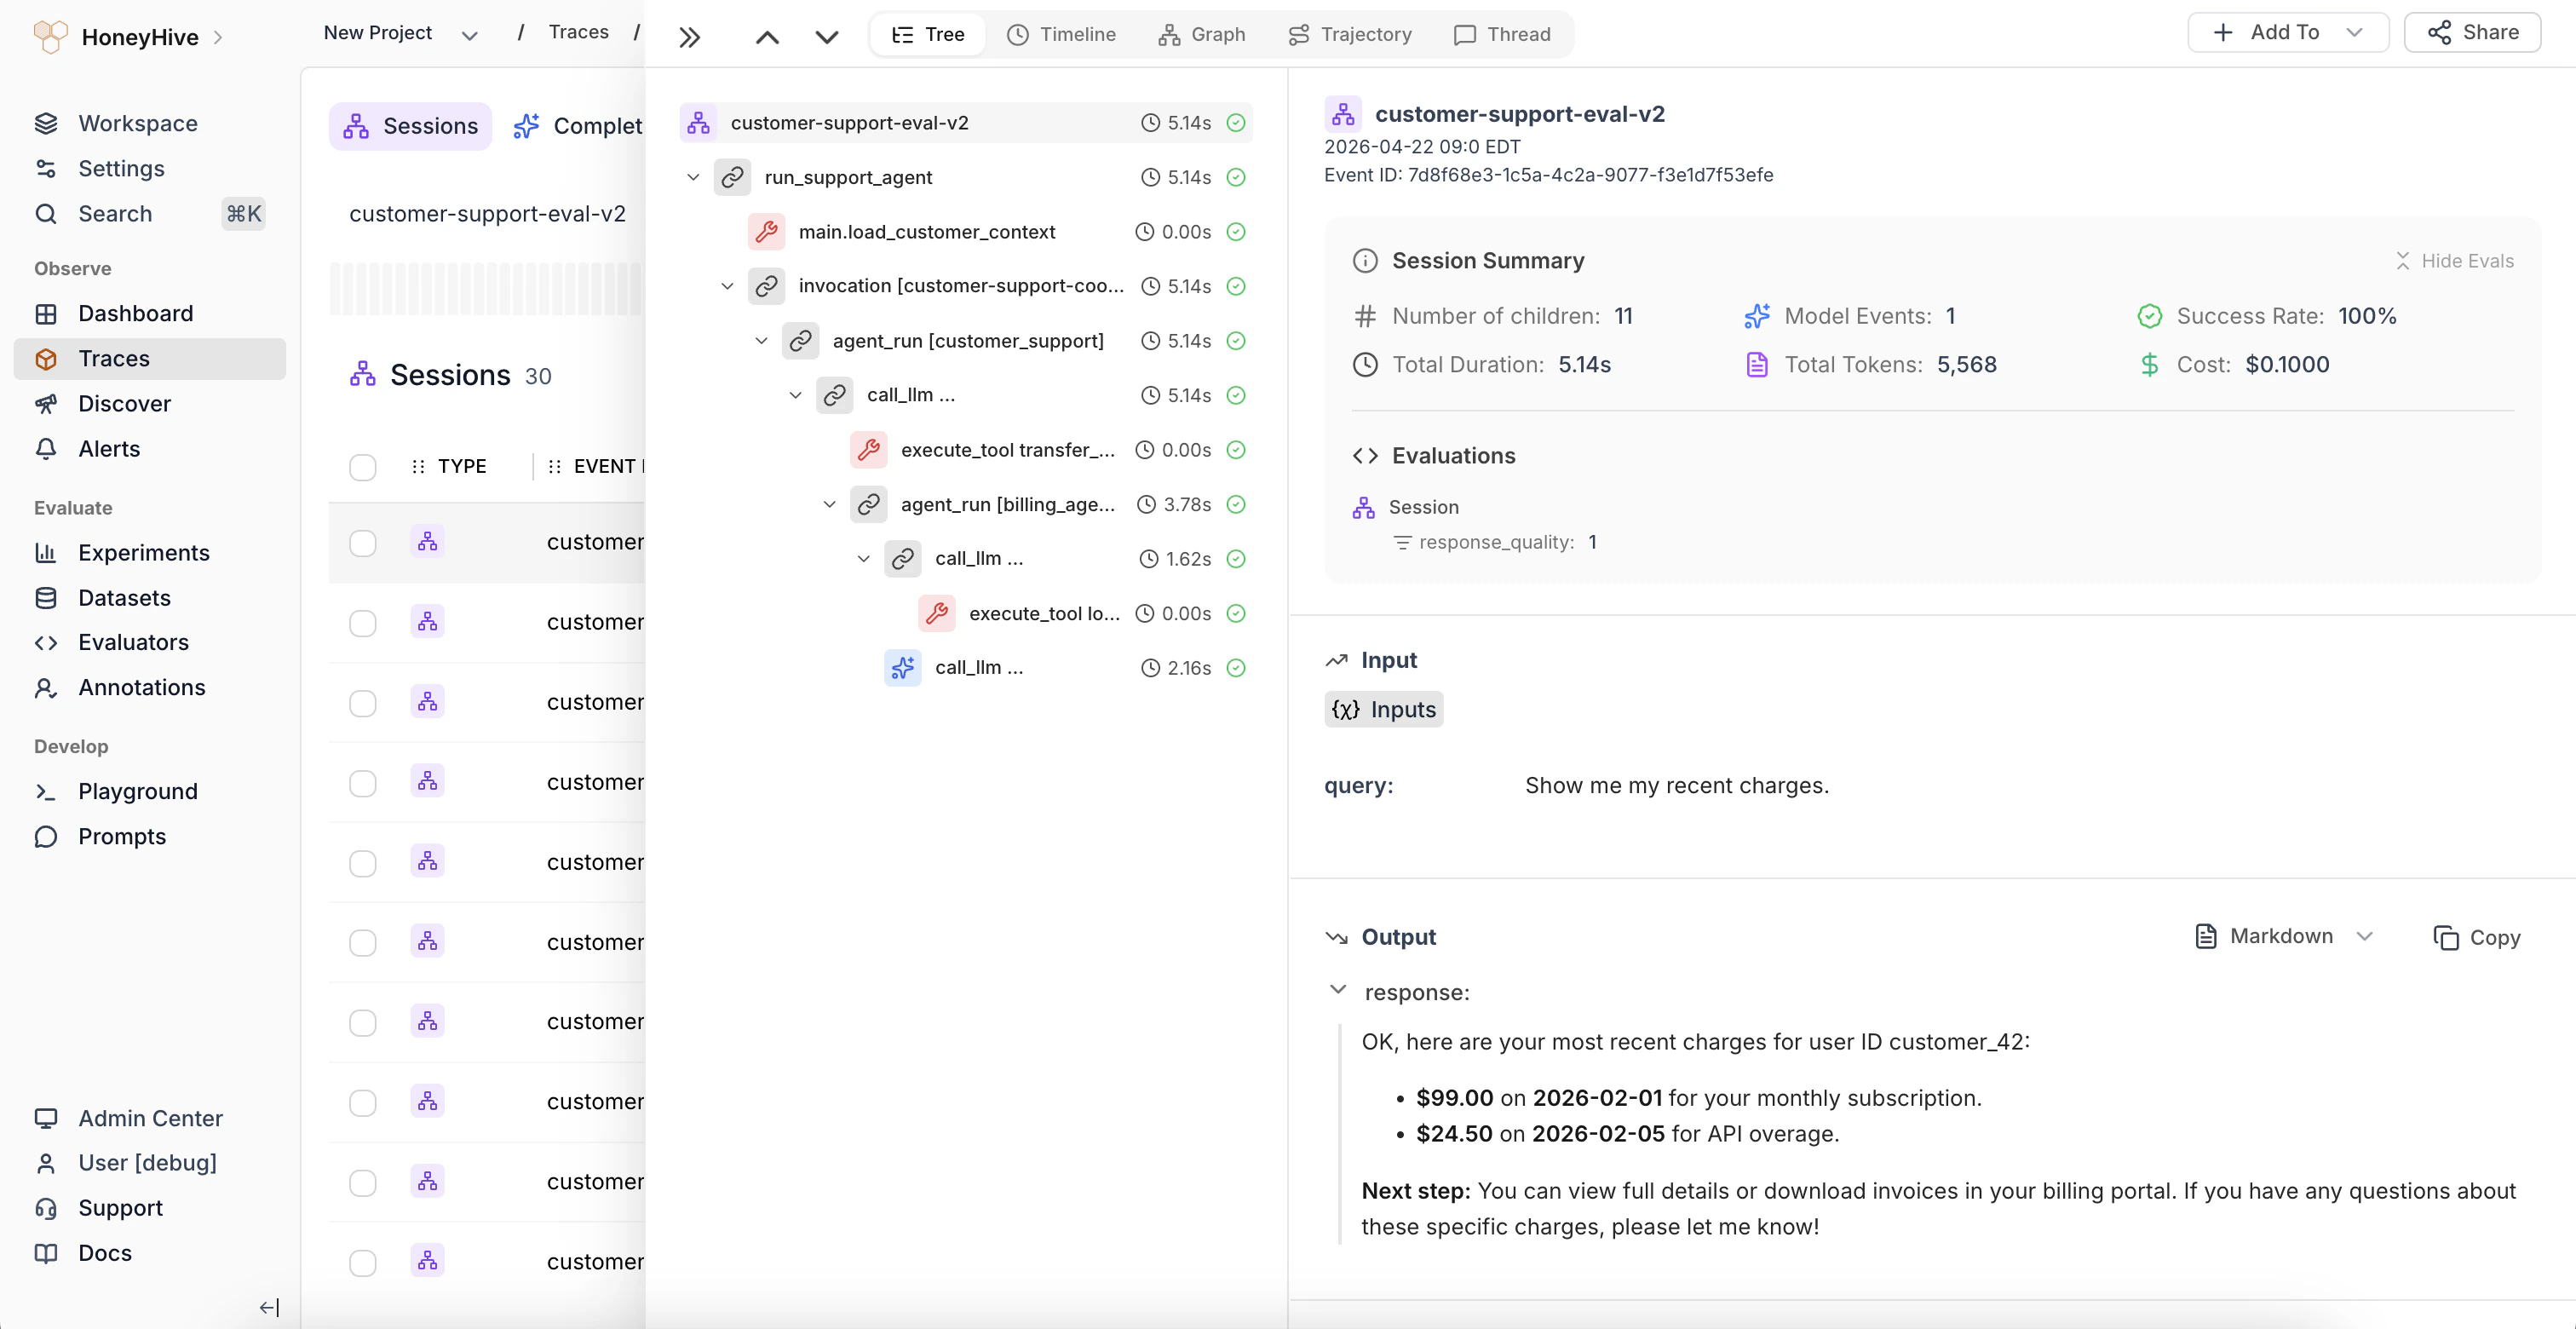
Learn more
Observability Tutorial
An end-to-end tutorial for tracing a complex RAG application with the tracer.
Tracer Troubleshooting
Learn how to troubleshoot common issues with our tracers.
Enriching Traces
How to add feedback, metrics, metadata, and more to traces.
Data Model Overview
Learn how HoneyHive’s core data model works.