- Python
- TypeScript
While the HoneyHive tracer automatically instruments all of the most common LLM application components, you might sometimes want to trace parts of your code beyond the automated coverage.To do this, you can use HoneyHive’s manual tracing tools, which we’ll walk through in this guide.Enriching During Execution Using
You can also enrich your traces and custom spans with various propertires during execution using the The 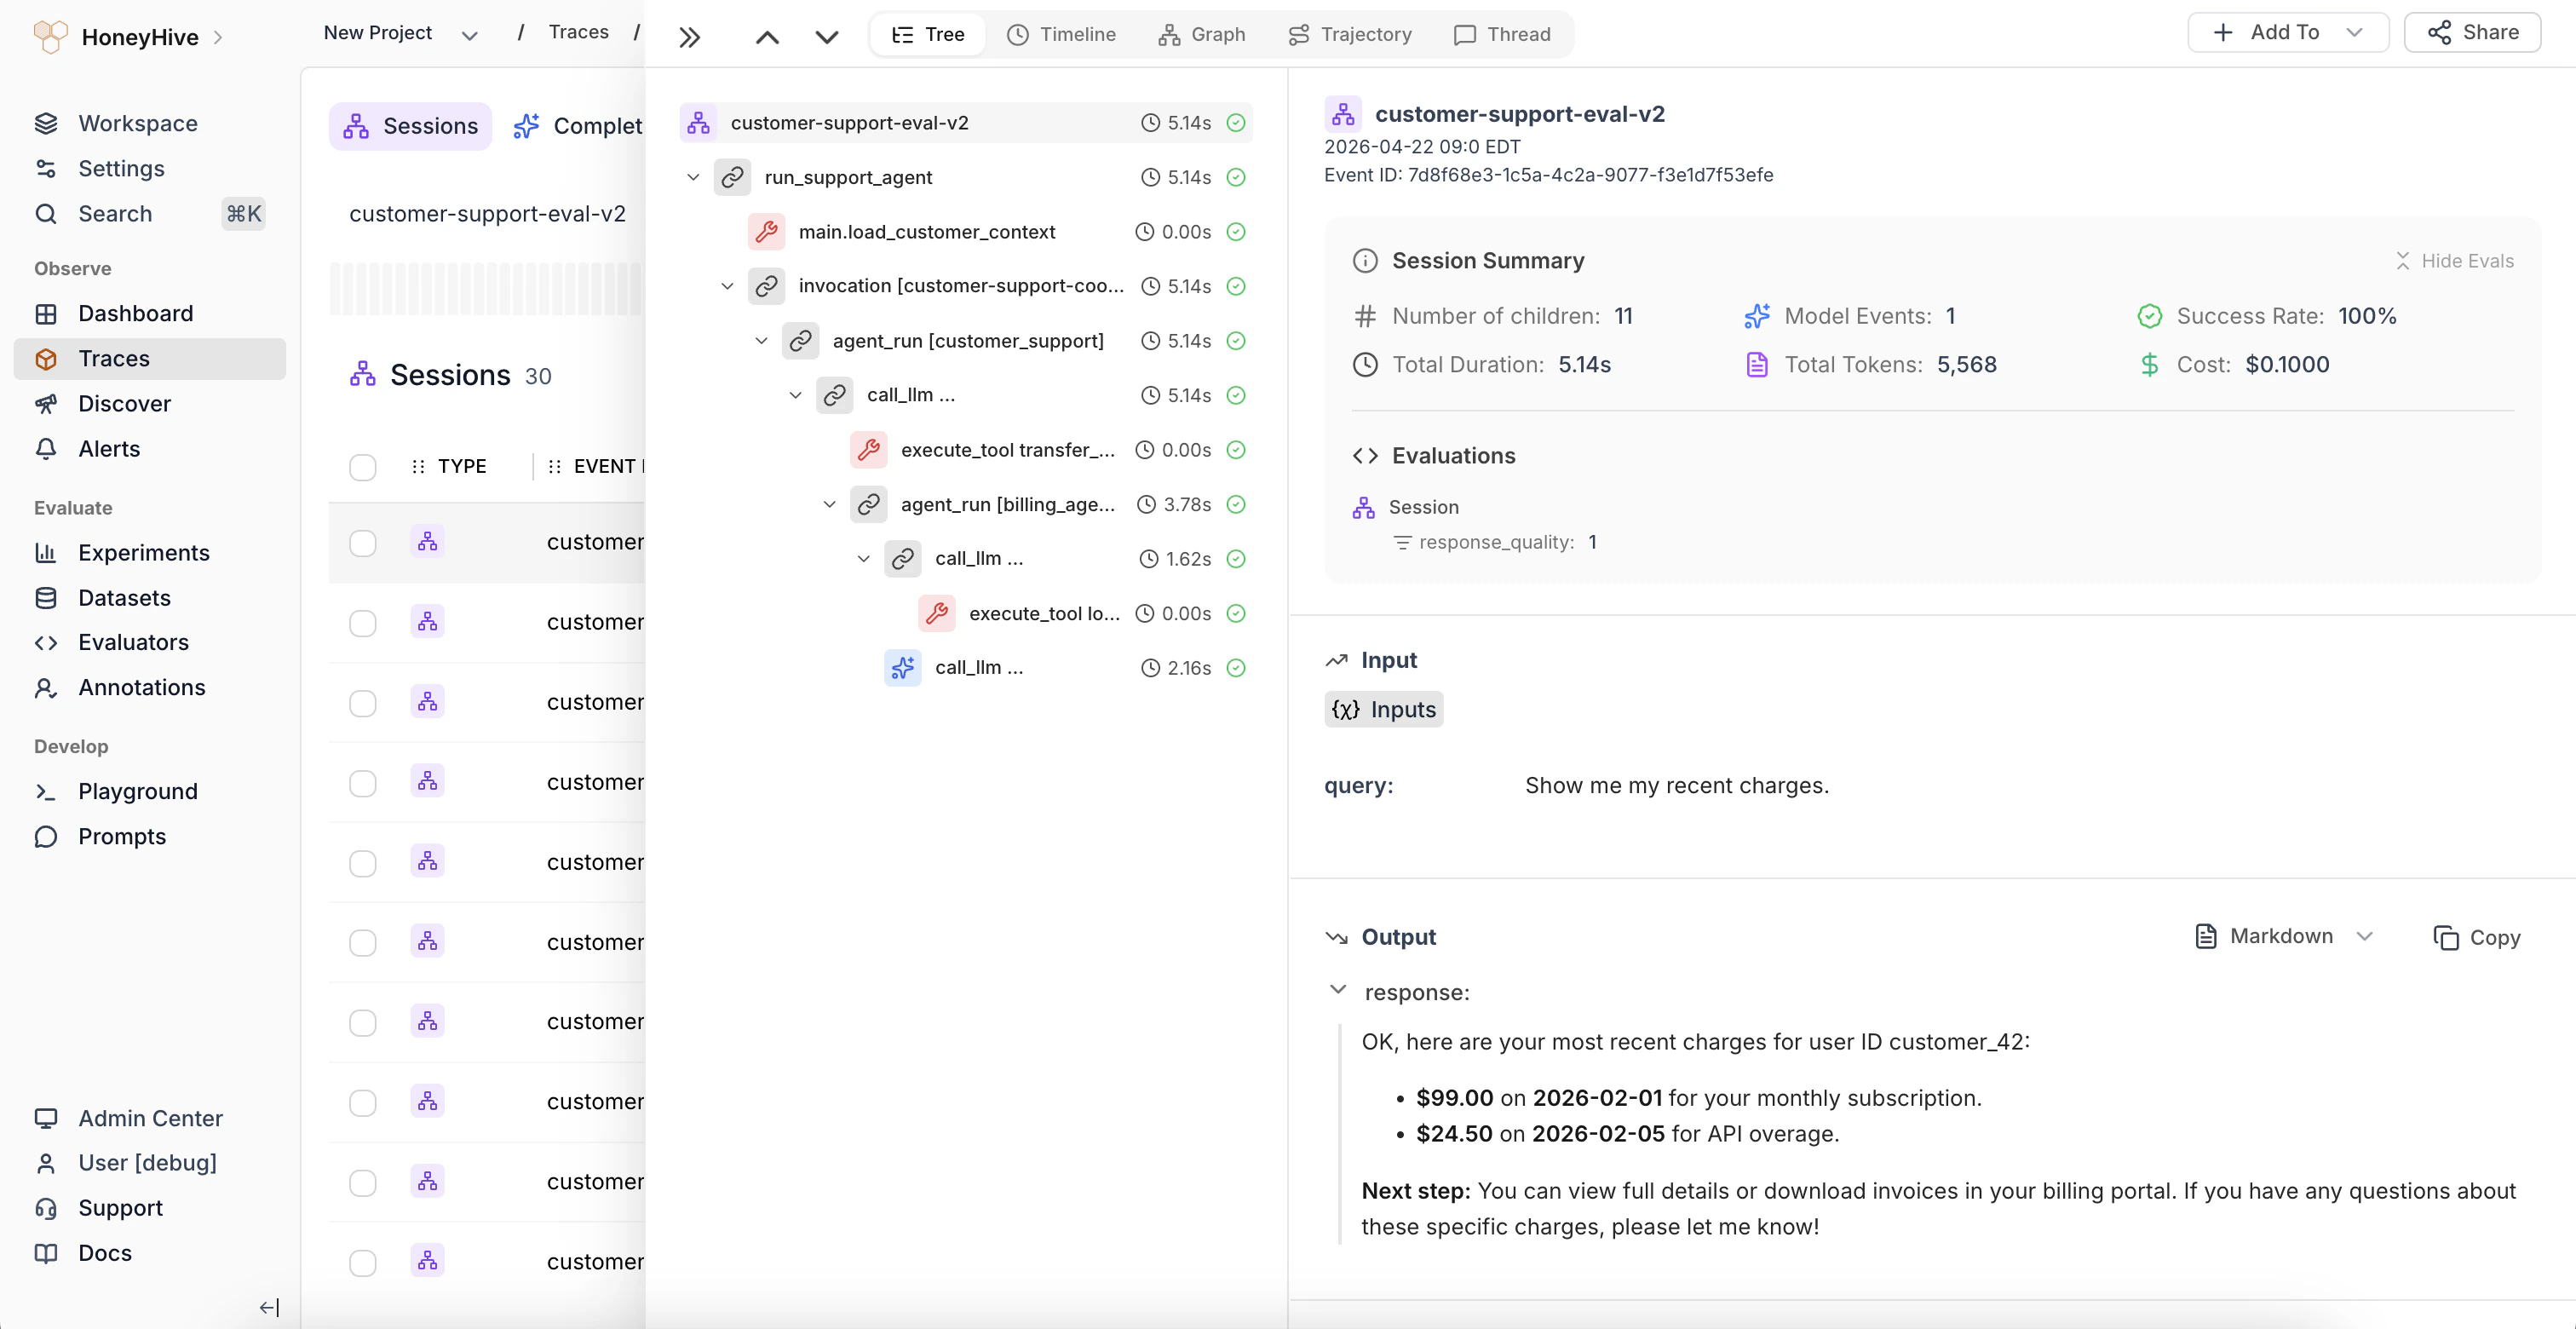
Prerequisites
Please complete the Quickstart and make sure you have initialized your tracer usingHoneyHiveTracer.init().Overview
HoneyHive gives you full customizability over your traces.You can trace any function in your code and see its inputs, outputs, errors, duration, etc. by decorating it with the@trace decorator.The
@atrace decorator is identical in functionality to the @trace decorator, but is used for async functions.Enriching Custom Spans
You can enrich your custom spans with additional properties to provide more context to your traces. There are 2 ways to enrich spans in HoneyHive:-- Enriching before execution: The decorator-based enrichment below shows how you can enrich static properties before the code executes.
-
Enriching during execution: You can enrich dynamic properties on a session/trace or event/span level using
enrich_sessionandenrich_spanfunctions. Please refer to the Enrich Traces documentation for more details on enrichment during execution.
Enriching Before Execution Using Decorators
Here is an example of how to enrich the Configuration, Metadata, and Event Type fields on the decorator:Python
Enriching During Execution Using enrich_span or enrich_session
You can also enrich your traces and custom spans with various propertires during execution using the enrich_span or enrich_session functions.Please refer to the Enrich Traces documentation for more details on enrichment during execution. You can find the complete documentation for this in the Python SDK reference.Async Function Tracing with @atrace
For async functions in Python, use the@atrace decorator instead of @trace. The @atrace decorator is specifically designed to handle async functions properly:@atrace decorator supports the same enrichment options as @trace:Best practices
- Use descriptive function names, as they will be used as span names in your traces
- Be mindful of sensitive data when tracing functions - avoid capturing passwords or other secrets
@trace decorator to key functions in your application, you can gain valuable insights into your custom code’s performance and behavior, complementing HoneyHive’s automatic instrumentation of LLM components.Visualizing Your Traces
All traces can be visualized in the HoneyHive web app under Log Store in the session’s specified project. The session tree view shows you the execution flow of your trace, as well all the automatically captured and manually enriched attributes.Next Up: Enrich Your Traces
Here are some ways in which you can enrich your traces:Enrichments Overview
An overview of the types of enrichments available for your traces and spans
Logging Client-Side Evaluations
Add client-side metrics, guardrail results, or evaluations to your traces
Logging User Feedback
Enrich traces with feedback or additional annotations
Logging Configuration Details
Include config details, model hyperparameters, or prompt templates
Logging User Properties
Add user properties or tracking IDs to your traces
Logging Custom Metadata
Enrich traces with arbitrary metadata or JSON