Sample Application
Before we add observability, let’s look at a basic RAG application without any instrumentation. This application does the following:- Retrieves relevant documents from a Pinecone vector database based on a query’s embedding.
- Uses the retrieved documents as context to generate a response using OpenAI’s GPT model.
- Returns the generated response.
Tutorial overview
The golden path for adding observability with HoneyHive happens in 2 phases. Phase 1: Capture the data- Auto-capture LLM and vector DB calls
- Group the calls into the logical steps in your application
- Trace any other missing steps that might be relevant
- Track configuration and metadata on a step level
- Track user properties, feedback, and configuration on an application level
Phase 1 - Capture the data
Prerequisites
For the following tutorial, we are assuming that you have- Already setup a HoneyHive account
- Copied your HoneyHive API key
Setting Up Your Environment
First, install the HoneyHive SDK:1. Auto-capture LLM and Vector DB Calls
At the beginning of your application, initialize the HoneyHive tracer:In case you are unable to see the auto-captured calls, please refer to our troubleshooting docs. In any case, you can add custom spans as described in the next step to capture those calls.
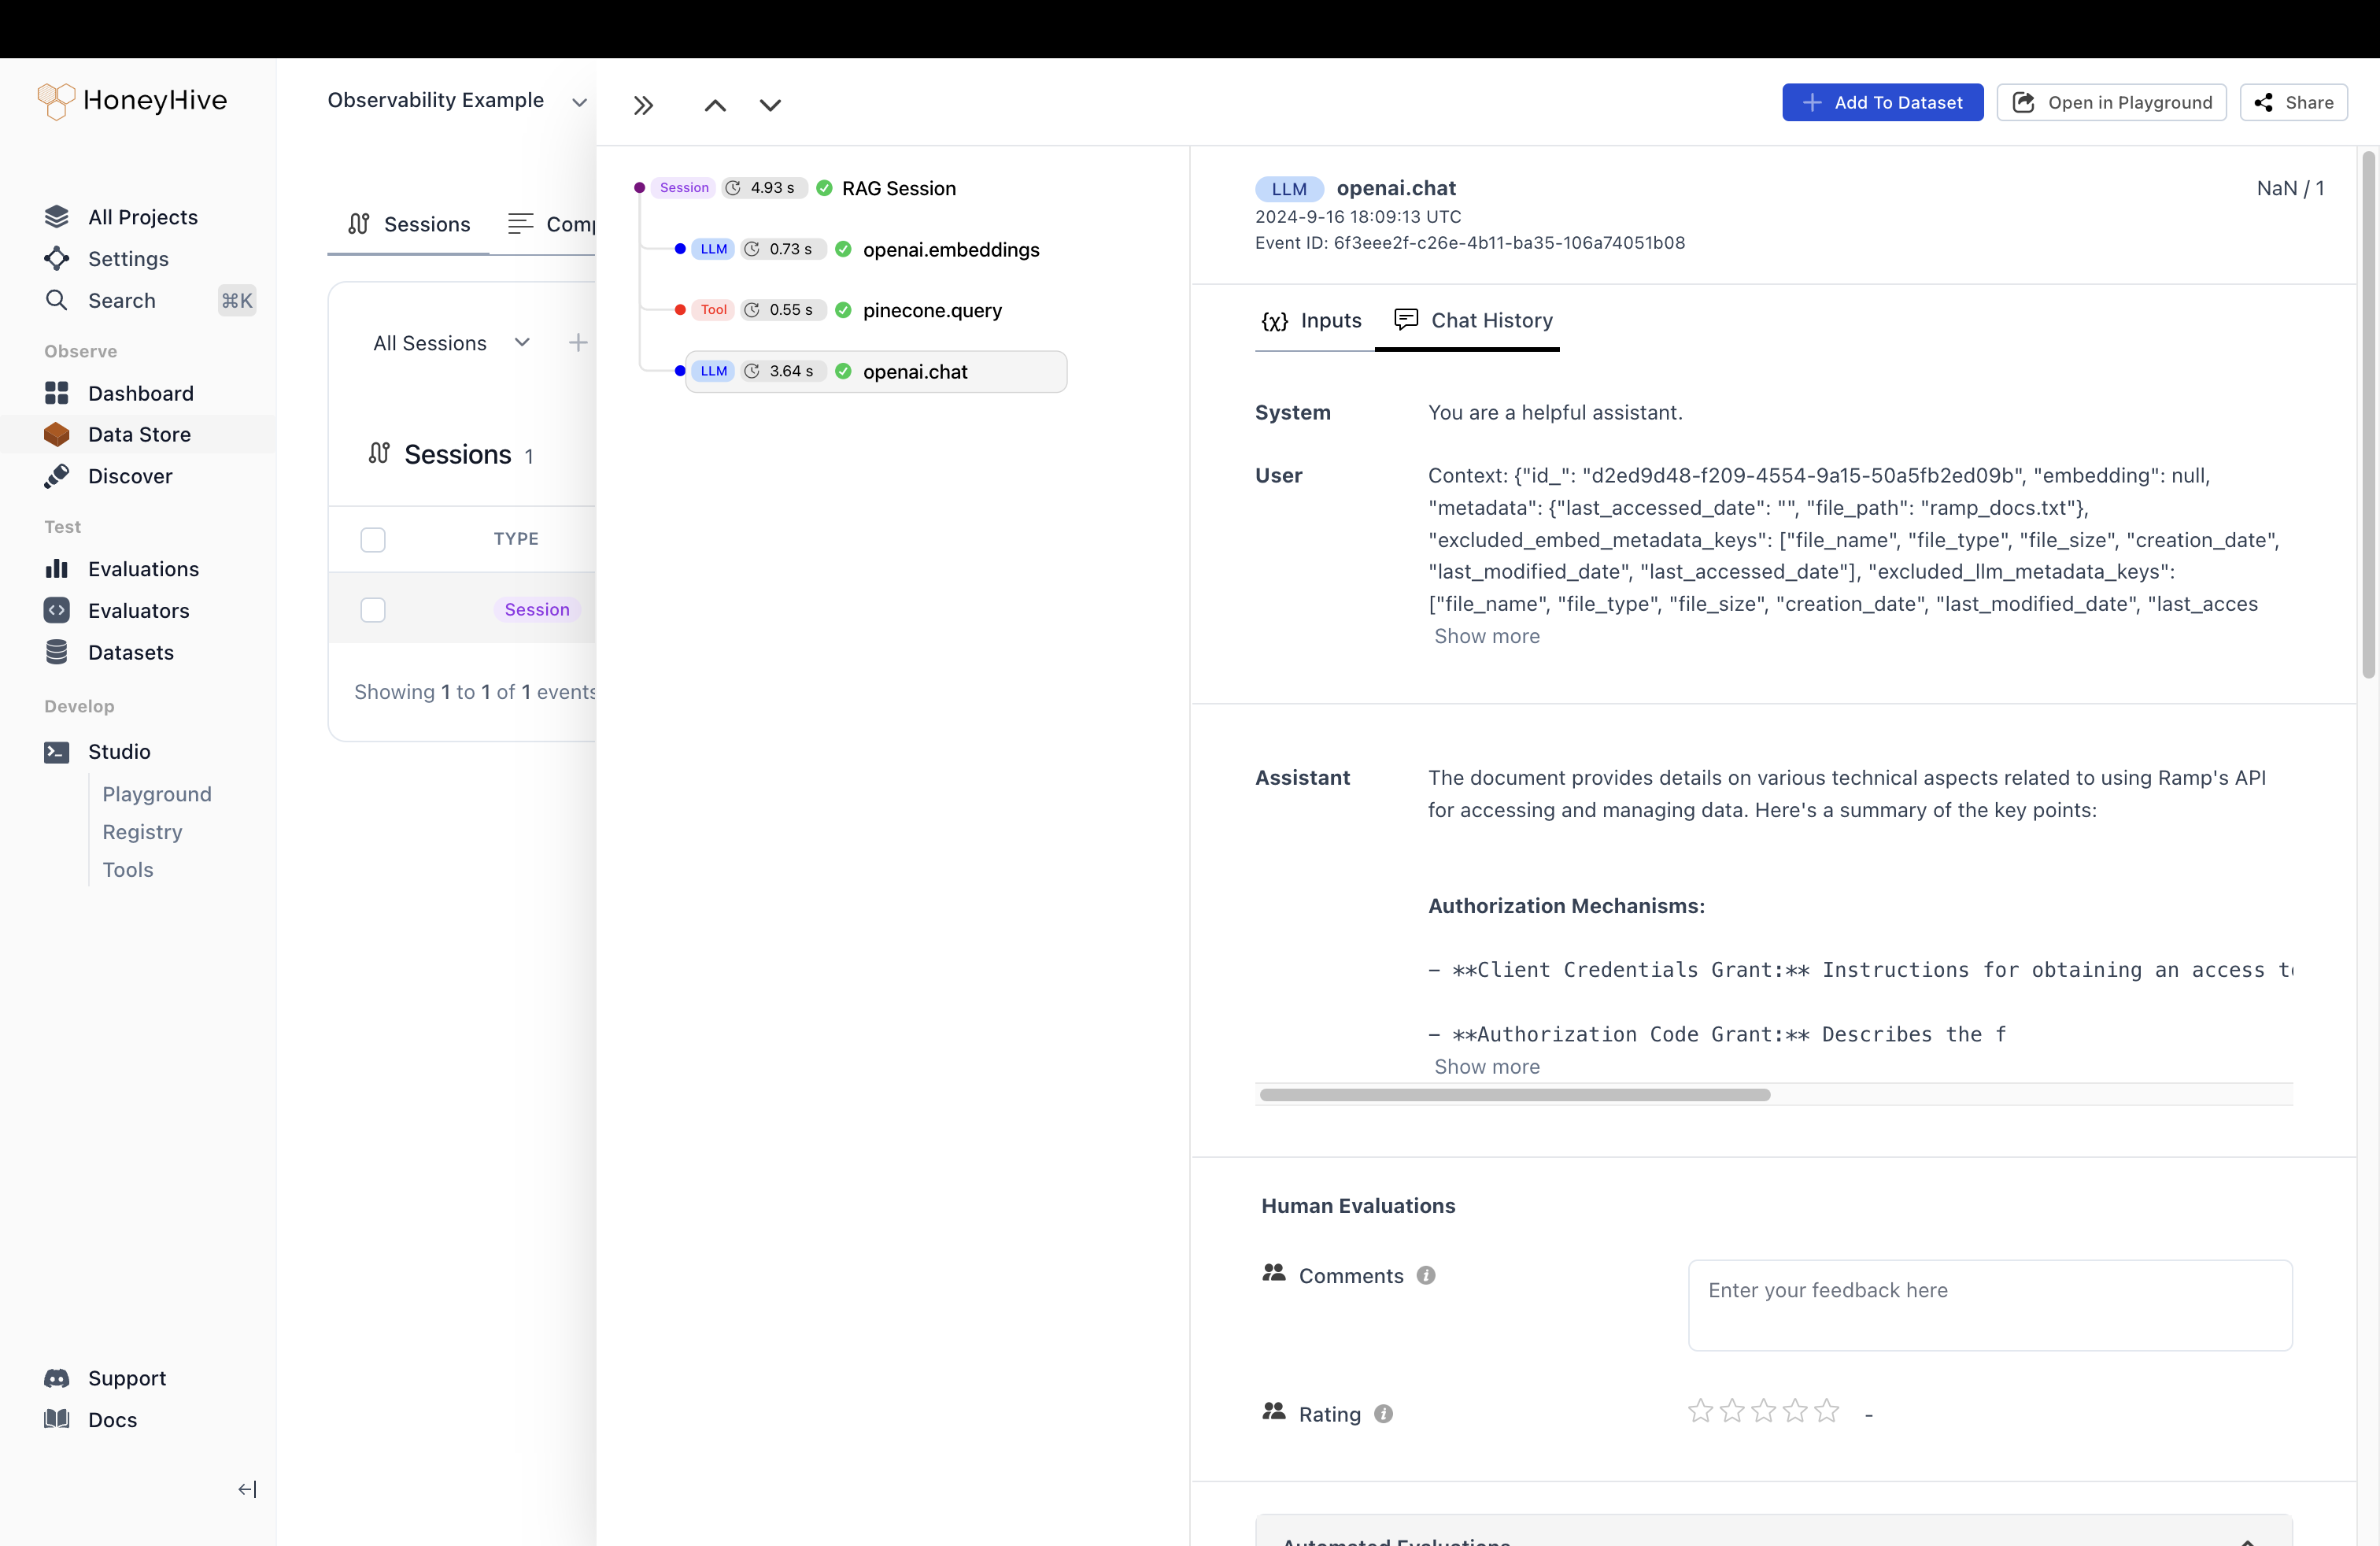
- The user query is all the way at the end of the LLM messages.
- The context chunks are all mixed together so we can’t tease those apart.
2. Create a custom span around your main application
The@trace decorator in Python and traceFunction in TypeScript help us add custom spans for important functions in the application. It captures all function inputs and outputs as well as durations and other relevant properties.
We’ll start by placing the first decorator on the main RAG function.
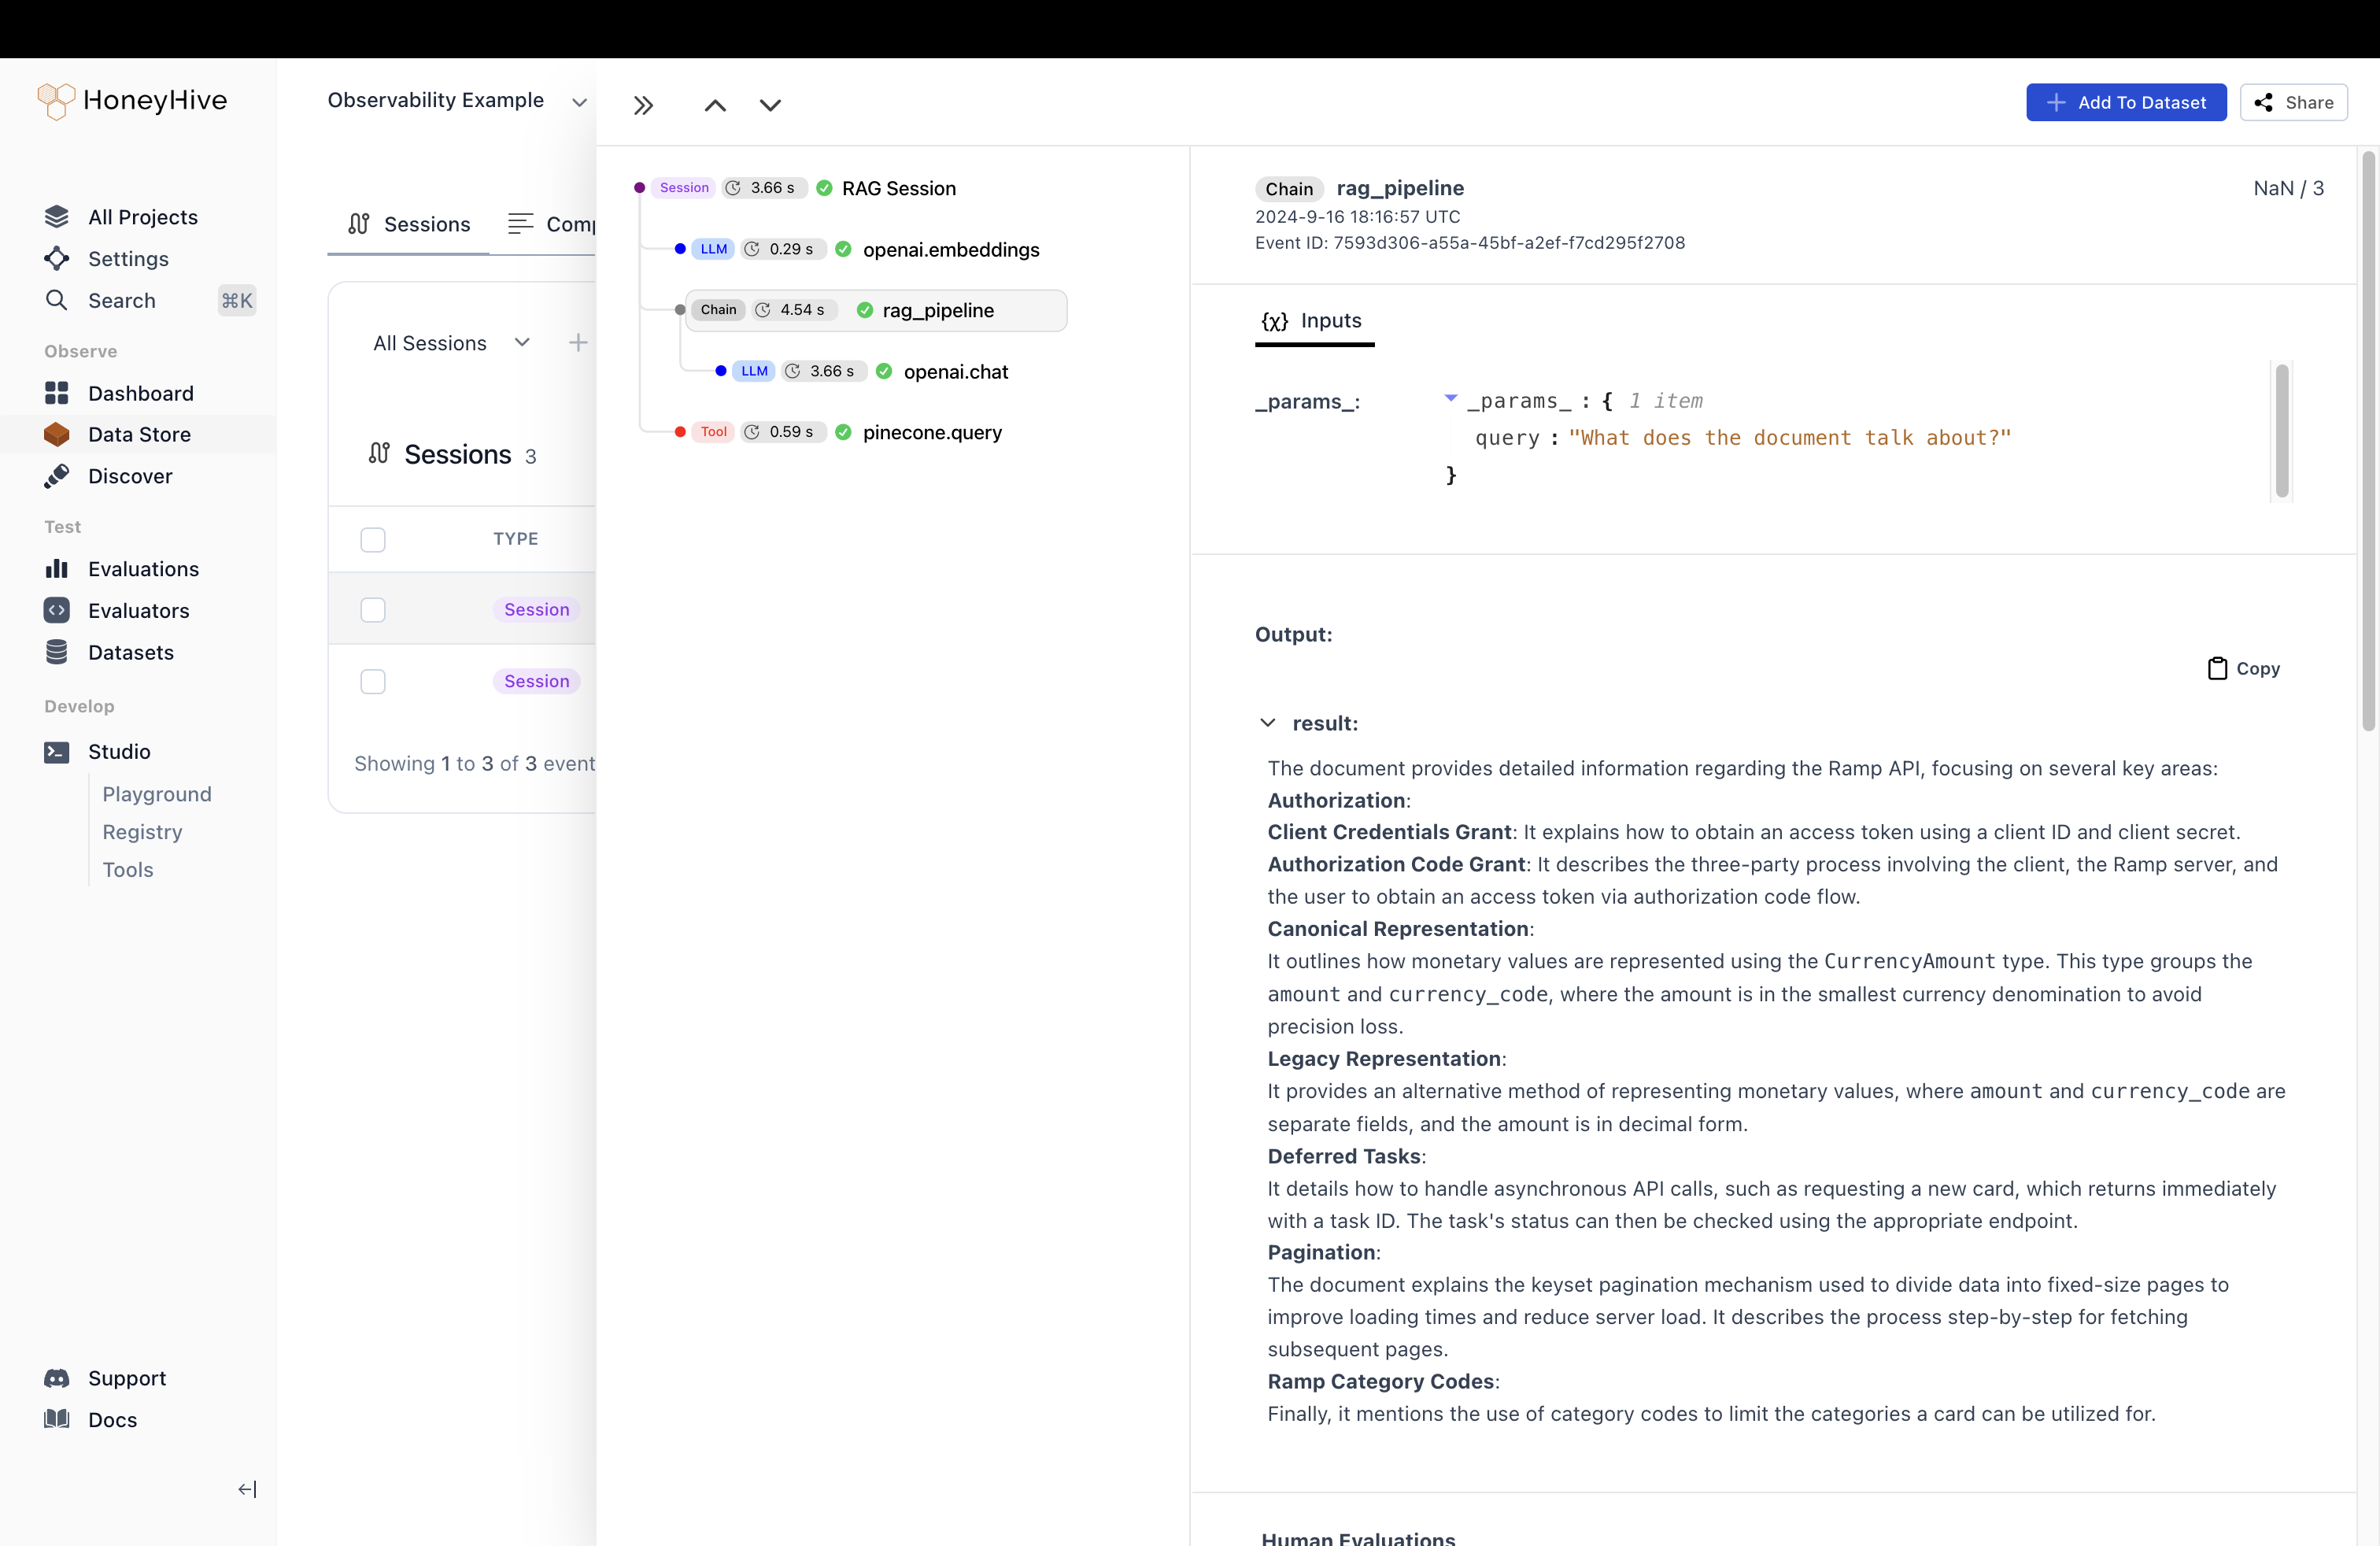
rag_pipeline/ragPipeline span is a lot easier to read and interpret.
We can see that the user query was What does the document talk about? and the final output is the (possibly?) correct description provided by the model.
This high-level view will help us catch any glaring semantic issues.
However, this is still not sufficient.
We still need access to some specific fields from the vector DB and LLM step that can break down how we arrived at this output.
Luckily, our decorator approach can easily scale to include any step as we please.
3. Create a custom span around key intermediate steps
First, let’s split our large RAG function into different sub-functions. Any intermediate step whose inputs and outputs we want to track are good candidates for splitting out into their own functions.You might have to sometimes pass a variable as an argument even if you don’t end up using it in the function, so that it can be tracked as inputs on the span in the platform.
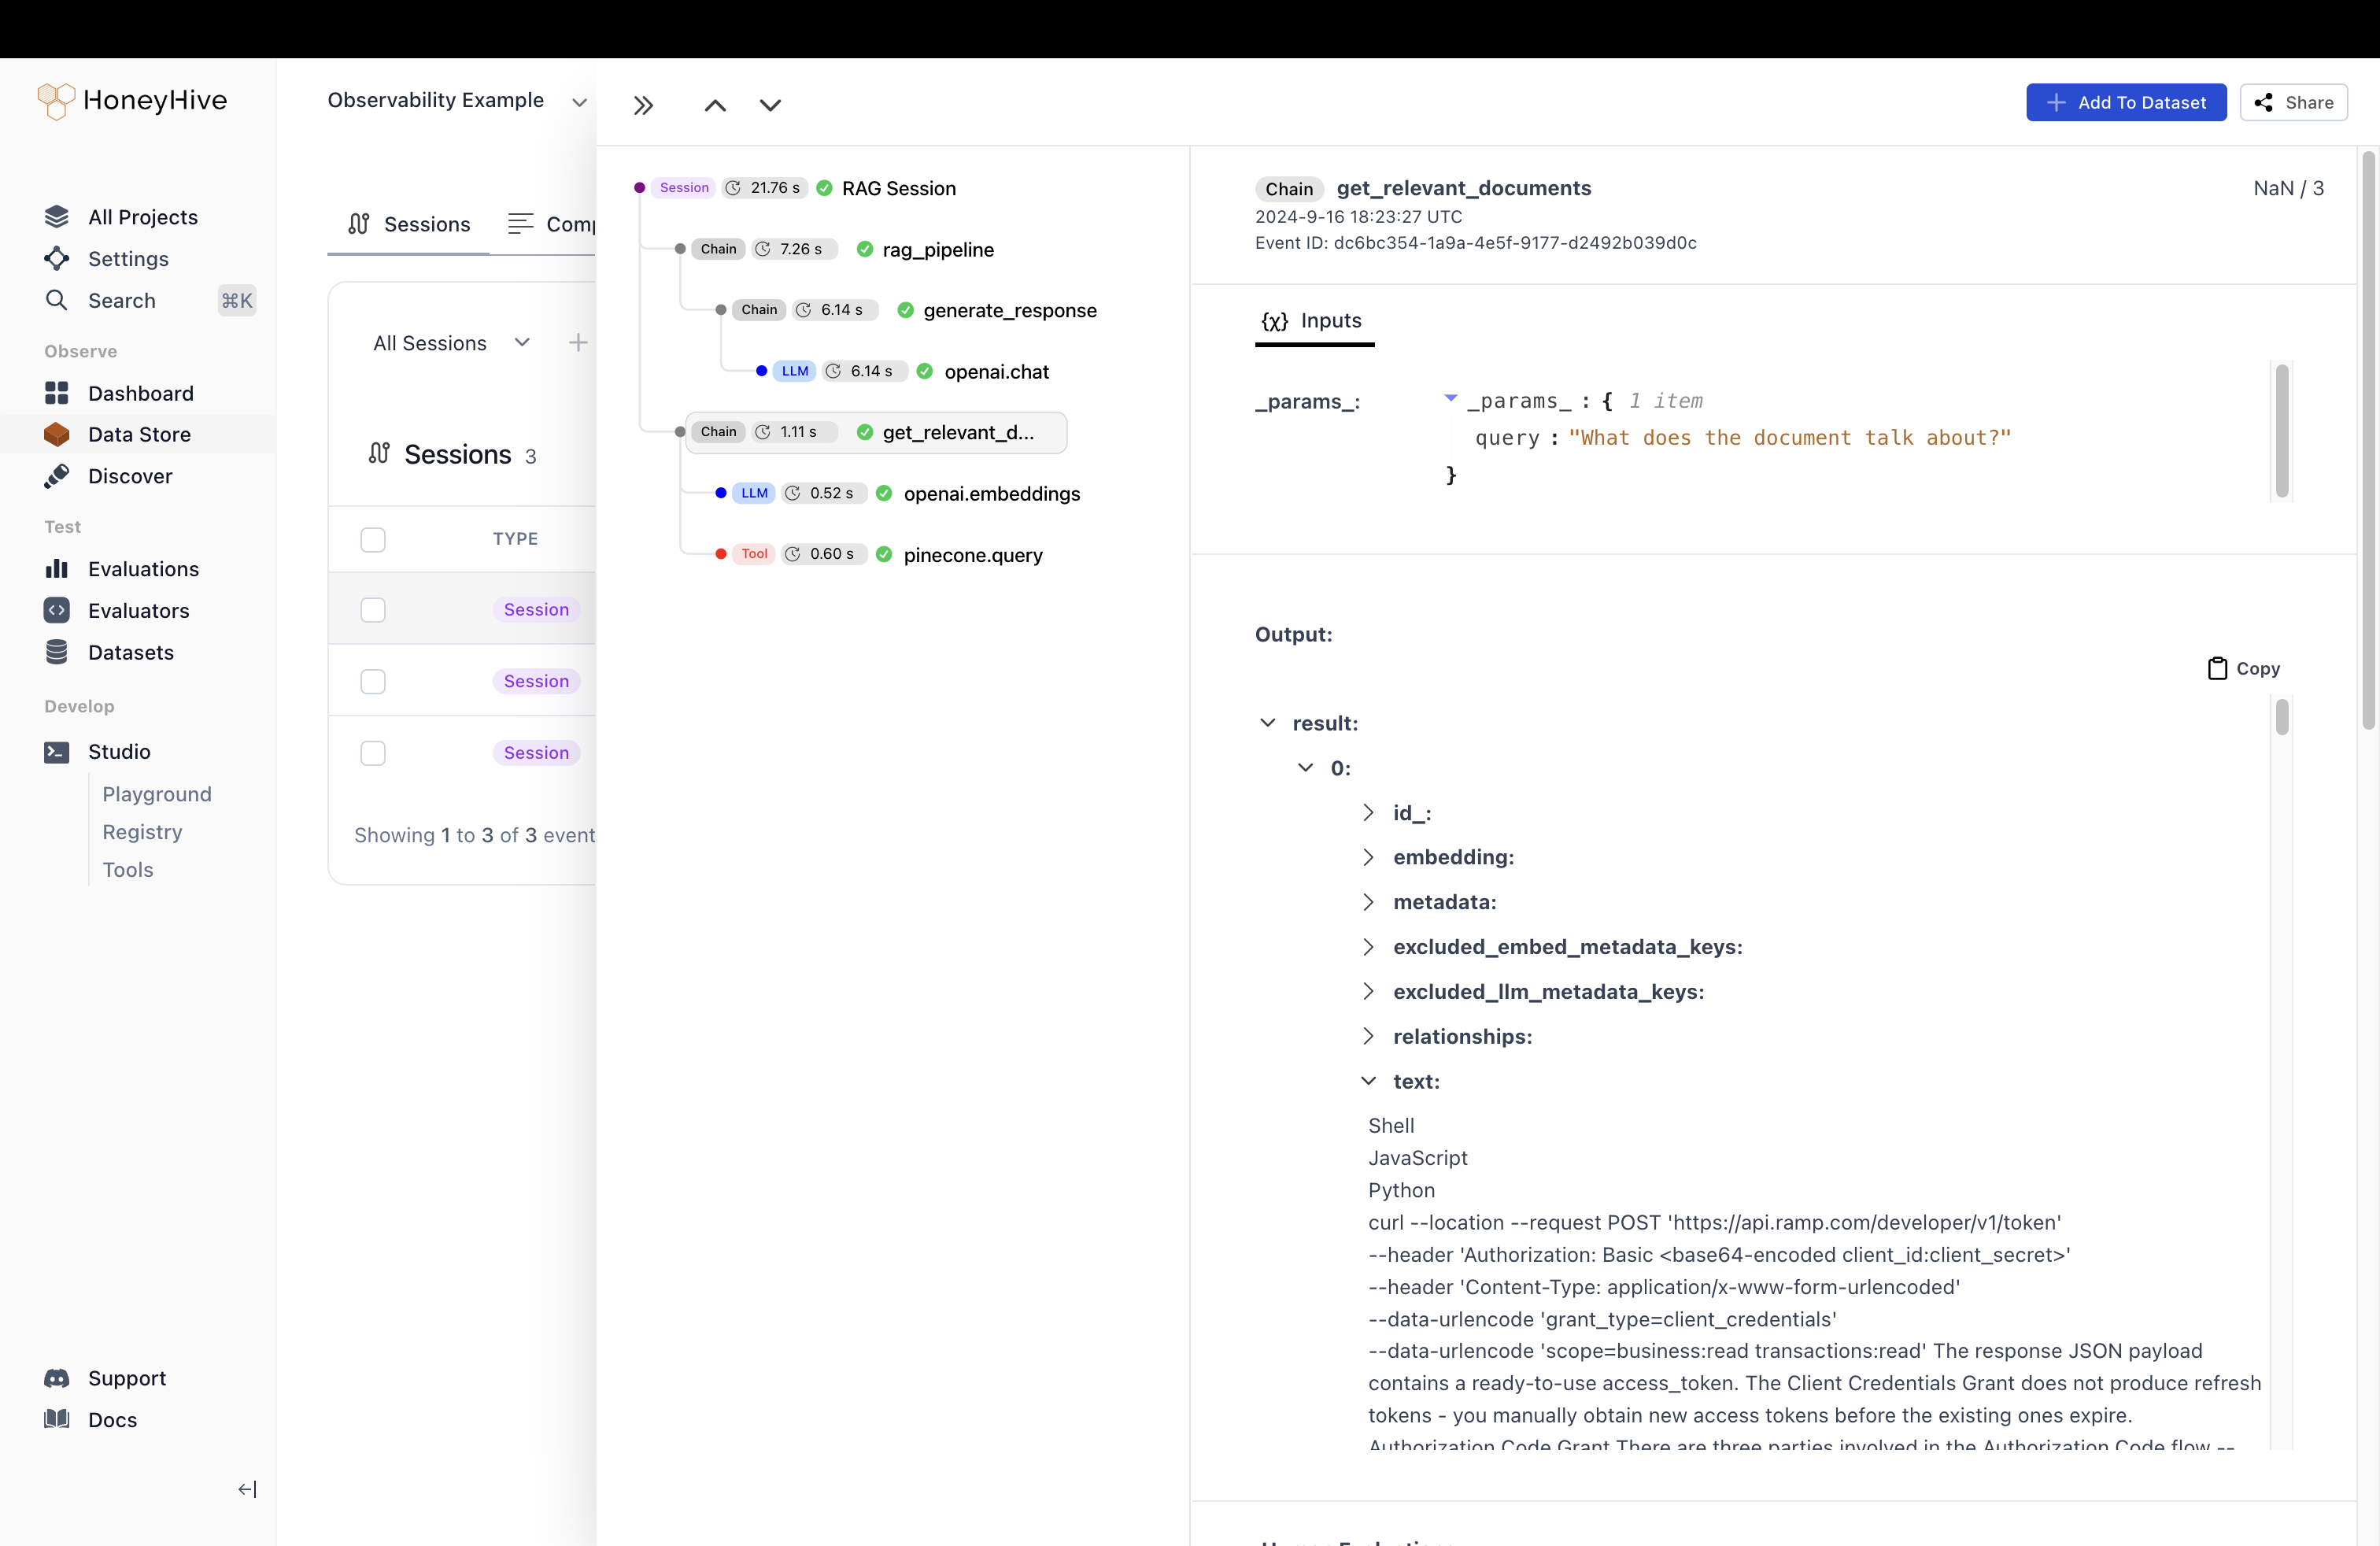
get_relevant_documents and understand whether the LLM’s answer is sensible.
Our UI makes it easy to navigate extremely nested JSONs with large text to make debugging smoother.
Just by investigating these spans we can quickly debug whether our retriever or generation step is causing our overall application to fail.
Phase 2 - Enrich the data
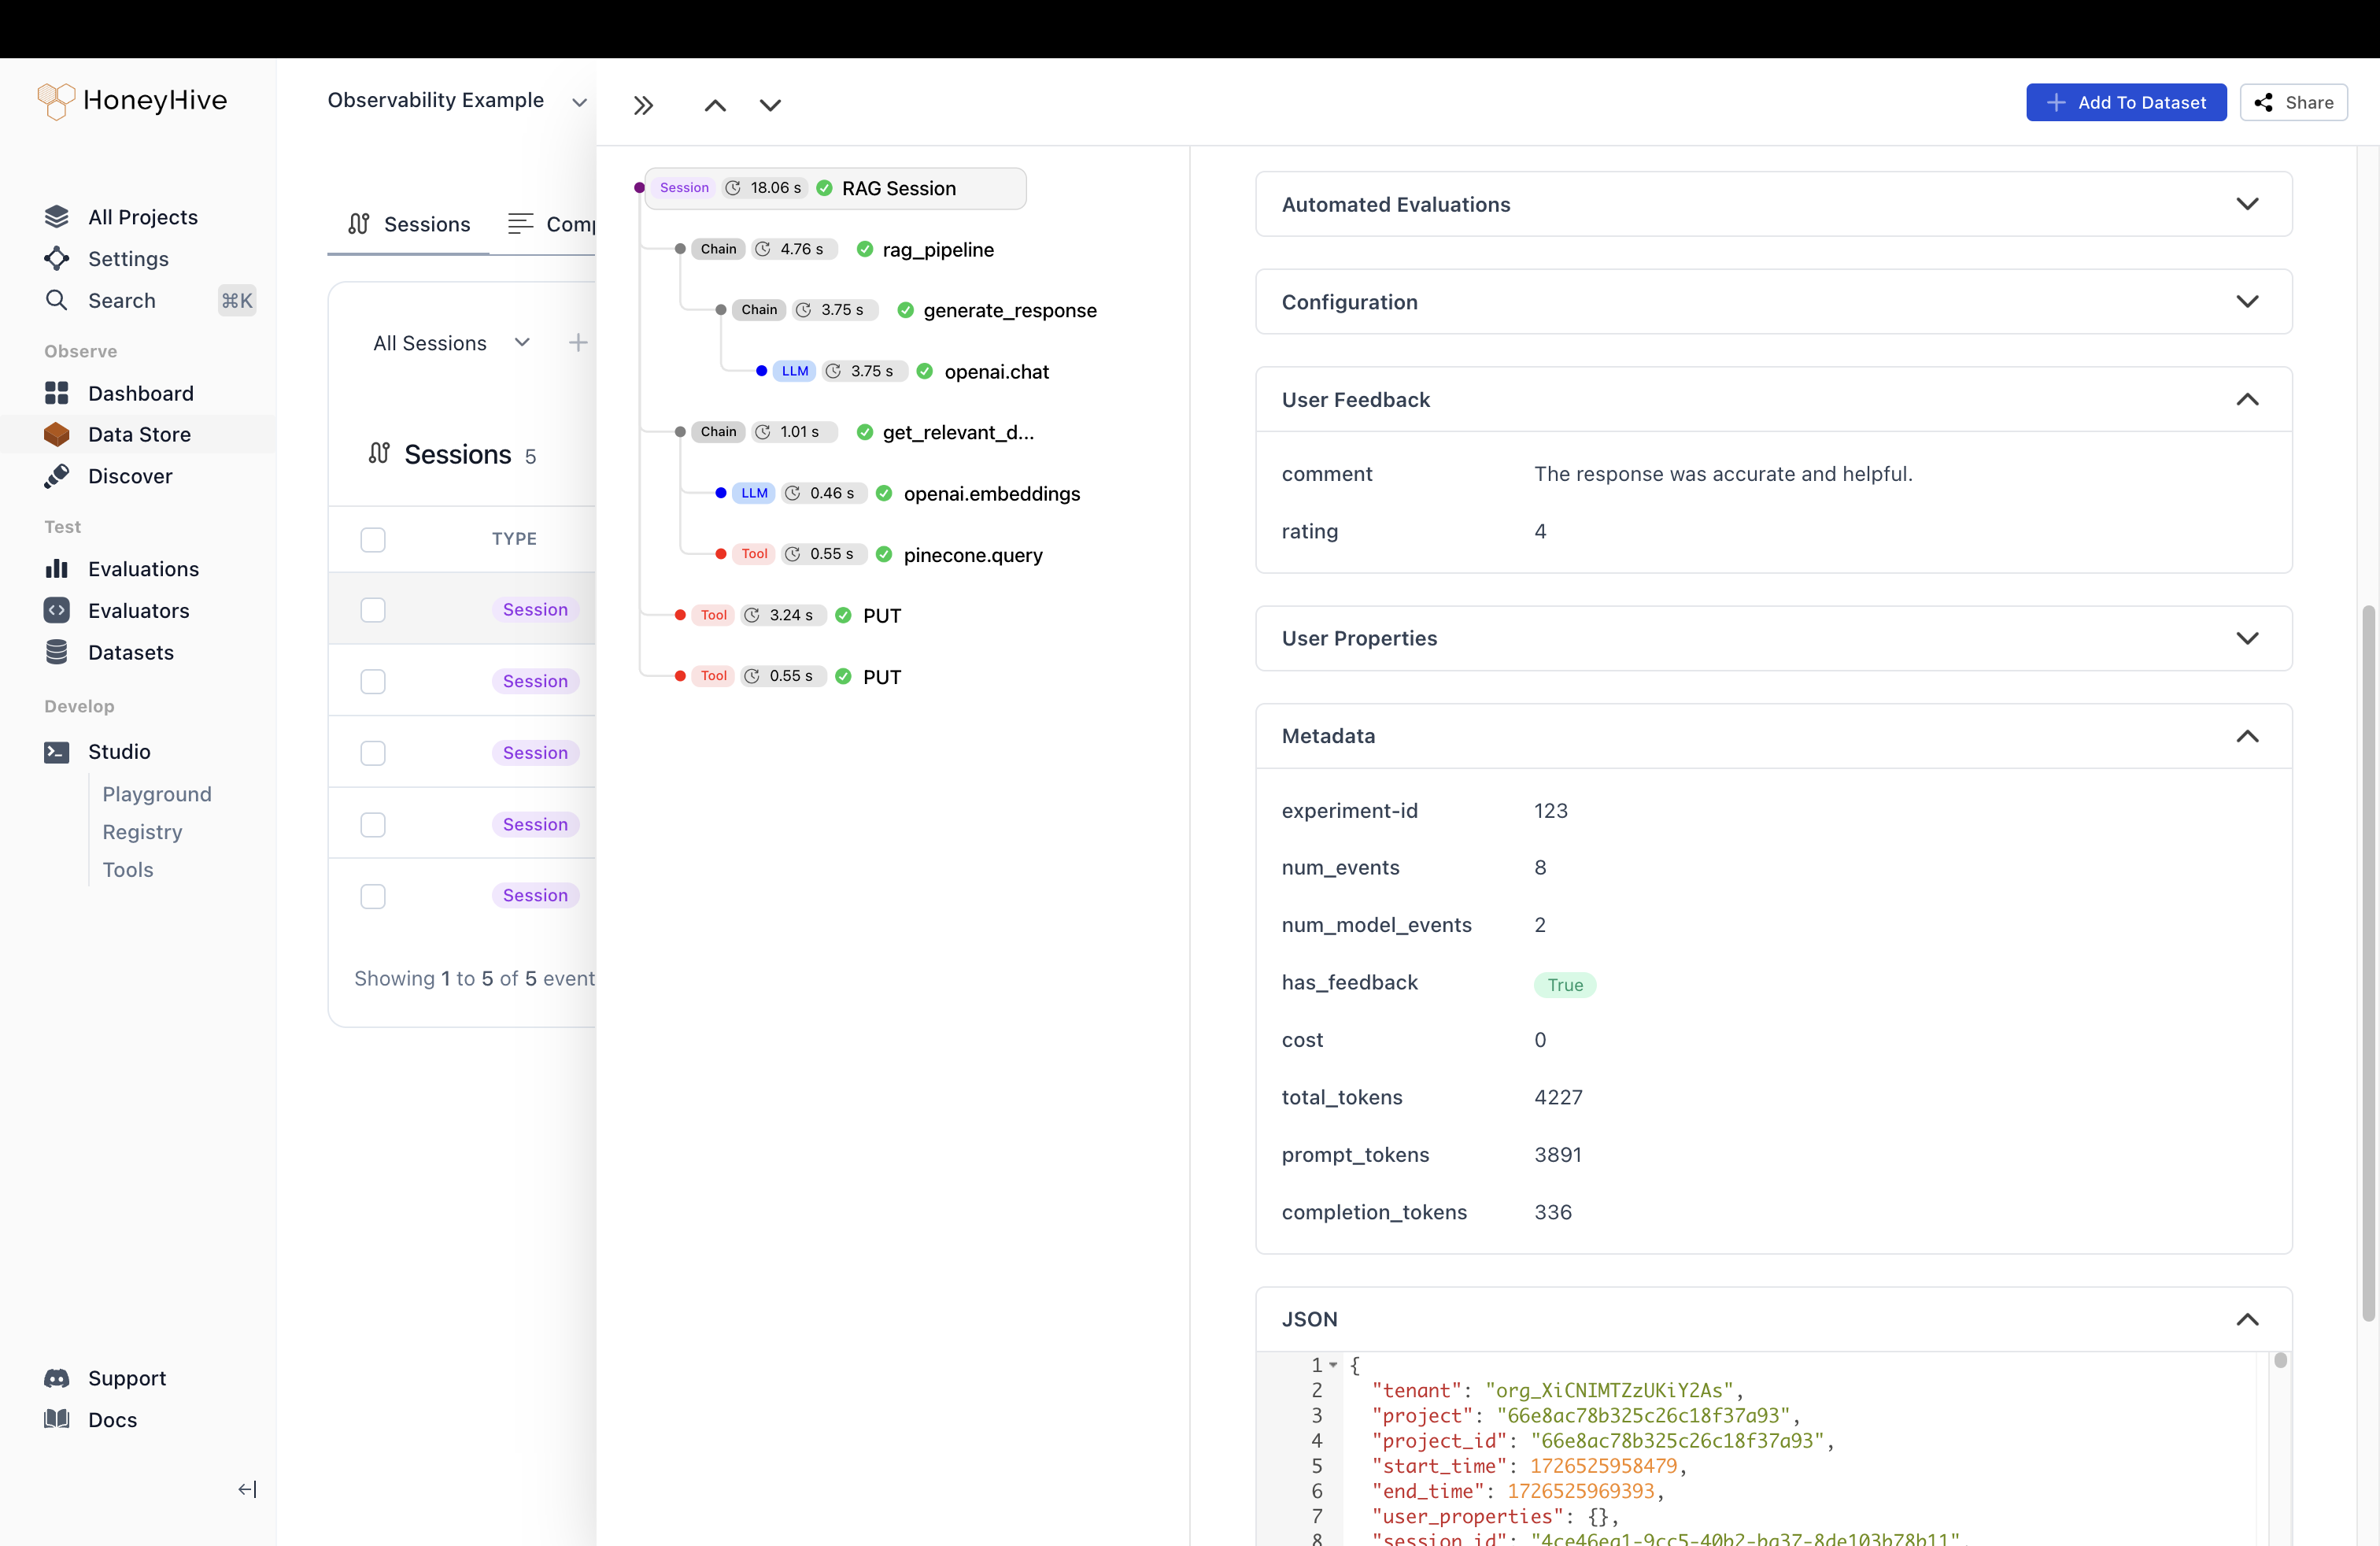
For the next phase, let’s add in any other external context that’s available to us to the trace. This will help us later when charting the data and understanding aggregate trends in usage and feedback.4. Enrich the Custom Spans with Configuration and Metadata
Thetrace decorator accepts metadata and configuration to provide more context to the traces:
5. Enrich the trace with Feedback and Metadata
We can enrich the session by calling it from anywhere else in the code. For example, we’ll call our RAG pipeline function from anothermain function.
Using the enrich_session/enrichSession helper functions on our base tracer class, we will enrich the full session with the relevant external context as well.
Putting It All Together
Let’s combine all the concepts we’ve covered into a complete example of a RAG application with HoneyHive observability:- We set up the necessary environment variables and initialize the HoneyHive Tracer.
- We create clients for OpenAI and Pinecone, which will be automatically instrumented by HoneyHive.
- We split our main application function into three smaller traced functions:
get_relevant_documents/getRelevantDocuments: Retrieves relevant documents from Pinecone.generate_response/generateResponse: Generates a response using OpenAI’s GPT model.rag_pipeline/ragPipeline: Orchestrates the entire RAG process.
- In the
mainfunction, we:- Run the RAG pipeline with a sample query.
- Print the query and response.
- Simulate collecting user feedback and log it to HoneyHive.
- Throughout the code, we add metadata and custom spans to provide rich context for our traces.
Best Practices
- Use descriptive names for function names: This makes it easier to understand the structure of your application in the traces.
- Add relevant metadata: Include information that will help you filter and analyze traces later, such as user IDs, experiment IDs, or version numbers.
- Collect user feedback: This provides valuable insights into the real-world performance of your application.
- Use nested spans: Structure your traces to reflect the hierarchy of your application’s components.
Conclusion
By following this tutorial, you’ve added comprehensive observability to your LLM application using HoneyHive. This will help you iterate quickly, identify issues, and improve the performance of your application throughout its lifecycle. For more advanced features and in-depth guides, check out the following resources:- Python Custom Spans Documentation
- JS/TS Custom Spans Documentation
- User Feedback Logging
- Adding Tags and Metadata
- Analyzing Traces and Creating Charts
Next Steps
The next phase after capturing the right data from your application is setting up online evaluators and collecting datasets to measure quality in production. The following guides will help you configure different types of evaluators for any step in your application.Setup an online Python evaluator
Learn how to add a Python evaluator for specific steps or the whole application’s trace.
Setup an online LLM evaluator
Learn how to add a LLM evaluator for specific steps or the the whole application’s trace.
Setup human annotation
Configure human annotation for specific steps or the whole application’s trace.
Curate a dataset from traces
Learn how to curate a dataset of inputs & outputs from your traces