

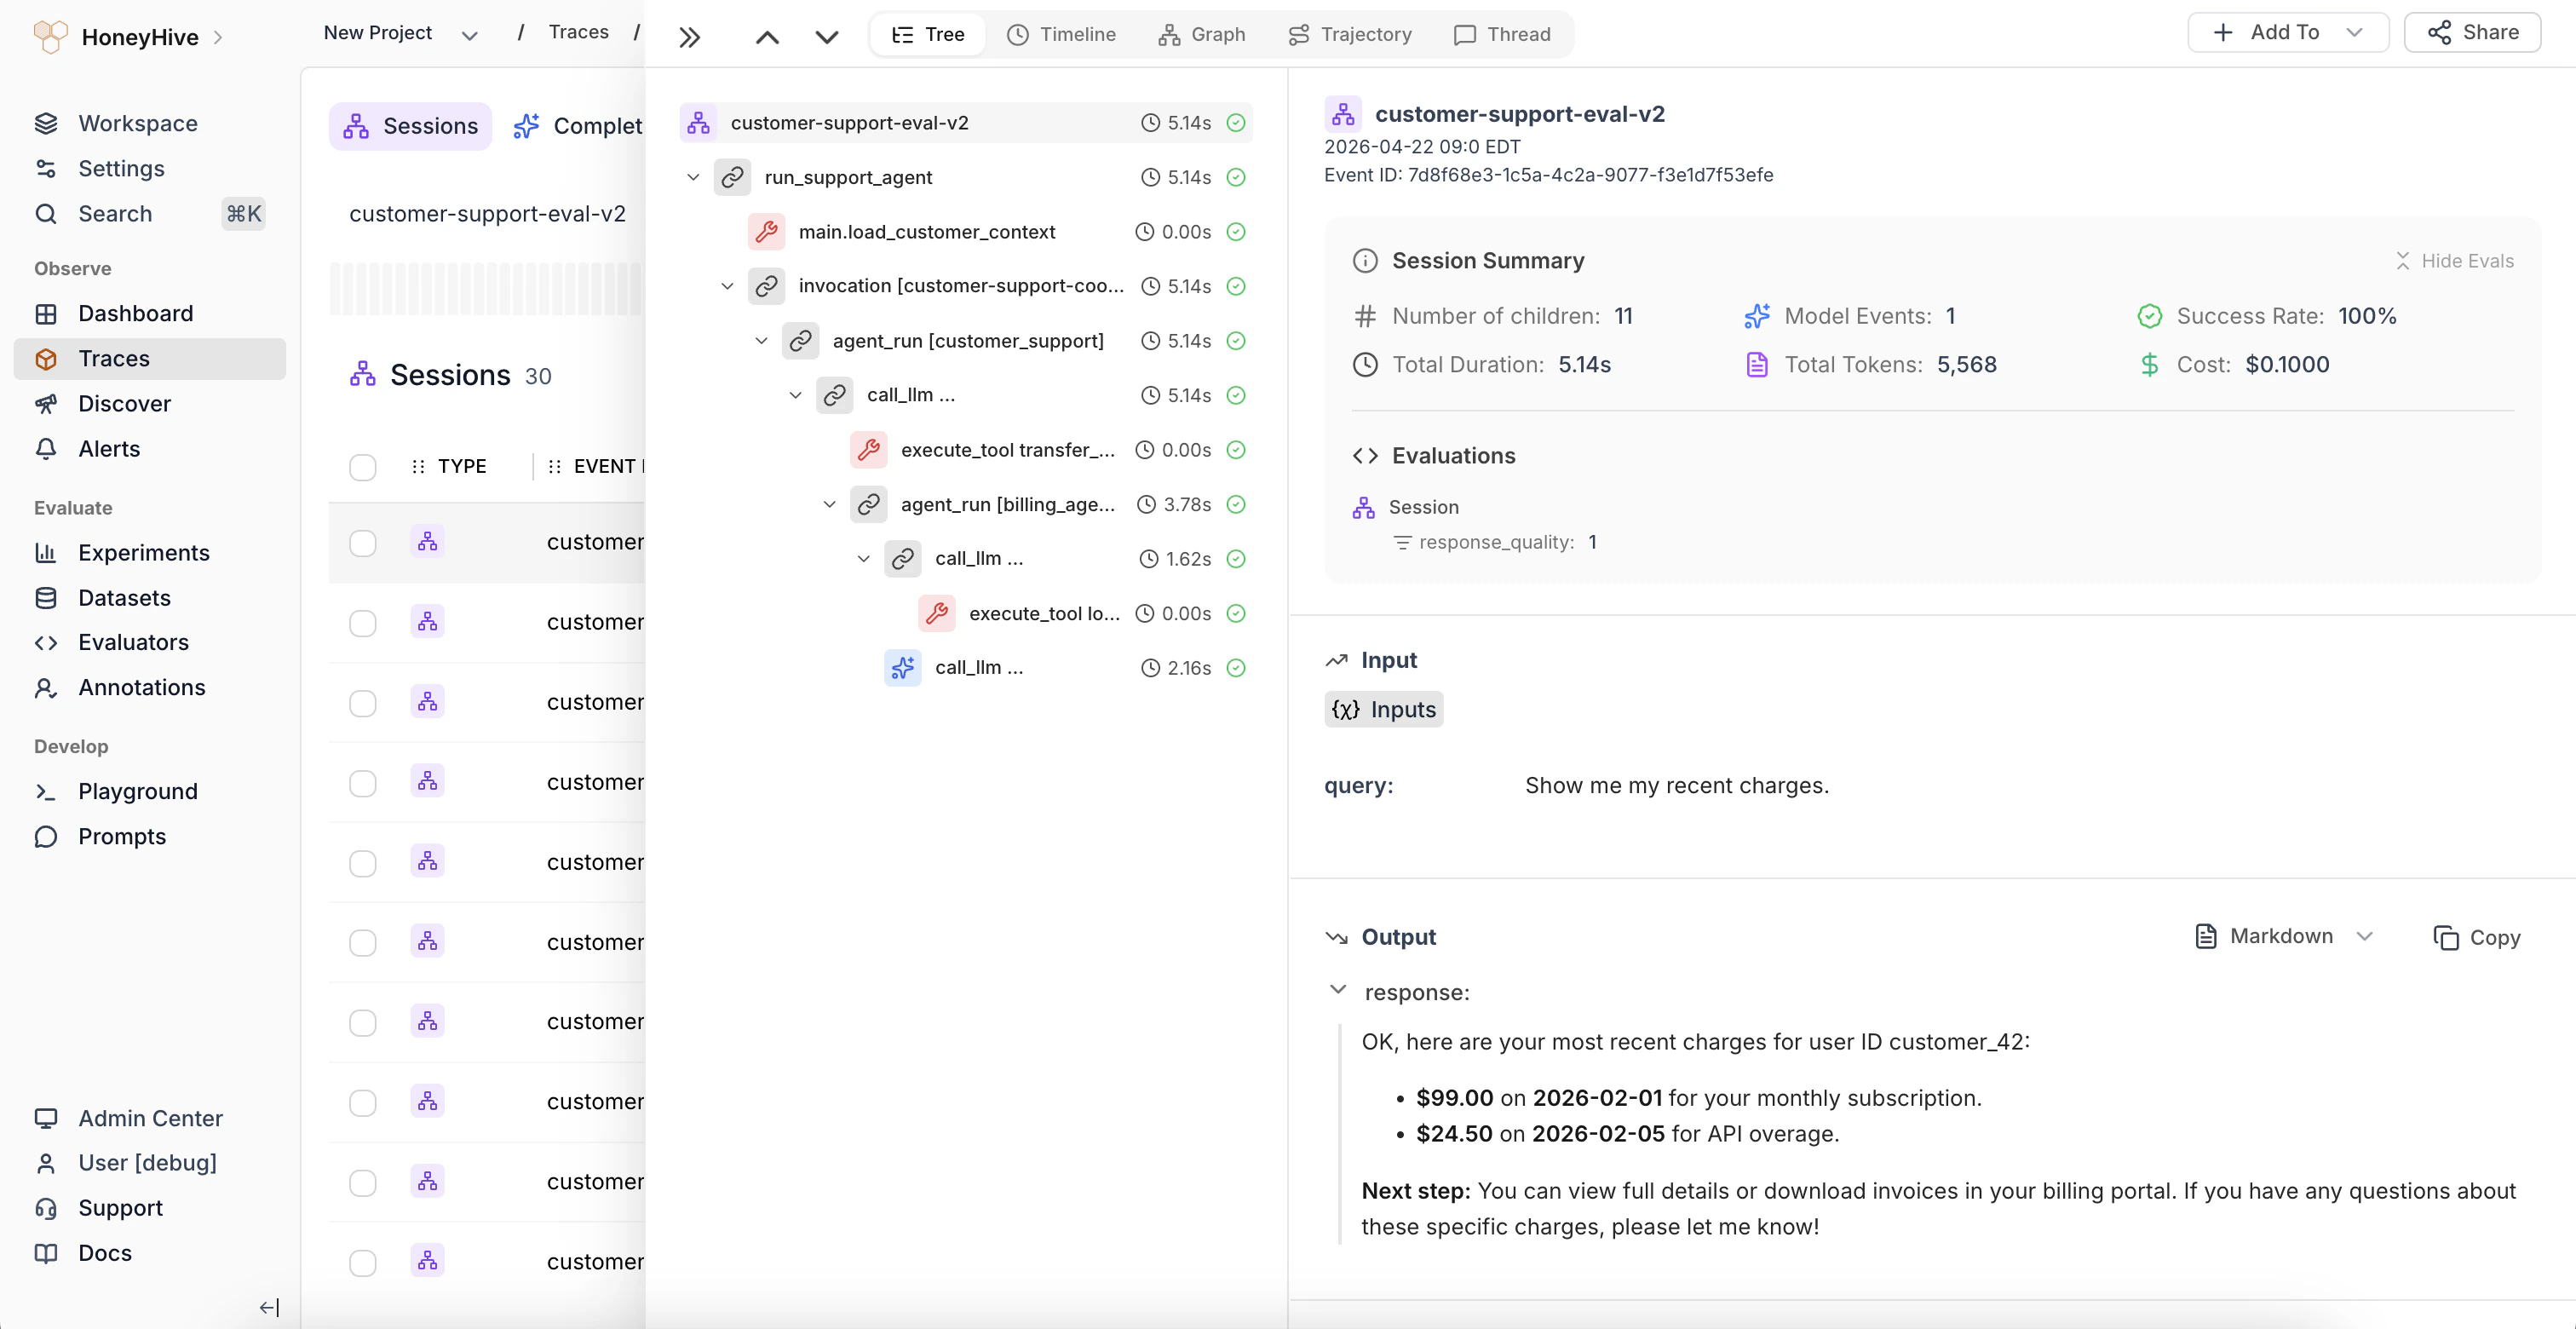
Visualization of a trace in HoneyHive
How do you start tracing?
How does automatic tracing work?
The fastest way to start is automatic tracing, which instruments major LLM providers and vector databases with minimal setup using OpenTelemetry semantic conventions.Quickstart
Begin tracing OpenAI requests with HoneyHive in minutes
Supported Integrations
Pre-built integrations for common model providers and frameworks
How do you trace custom business logic?
Automatic tracing covers LLM and vector DB calls. For preprocessing, postprocessing, or other business logic, use the@trace() decorator to create custom spans that appear in your trace tree.
Custom Spans
Trace any function in Python/TS using decorators
What advanced tracing features are available?
Distributed Tracing
Propagate trace context across service boundaries so multi-service calls appear in a single session
Sampling
Control which requests get traced in high-volume applications
Span Filtering
Drop noisy framework spans using prefix-based rules
Multi-Instance Tracing
Run multiple tracer instances for multi-tenant, A/B testing, or environment routing
Multi-Modal Tracing
Trace pipelines that combine text, image, audio, or video operations
Multi-Threaded Tracing
Propagate context across threads in Python applications
Tracing via API
Log events directly via REST API for languages without SDK support