How it works
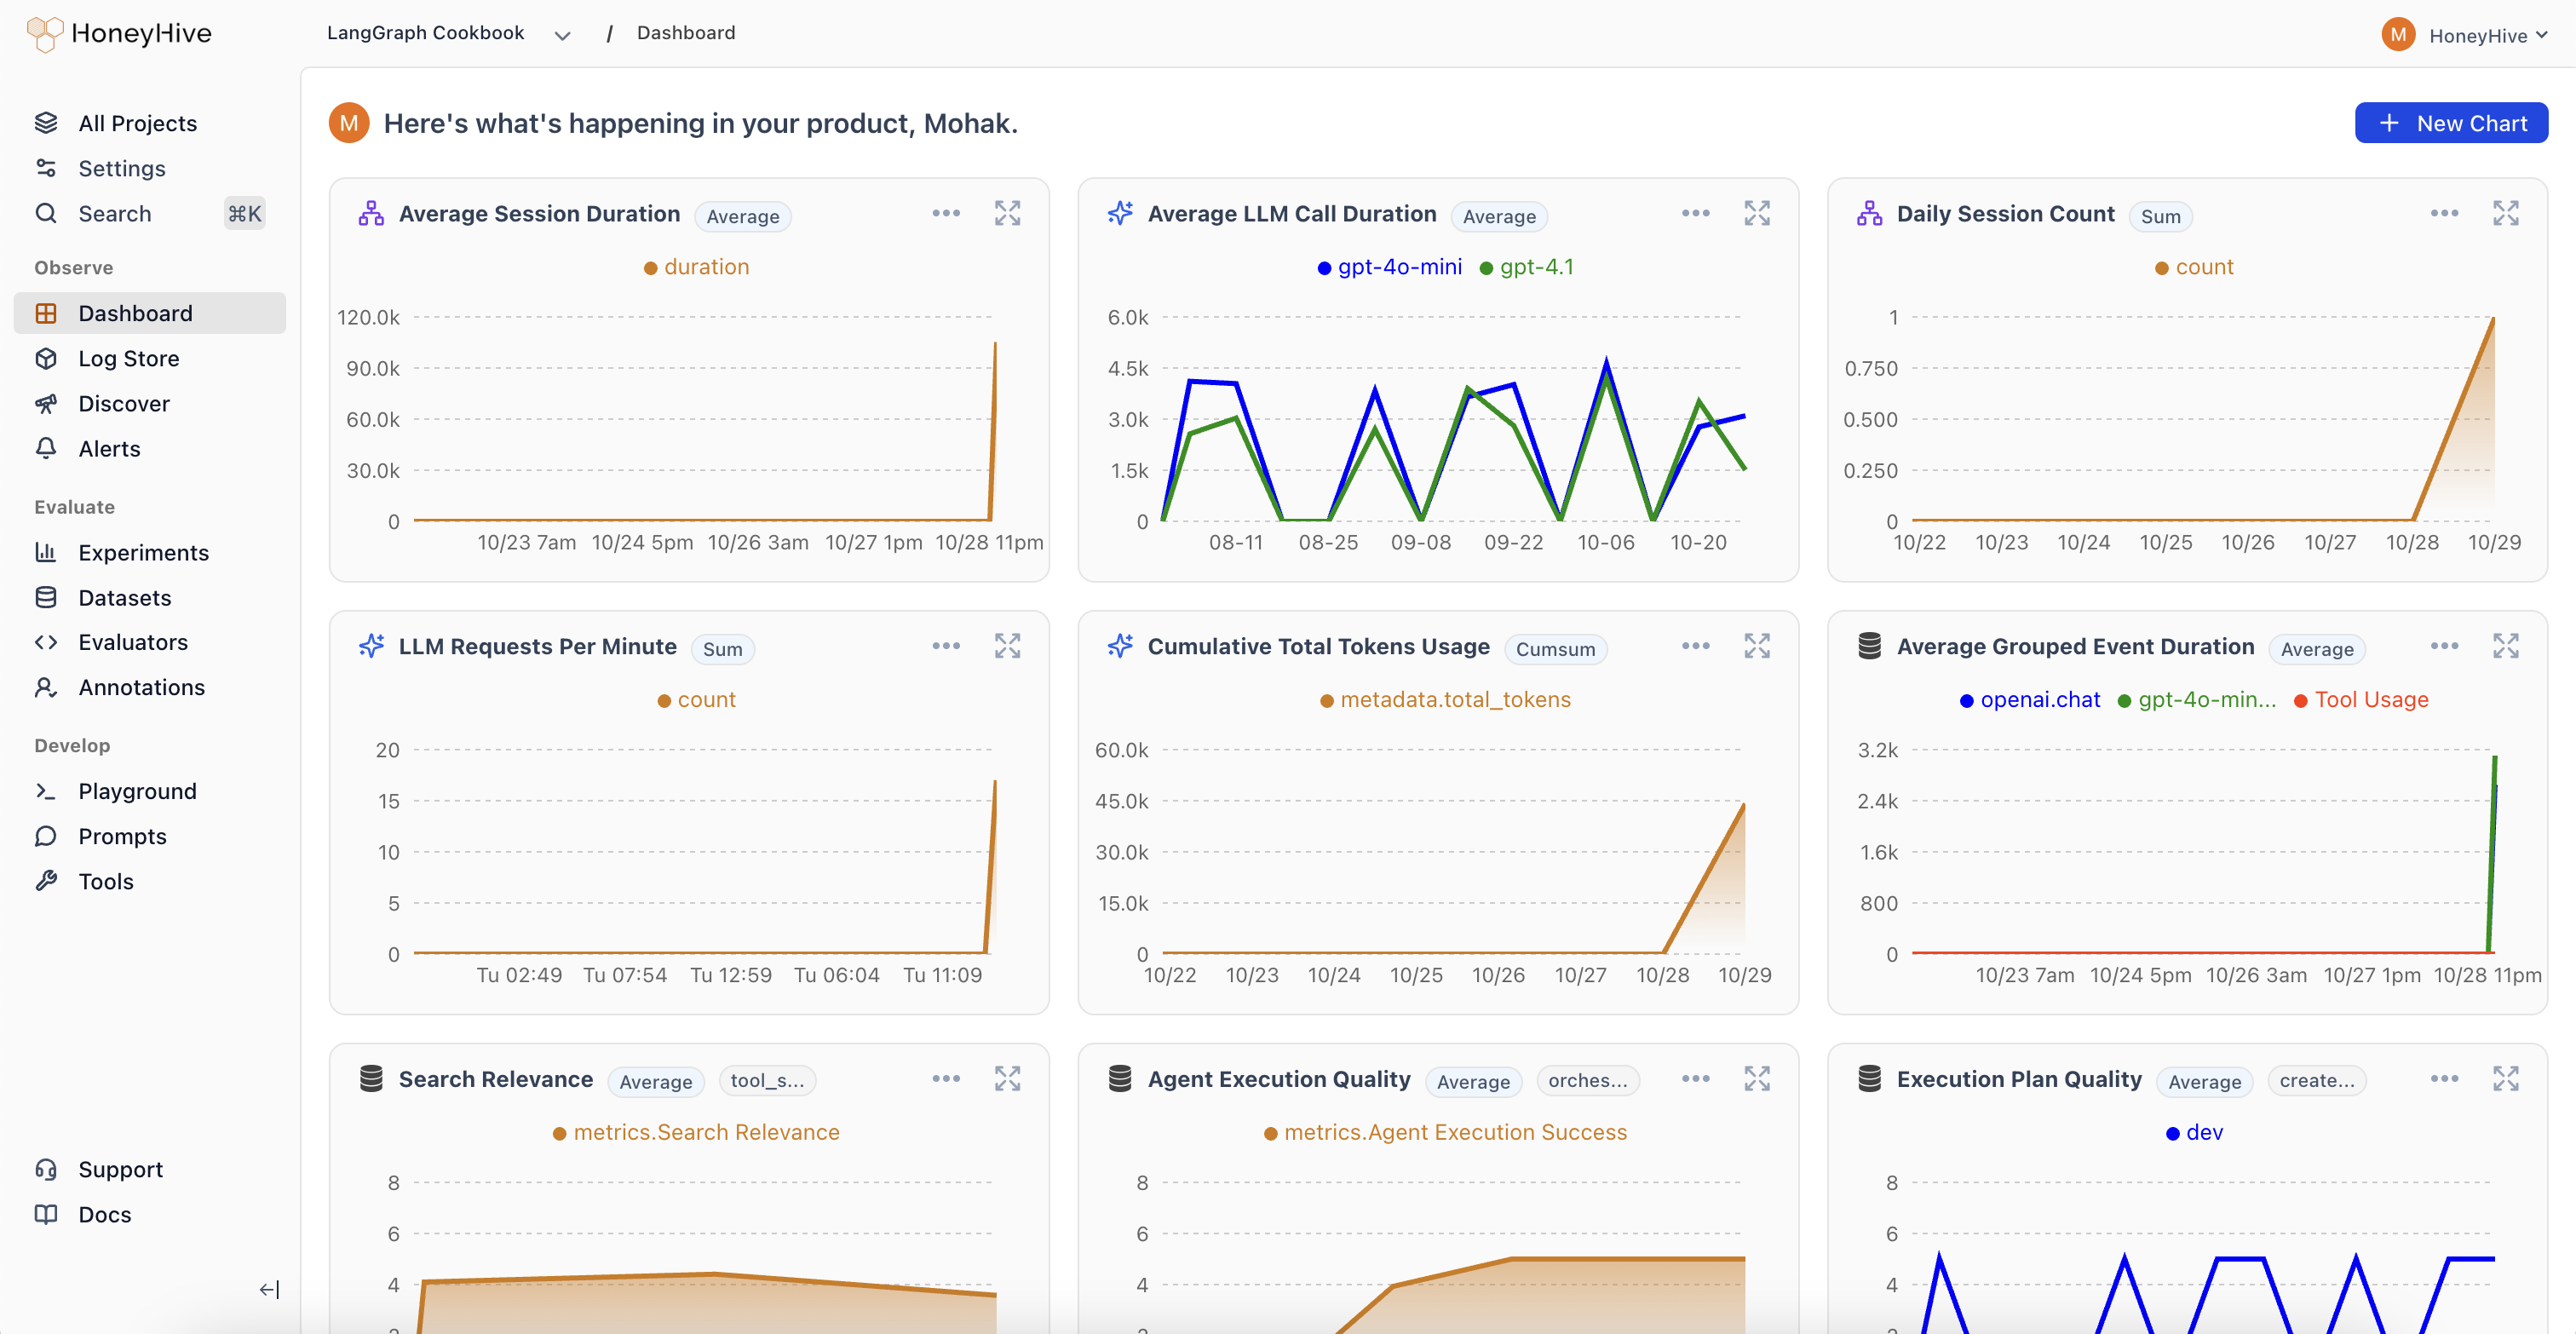
HoneyHive aggregates all your production data—traces, evaluations, and user feedback—in one place. This unified view lets you:- Detect Failures: Catch anomalies across your cost, usage, and quality metrics.
- Set Up Proactive Monitoring: Create automated alerts to notify you when metrics exceed thresholds or drift from expected values.
- Form Hypotheses: “I think response quality drops for after 5 agent actions.” “Our new RAG might be causing unintended hallucinations.”
- Explore Your Data: Craft queries to validate or refute these hypotheses in real-time.
- Iterate Continuously: Use insights to tweak prompts, swap models, or refine pipelines, then immediately see the impact.
Getting Started
To analyze and monitor your production data in HoneyHive, refer to the following resources:Creating Charts
How to build custom queries and save charts in your project dashboard
Creating Alerts
How to set up automated alerts to monitor your production llm traces