Evaluating External Logs
Upload and evaluate existing logs from external sources like spreadsheets or databases.
This guide shows you how to leverage HoneyHive’s evaluation capabilities even if your interaction logs already exist in external systems like Excel spreadsheets, CSV files, or database tables. The core idea is to load these external logs into a suitable format and then run HoneyHive evaluators on them.
This is particularly useful when you want to:
- Evaluate the quality of historical interactions.
- Benchmark different versions of prompts or models using past data.
- Apply new evaluation metrics to existing logs without rerunning the original generation process.
This guide assumes you are familiar with how experiments function in HoneyHive. If you need a refresher, please visit the Experiment’s Introduction page.
Overview
For this example, we will use a set of examples from the CNN / DailyMail dataset, to simulate a summarization task.
The dataset contains two key components:
article
: Contains the full text of news articles, which serves as our inputhighlights
: Contains human-written bullet-point summaries of each article, which we’ll use to simulate the expected output from our LLM summarization task
Step-by-Step Implementation
Full code example
Here’s a minimal example assuming you’ve loaded your external data into a list format:
Creating the Dataset
To evaluate your model’s performance, you’ll need to transform your external log data into a structured format that the evaluation framework can process. The framework expects a Python list of dictionaries, where each dictionary represents a single interaction containing:
- Request inputs
- Generated outputs
- Ground truth information (if available)
For instance, if your logs are stored in a CSV file, you can load them into a Pandas DataFrame and convert the data using df.to_dict(‘records’).
Each dictionary represents a single logged interaction. Then, you use the evaluate
function with your dataset and defined evaluators.
For the purposes of our example, we’ll assume our data has already been transformed into this required format:
This guide demonstrates defining the dataset directly within the script. Alternatively, you can upload your dataset (in JSON, JSONL, or CSV format) to the HoneyHive platform and then pass its dataset_id
when running the experiment.
For instructions on uploading and managing datasets within HoneyHive, please refer to the Upload Dataset page.
Defining the Evaluators
To assess the quality of our summarizations, we’ll implement two key evaluators: compression ratio and keyword overlap. These metrics help us understand both the length efficiency and content preservation of our summaries.
Compression ratio
The compression ratio evaluator measures how concise our summary is compared to the original article:
This simple metric returns a value between 0 and 1, where lower values indicate more aggressive summarization. For example, a ratio of 0.25 means our summary is one-quarter the length of the original article.
Keyword overlap
The keyword overlap evaluator assesses how well our summary preserves the main topics and key information from the original text:
This evaluator works in two steps:
First, it extracts the top 10 keywords from both the original article and the generated summary using TF-IDF (Term Frequency-Inverse Document Frequency) scoring. Then, it calculates the overlap ratio between these keyword sets, returning a score between 0 and 1. A higher score indicates better preservation of key concepts from the original article.
The evaluated function
The evaluated function is traditionally the function that will generate an output based on the input, like an LLM, whose outputs we want to evalute.
In this case, we alreavy have our outputs in our logs, so we can define a simple pass-through function to use the highglights
column as our output:
Running the Experiment
Finally, we can run the experiment by passing our dataset, function and evaluators to the evaluation harness:
Overview
This section demonstrates how to evaluate pre-existing logs using the HoneyHive TypeScript SDK. Similar to the Python example, the process involves structuring your external log data (like request inputs, generated outputs, and ground truth) into a format the SDK understands, defining a pass-through function, and creating client-side evaluators.
Full code example
Here’s a minimal TypeScript example:
Creating the Dataset
To evaluate your model’s performance, you’ll need to transform your external log data into a structured format that the evaluation framework can process. The framework expects a Python list of dictionaries, where each dictionary represents a single interaction containing:
-
Request inputs
-
Generated outputs
-
Ground truth information (if available)
For example, if your logs are stored in a CSV file, you can parse the data using a library like csv-parser or papaparse to convert it into an array of objects.
Each object represents a single logged interaction. Then, you use the evaluate
function with your dataset and defined evaluators.
For the purposes of our example, we’ll assume our data has already been transformed into this required format:
This guide demonstrates defining the dataset directly within the script. Alternatively, you can upload your dataset (in JSON, JSONL, or CSV format) to the HoneyHive platform and then pass its dataset_id
when running the experiment.
For instructions on uploading and managing datasets within HoneyHive, please refer to the Upload Dataset page.
Defining the Evaluators
To assess the quality of our summarizations, we’ll implement two key evaluators: compression ratio and keyword overlap. These metrics help us understand both the length efficiency and content preservation of our summaries.
Compression ratio
The compression ratio evaluator measures how concise our summary is compared to the original article:
This simple metric returns a value between 0 and 1, where lower values indicate more aggressive summarization. For example, a ratio of 0.25 means our summary is one-quarter the length of the original article.
Keyword overlap
The keyword overlap evaluator assesses how well our summary preserves the main topics and key information from the original text:
This evaluator works in two steps:
First, it extracts the top 10 keywords from both the original article and the generated summary using TF-IDF (Term Frequency-Inverse Document Frequency) scoring. Then, it calculates the overlap ratio between these keyword sets, returning a score between 0 and 1. A higher score indicates better preservation of key concepts from the original article.
The evaluated function
The evaluated function is traditionally the function that will generate an output based on the input, like an LLM, whose outputs we want to evalute.
In this case, we alreavy have our outputs in our logs, so we can define a simple pass-through function to use the highglights
column as our output:
Running the Experiment
Finally, we can run the experiment by passing our dataset, function and evaluators to the evaluation harness:
Dashboard View
Once the script runs, HoneyHive ingests each log entry as a trace, along with the computed client-side evaluator metrics. Navigate to your project in the HoneyHive dashboard to view the results. You can analyze distributions, filter by metadata, and compare metrics across your dataset.
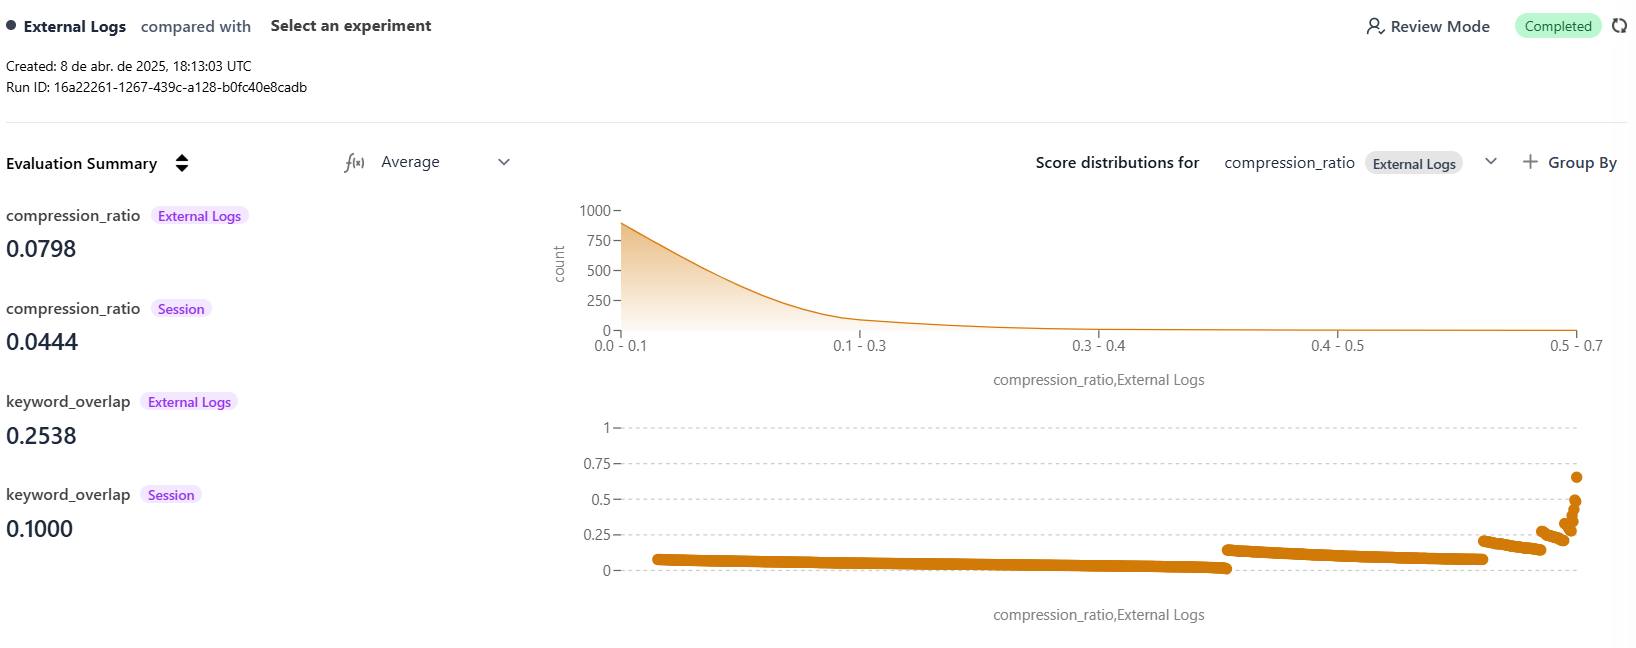
Image: Example evaluation view in HoneyHive.
Conclusion
By mapping your existing external logs to the HoneyHive evaluate
function’s expected format, you can apply powerful client-side and server-side evaluations without rerunning the original AI/LLM calls. This provides a flexible way to assess performance, track quality over time, and gain insights from historical data.
Next Steps
Introduction to Evaluators
Deep dive into HoneyHive’s evaluation framework, including custom evaluators.
Server-Side Evaluators
Learn about configuring evaluators that run asynchronously on HoneyHive’s infrastructure.
Managing Datasets
Explore how HoneyHive helps manage datasets for evaluations and experiments.