HoneyHive combines logs, metrics, and traces into a unified data model, leveraging the concept of high cardinality to provide a comprehensive view of your AI system’s performance and behavior. By consolidating these traditionally separate observability pillars into a single, flexible event-based structure, we enable developers to gain deeper insights and perform more sophisticated analyses. This approach offers several key benefits:
  • Unified Context: Each event captures not just raw data, but also the surrounding context, allowing for more meaningful correlations and insights.
  • Flexible Querying: High cardinality enables precise filtering and aggregation across multiple dimensions, facilitating complex analyses and troubleshooting.
  • Scalability: The event-based model scales efficiently with the growing complexity of AI systems and the increasing volume of observability data.
  • Faster Debugging: The ability to trace a request through various components while simultaneously accessing logs and metrics streamlines the debugging process.

Introducing Events

The base unit of data in HoneyHive is called an event, which represents a span in a trace. A root event in a trace is of the type session, while all non-root events in a trace can be of 3 core types - model, tool and chain.
All events have a parent-child relationship, except session event, which being a root event does not have any parents.
  • session: A root event used to group together multiple model, tool, and chain events into a single trace. This is achieved by having a common session_id across all children.
  • model events: Used to track the execution of any LLM requests.
  • tool events: Used to track execution of any deterministic functions like requests to vector DBs, requests to an external API, regex parsing, document reranking, and more.
  • chain events: Used to group together multiple model and tool events into composable units that can be evaluated and monitored independently. Typical examples of chains include retrieval pipelines, post-processing pipelines, and more.
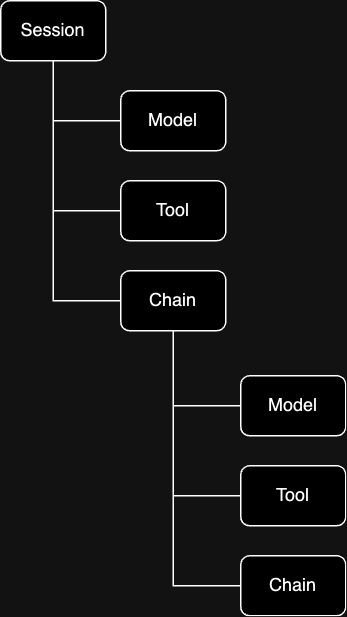
Here’s a visual representation of the event hierarchy:
All events have the following properties:
  • event_id: A unique identifier for the event.
  • event_type: The type of event. Can be model, tool or chain.
  • event_name: The name of the event. This can be the model name, the tool name, etc.
  • source: The source of the event. This can be “production”, “dev”, etc.
  • session_id: A unique identifier for the session. For a session, all events have the same session_id.
  • project_id: A unique identifier for the project. For a project, all events have the same project_id.
  • start_time: The UTC timestamp (in milliseconds) when the event started.
  • end_time: The UTC timestamp (in milliseconds) when the event ended.
  • duration: The duration of the event in milliseconds. This can be the model latency, the tool latency, etc.
  • config: The configuration of the event. This can be the model configuration, the tool configuration, etc.
  • inputs: The inputs to the event. This can be the prompt, the vector query, etc.
  • outputs: The outputs of the event. This can be a completion, a vector response, an API response, etc.
  • error: The error message of the event. This can be a rate limit error, failed retrieval error, etc.
  • metadata: Additional metadata about the event. This can be the product metadata, error metadata, etc.
  • user_properties: The user properties of the event. This can be the user id, country, tier, etc.
  • metrics: The metrics associated with the event. This can be model metrics, tool metrics, etc.
  • feedback: The feedback for the event. This can be the user feedback, the model feedback, etc.

Session Events

Session events are used to track the execution of your application. These can be used to capture
  • Session configuration like the application version, environment, etc.
  • Session metrics like session latency, session throughput, etc.
  • Session properties like user id, country, tier, etc.
  • Session feedback like overall session feedback, etc.

Schema for Session Events

Root FieldFieldTypeDescriptionReserved
configapp_versionstringThe version of the LLM application currently running.No
source-stringThe environment/deployment context (production, staging, etc.).No
sessionsession_idstringUnique identifier for the session/interaction.No
start_timeNumberMinimum UTC timestamp (ms) of start_time in session hierarchy.No
end_timeNumberMaximum UTC timestamp (ms) of end_time in session hierarchy.No
durationNumberCalculated difference between end_time and start_time (ms).No
metadatanum_eventsNumberTotal number of events captured during the session.Yes
num_model_eventsNumberNumber of model-related events (LLM requests) in session.Yes
has_feedbackBooleanIndicates if session contains user feedback events.Yes
costNumberTotal LLM usage cost based on provider’s pricing model.Yes
total_tokensNumberTotal tokens processed (input + output).Yes
prompt_tokensNumberTokens in user prompts/input.Yes
completion_tokensNumberTokens in LLM-generated responses.Yes
user_propertiesuser_idstringUnique identifier for the user.No
user_tierstringUser subscription tier (free/pro).No
user_tenantstringTenant/organization for multi-tenant applications.No
Properties marked as “Reserved” in the schema are automatically calculated and managed internally by HoneyHive’s auto-tracing system.

Example for Session Events

Here’s an example session event:

Model Events

Model events represent a request made to an LLM. These can be used to capture
  • Model configuration like model name, model hyperparameters, prompt template, etc.
  • Model metrics like completion token count, cost, tokens per second, etc.
  • API-level metrics like request latency, rate limit errors, etc.

Schema for Model Events

Root FieldFieldTypeDescriptionReferenceCritical
configmodelStringThe name or identifier of the LLM model being used for the request.Yes
providerStringThe provider or vendor of the LLM model (e.g., Anthropic, OpenAI, etc.).Based on LiteLLM’s list of providersYes
temperatureNumberThe temperature hyperparameter value used for the LLM, which controls the randomness or creativity of the generated output.Yes
max_tokensNumberThe maximum number of tokens allowed to be generated by the LLM for the current request.Yes
top_pNumberThe top-p sampling hyperparameter value used for the LLM, which controls the diversity of the generated output.Yes
top_kNumberThe top-k sampling hyperparameter value used for the LLM, which controls the diversity of the generated output.Yes
templateArrayThe prompt template or format used for structuring the input to the LLM.Yes
typeStringType of model request - “chat” or “completion”.Yes
toolsArrayArray of OpenAI compatible tool list.OpenAI API - Function CallingYes
tool_choiceStringTool selection choice.Yes
frequency_penaltyNumberControls the model’s likelihood to repeat information.Yes
presence_penaltyNumberControls the model’s likelihood to introduce new information.Yes
stop_sequencesArrayArray of strings that will cause the model to stop generating.Yes
is_streamingBooleanBoolean indicating if the response is streamed.Yes
repetition_penaltyNumberControls repetition in the model’s output.Yes
userStringPerson who created the prompt.No
headersObjectObject containing request headers.No
decoding_methodStringString specifying the decoding method.No
random_seedNumberNumber used for reproducible outputs.No
min_new_tokensNumberMinimum number of new tokens to generate.No
{custom}AnyAny additional configuration properties to trackNo
inputschat_historyArrayThe messages or context provided as input to the LLM, typically in a conversational or chat-like format.OpenAI API - Chat MessagesYes
functionsObjectOpenAI compatible functions schema.OpenAI API - Function CallingNo
nodesArrayArray of strings - text chunks from retrievers.No
chunksArrayArray of strings - text chunks from retrievers.No
{custom}AnyAny arbitrary input properties to trackNo
outputschoicesArrayArray of OpenAI compatible choices schema.OpenAI API - Chat CompletionYes
roleStringThe role or perspective from which the LLM generated the response (e.g., assistant, user, system).No
contentStringThe actual response message generated by the LLM.No
{custom}AnyAny additional output properties to trackNo
metadatatotal_tokensNumberThe total number of tokens in the LLM’s response, including the prompt and completion.Yes
completion_tokensNumberThe number of tokens in the generated completion or output from the LLM.Yes
prompt_tokensNumberThe number of tokens in the prompt or input provided to the LLM.Yes
costNumberThe cost or pricing information associated with the LLM request, if available.Yes
system_fingerprintStringSystem fingerprint string.No
response_modelStringResponse model string.No
status_codeNumberHTTP status code of the request.No
{custom}AnyAny additional metadata propertiesNo
metrics{custom}AnyAny custom metrics or performance indicatorsNo
feedback{custom}AnyAny end-user provided feedbackNo
duration-NumberThe total time taken for the LLM request, measured in milliseconds, which can help identify performance bottlenecks or slow operations.No
error-StringAny errors, exceptions, or error messages that occurred during the LLM request, which can aid in debugging and troubleshooting.No
Properties marked as reserved are required by HoneyHive for core functionality:
  • Model configuration, inputs, and outputs properties are used for rendering and replaying requests in the HoneyHive playground
  • Token counts and cost metadata are used for aggregating session-level analytics
All other properties are recommendations based on our auto-tracing system and can be customized based on your needs.

Example for Model Events

Here’s an example model event:

Tool Events

When your LLM application interacts with external APIs, databases, or vector databases like Pinecone, you can instrument these interactions to evaluate performance, debug issues, and gain insights. Tool events are used to track the execution of anything other than the model. These can be used to capture
  • Tool configuration like vector index name, vector index hyperparameters, any internal tool configuration, etc.
  • Tool metrics like retrieved chunk similarity, internal tool response validation, etc.
  • API-level metrics like request latency, index errors, internal tool errors, etc.

Schema for Tool Events

The tool event represents an interaction with an external resource. Send the following fields:
Root FieldFieldTypeDescriptionReserved
configproviderstringThe name of the external service provider offering vector database, API, or other relevant services (e.g., Pinecone, Weaviate, etc.).No
instancestringThe specific instance or deployment name of the service within the provider’s infrastructure, allowing for differentiation between multiple instances or deployments.No
embedding_modelstringThe name or identifier of the embedding model used for calculating vector similarity, which is particularly relevant for vector databases or services that rely on vector representations of data.No
chunk_sizeintegerThe size (in characters or tokens) of the chunks into which data is split before being converted into vectors, if applicable to the service being used. This is important for services that operate on chunked data.No
chunk_overlapintegerThe amount of overlap (in characters or tokens) between consecutive chunks of data, if applicable to the service being used. This is also relevant for services that operate on chunked data with overlapping segments.No
db_vendorstringVector database provider name.No
{custom}AnyAny additional configuration properties to trackNo
inputstop_kintegerThe number of top-ranked or most similar results to be retrieved from the vector database or service during a similarity search or ranking operation.No
querystringThe query string, vector representation, or any other input data used for retrieval, search, or processing by the external service.No
urlstringExternal API URL.No
{custom}AnyAny arbitrary input properties to trackNo
outputschunksarrayThe data chunks, documents, or any other output retrieved or obtained from the external service as a result of the query or operation performed.No
scoresarray<number>The similarity scores, relevance scores, or any other scoring metrics associated with the retrieved chunks or documents, if applicable to the service being used.No
nodesarray<string>Text chunks from retrievers.No
{custom}AnyAny additional output properties to trackNo
metricsread_unitsnumberVector Database Utilization metric.No
write_unitsnumberVector Database Utilization metric.No
{custom}AnyAny custom metrics or performance indicatorsNo
metadataoperationIdstringOperation identifier.No
{custom}AnyAny additional metadata propertiesNo
duration-integerThe total time taken for the request or interaction with the external service, measured in milliseconds, which can be useful for identifying performance bottlenecks or slow operations.No
error-stringAny errors, exceptions, or error messages that occurred during the retrieval request or interaction with the external service, which can aid in debugging and troubleshooting.No
feedback{custom}AnyAny end-user provided feedbackNo

Example for Tool Events

Here’s an example tool event:

Chain Events

Chain events help with categorizing the events into different stages of the pipeline. These can be synchronous or asynchronous stages. How Chain Events Work Any event that has its “parent” set to a chain event becomes a step within that chain. This simple mechanism allows you to consolidate various events into a single unit, making it easier to monitor the progress of your pipeline. Nesting for Hierarchy You can also nest chains within each other. This hierarchical approach lets you track the execution of your pipeline in a structured and organized manner. This nesting feature can be particularly useful for complex workflows.
Session Event as a Special Case: As a special case, the “session event” for a pipeline is essentially a chain event with all other events as its children. This means you can encapsulate the entire pipeline within a single session event, making it easy to manage and analyze.
By separating events into chains, you can track properties like:
  • Chain configuration like chain name, chain settings, etc.
  • Chain metrics like chain latency, chain throughput, etc.
Here’s an example chain event:

Next Steps

Refer to our tracing introduction guide to get started with tracing in HoneyHive.

Tracing Introduction

Getting started with tracing in HoneyHive.