Session aggregates provide a high-level view of user behavior and application performance by automatically aggregating properties from children spans to the session / root-span level. This feature allows you to analyze key metrics and gain insights into how users interact with your LLM application.

Session-Level Metrics

Session Aggregates calculate various metrics at the session level to provide a comprehensive understanding of user behavior and application performance. Some key metrics include:

Root FieldFieldDescription
metadatanum_events 1The total number of events captured during the session.
num_model_events 1The number of model-related events (e.g., LLM requests) within the session.
has_feedback 1A boolean indicating whether the session contains any events with user feedback.
cost 1The total cost incurred for LLM usage during the session, based on the pricing model of the LLM provider.
total_tokens 1The total number of tokens processed by the LLM during the session, including both user input and generated output.
prompt_tokens 1The number of tokens in the user input or prompts during the session.
completion_tokens1The number of tokens in the LLM-generated responses during the session.
start_timeThe minimum UTC timestamp (in milliseconds) of start_time field of the session and its children.
end_timeThe maximum UTC timestamp (in milliseconds) of end_time field of the session and its children.
durationThe difference of the end_time and start_time aggregates. Measured in milliseconds. However, this field will not be aggregated if manually declared.

1 These fields are reserved for sessions and will be overwritten if manually defined.

Coming soon: Aggregations for the following fields:

  • outputs : The outputs field from the final event will be inherited on to the session.
  • error : The session will adopt the error field from the last child event that encountered a failure.
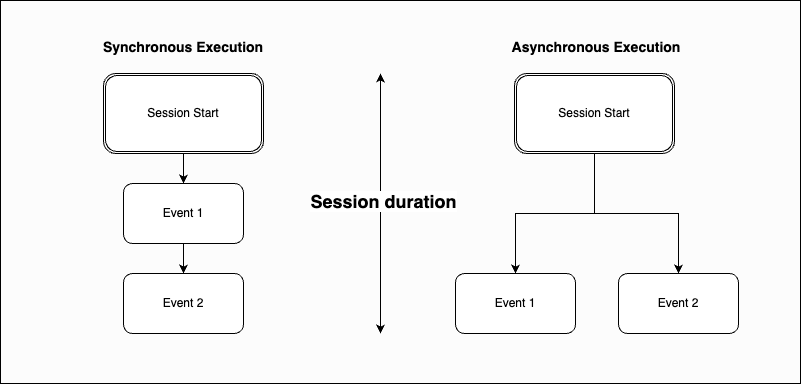
Session Duration

The duration of a session will be determined in one of two ways:

  1. If the duration field is manually provided to the session, that value will be used.
  2. Otherwise, the duration will be calculated by subtracting the earliest start time from the latest end time within the session.

This method works for both synchronous and asynchronous events because it captures the total span of time during which the session is active.

Synchronous Execution: Events occur one after another without overlap. The duration from the start of the first event to the end of the last event represents the total session duration. Asynchronous Execution: Events may overlap. Despite this, the duration from the earliest start to the latest end time still captures the full active period of the session.

By using max(end_time) - min(start_time), we ensure that the duration accurately reflects the total time span covered by all events within a session.

Analyzing session aggregates

The HoneyHive dashboard provides an intuitive interface to explore and analyze session-level metrics. You can:

  • View trends and patterns in session metrics over time using interactive charts and graphs.
  • Compare metrics across different user segments, application versions, or other dimensions using filters.
  • Identify sessions with abnormal behavior, such as long durations or high costs, and drill down into individual session traces for further investigation.

Coming soon: Set up alerts and notifications based on thresholds or anomalies in session metrics to proactively monitor application health and user experience.

By leveraging session aggregates, you can gain valuable insights into how users interact with your LLM application, identify areas for optimization, and make data-driven decisions to improve user experience and application performance.

Best Practices

To get the most value out of session sggregates, consider the following best practices:

  • Ensure consistent instrumentation of session start followed by events operations across your application to accurately capture session boundaries.
  • Use meaningful and consistent naming conventions for user properties and other dimensions to enable effective segmentation and analysis.
  • Regularly review session metrics to identify trends, anomalies, and opportunities for improvement.
  • Collaborate with cross-functional teams, such as product, engineering, and customer success, to share insights and drive data-driven decision-making.

By following these best practices and leveraging the power of sessions aggregates, you can gain a deeper understanding of your LLM application’s performance and user behavior, enabling you to deliver better experiences and drive business success.