This integration requires
honeyhive Python SDK 1.4.0 or later, which includes the honeyhive.adapters.copilot_studio adapter.How it works
This guide uses an Event Hub for real-time forwarding. Batched export to Blob Storage also works, with a blob trigger in place of the Event Hub trigger.How Copilot Studio events map to HoneyHive
The adapter convertsAppEvents, AppRequests, and AppDependencies records into spans. AppTraces and similar records carry log signals rather than spans and are skipped; AppExceptions aren’t mapped yet. Each converted record becomes one span:
| Copilot Studio event | HoneyHive event name | Captured as |
|---|---|---|
BotMessageReceived | user_input | chain event, user message in inputs |
BotMessageSend | agent_output | chain event, agent response in outputs |
OnErrorLog | agent_error | chain event, error status and error.type |
| Other events (topics, generative answers, and so on) | agent_action | chain event |
chain event, and each Copilot Studio conversation shows up as a single session. The event name (user_input, agent_output, and so on) distinguishes each kind, with the message content captured in the event’s inputs and outputs.
Prerequisites
- Python 3.11+
- Azure Functions Core Tools v4
- Azure Developer CLI (
azd) - A Copilot Studio agent sending telemetry to Application Insights
- An Azure Event Hub to receive diagnostic exports
- A HoneyHive project and API key from Settings > Project > API Keys
Setup
Connect Copilot Studio to Application Insights
In Copilot Studio, open your agent and go to Settings > Advanced > Application Insights. Paste the connection string from your Application Insights resource, then enable: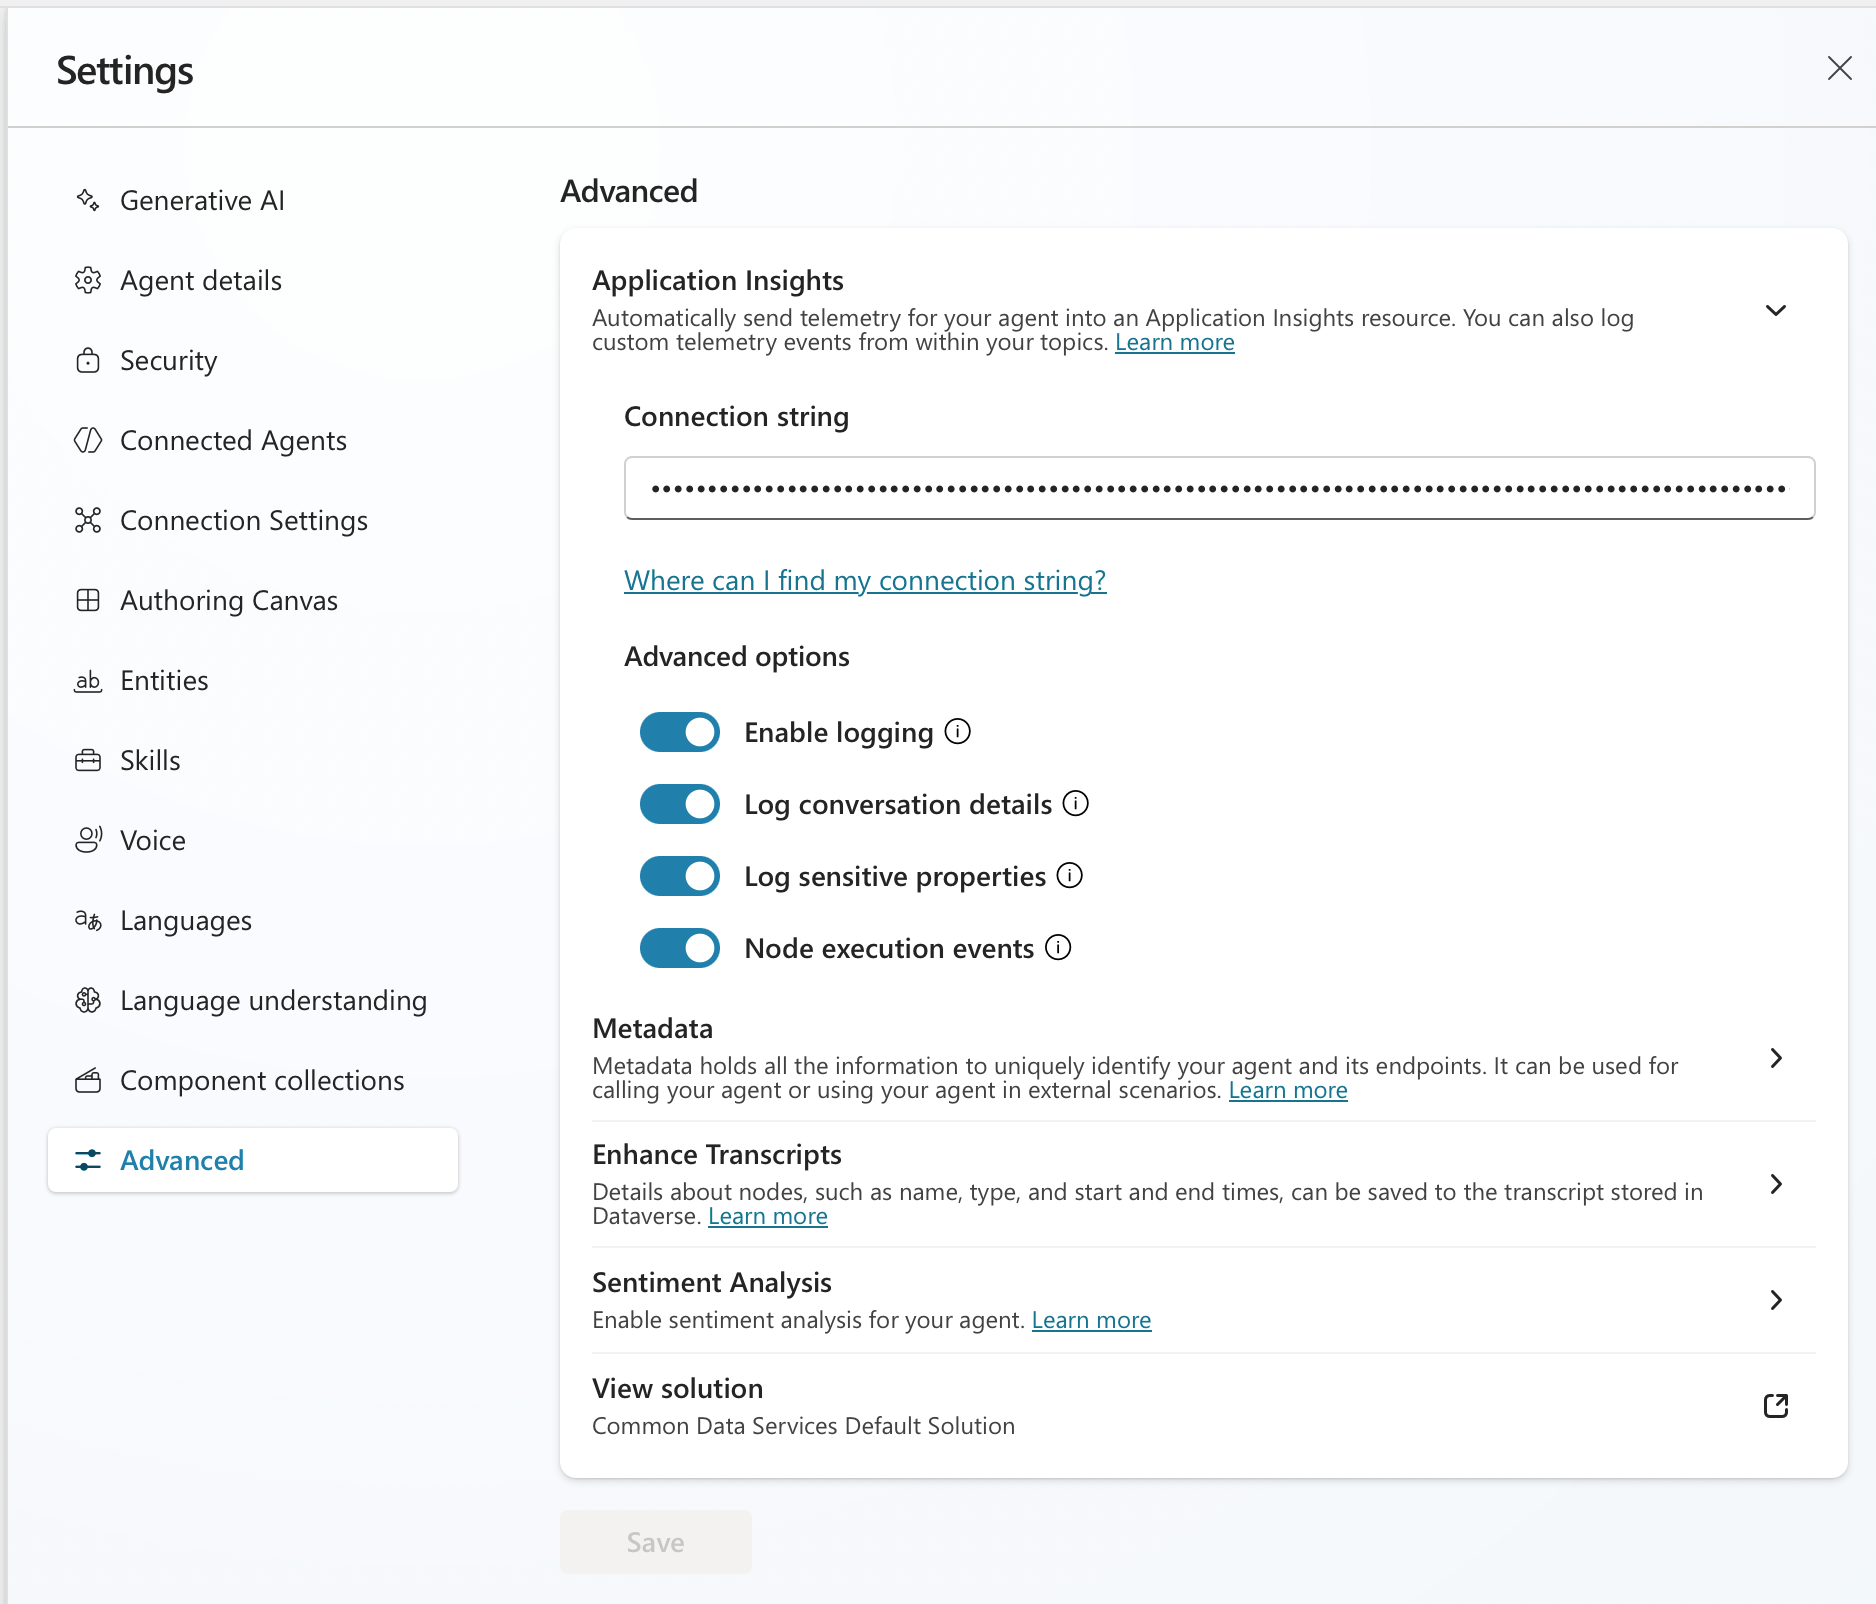
- Enable logging so incoming and outgoing messages and events are logged
- Log conversation details so user ID, user name, and message text are captured
Provision Azure infrastructure
The quickest path is Minimum required resources:
azd init with the official Event Hub Functions template, then replace the generated function_app.py with the forwarder code below:- Function App (Flex Consumption or Consumption plan, Python 3.11+)
- Storage Account (required by the Functions runtime)
- Event Hub namespace + hub wired to your Copilot Studio diagnostic export
Configure Copilot Studio diagnostic export
In the Azure portal, open the Application Insights resource used by your Copilot Studio agent and go to Diagnostic settings > Add diagnostic setting.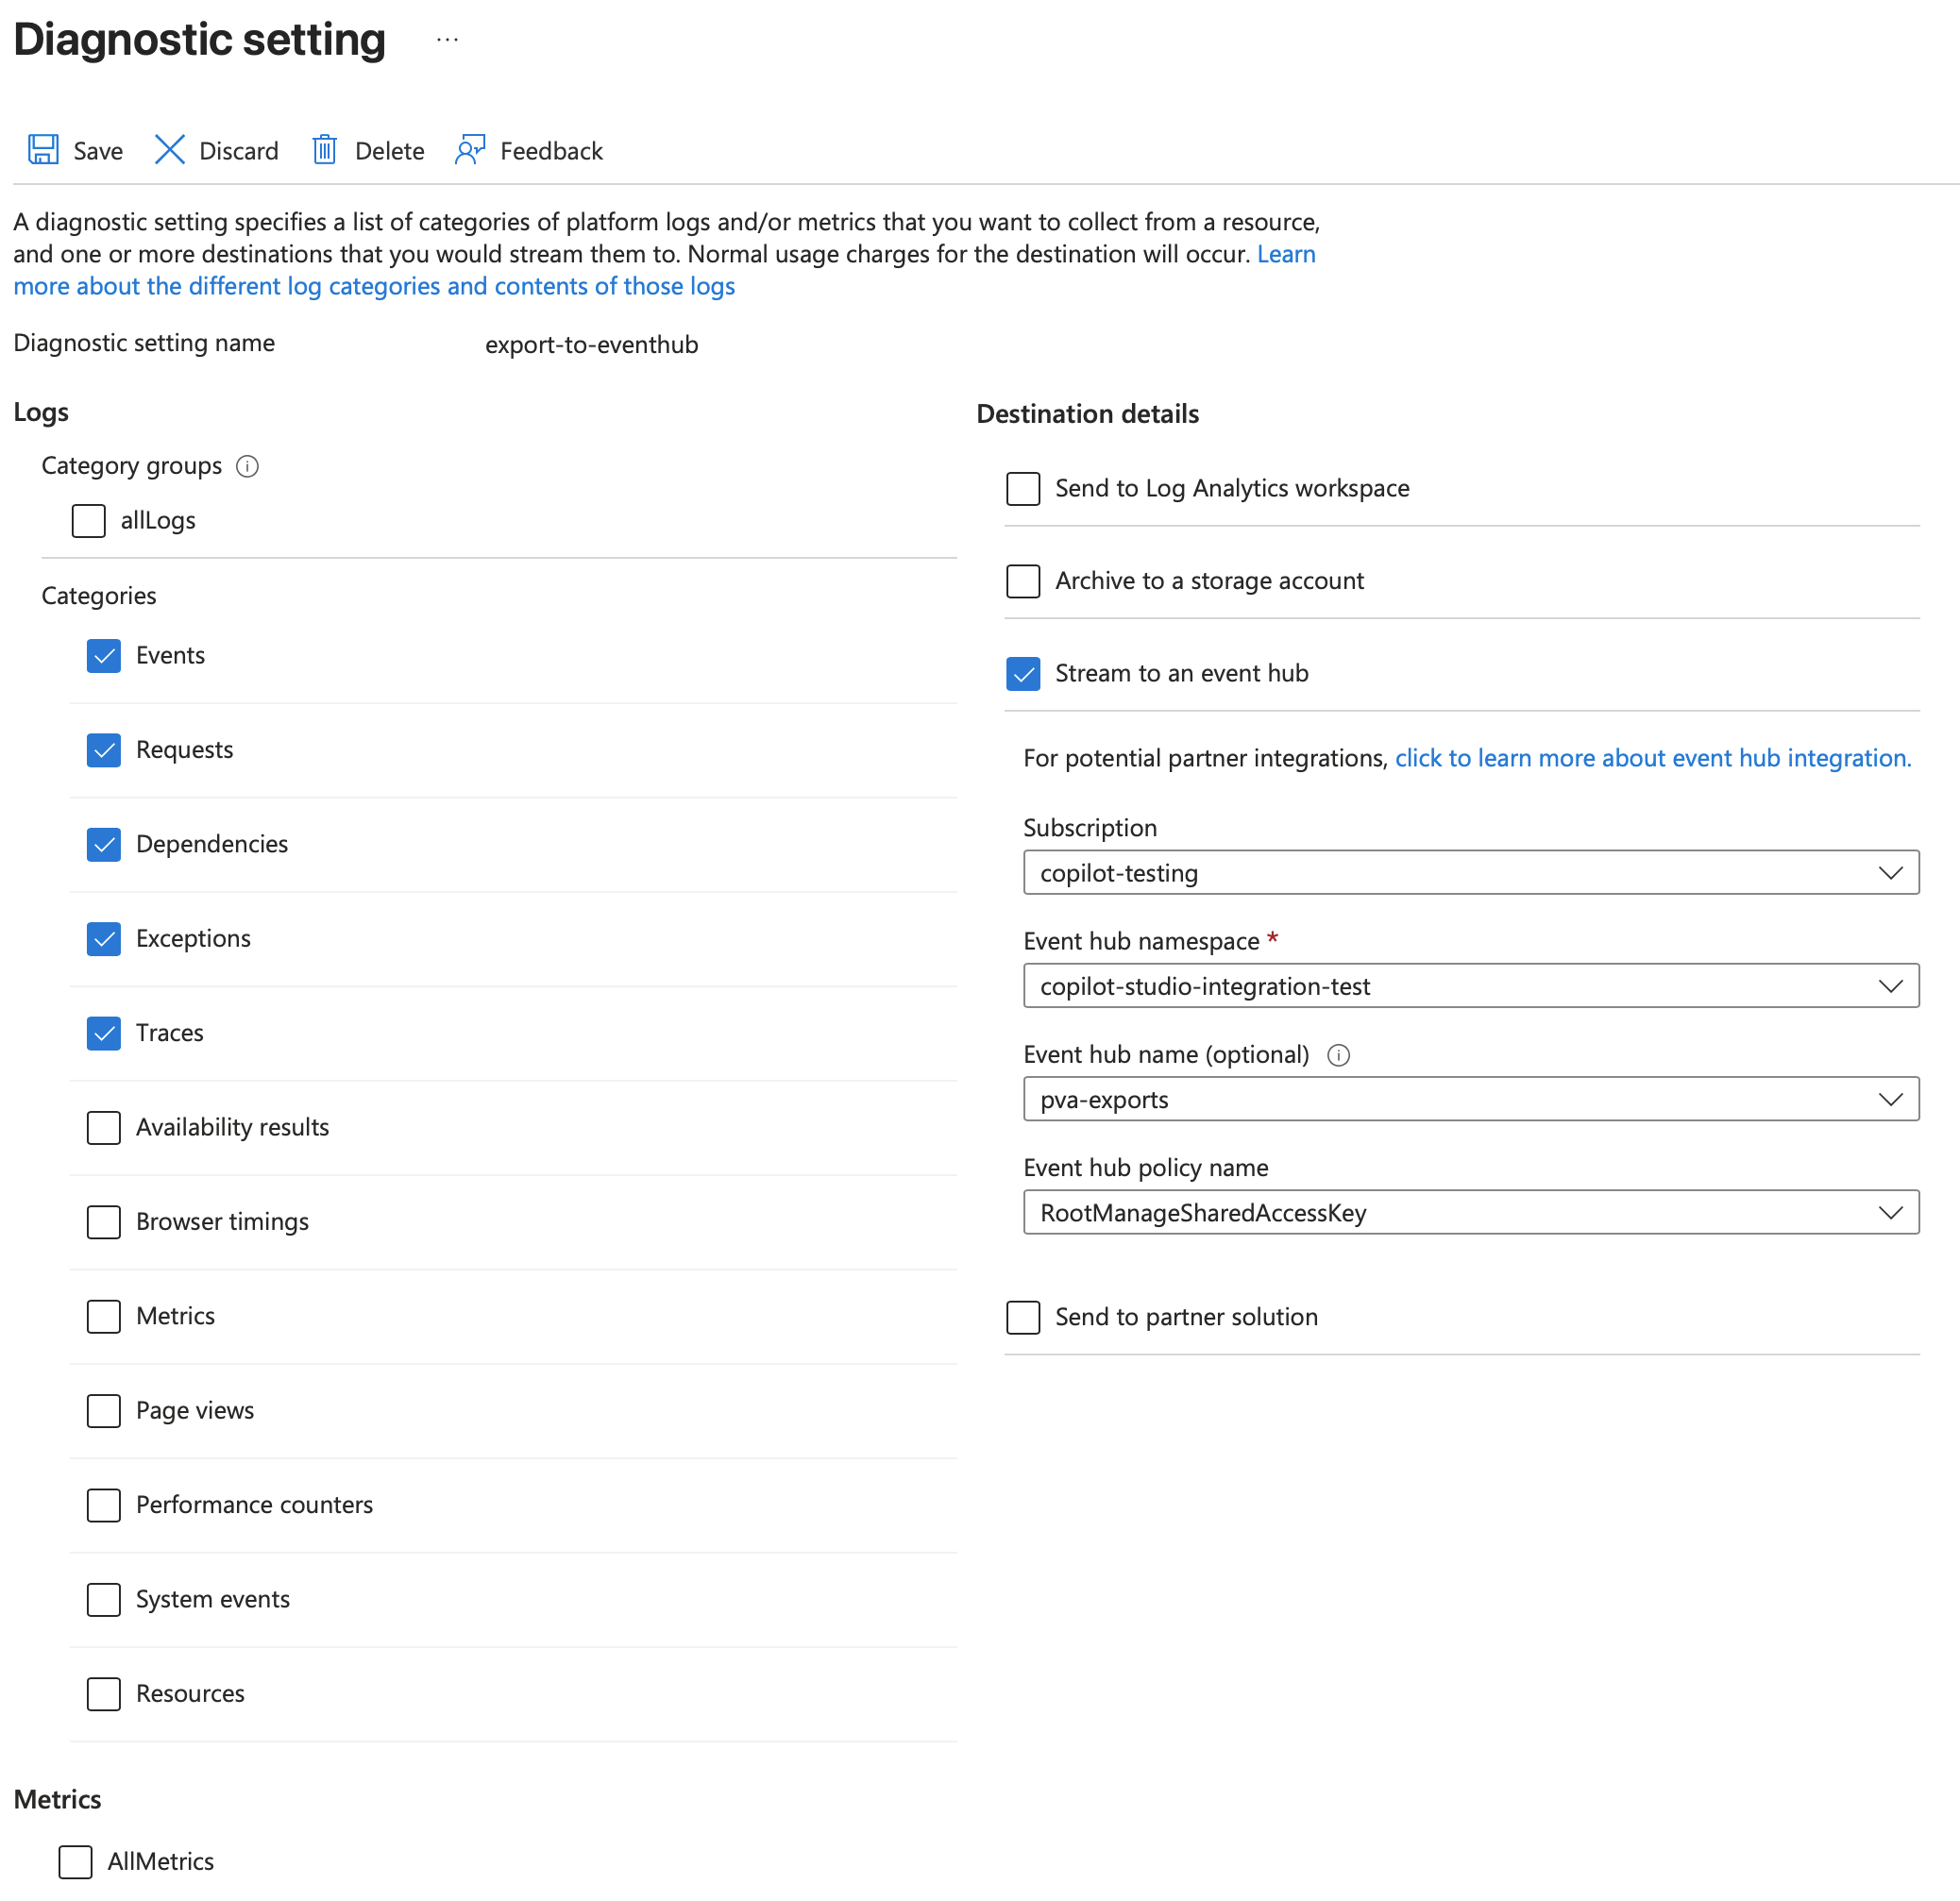
- Select log categories:
AppEvents,AppRequests,AppDependencies - Set the destination to Stream to an event hub and select your Event Hub namespace and hub
Forward records with the adapter
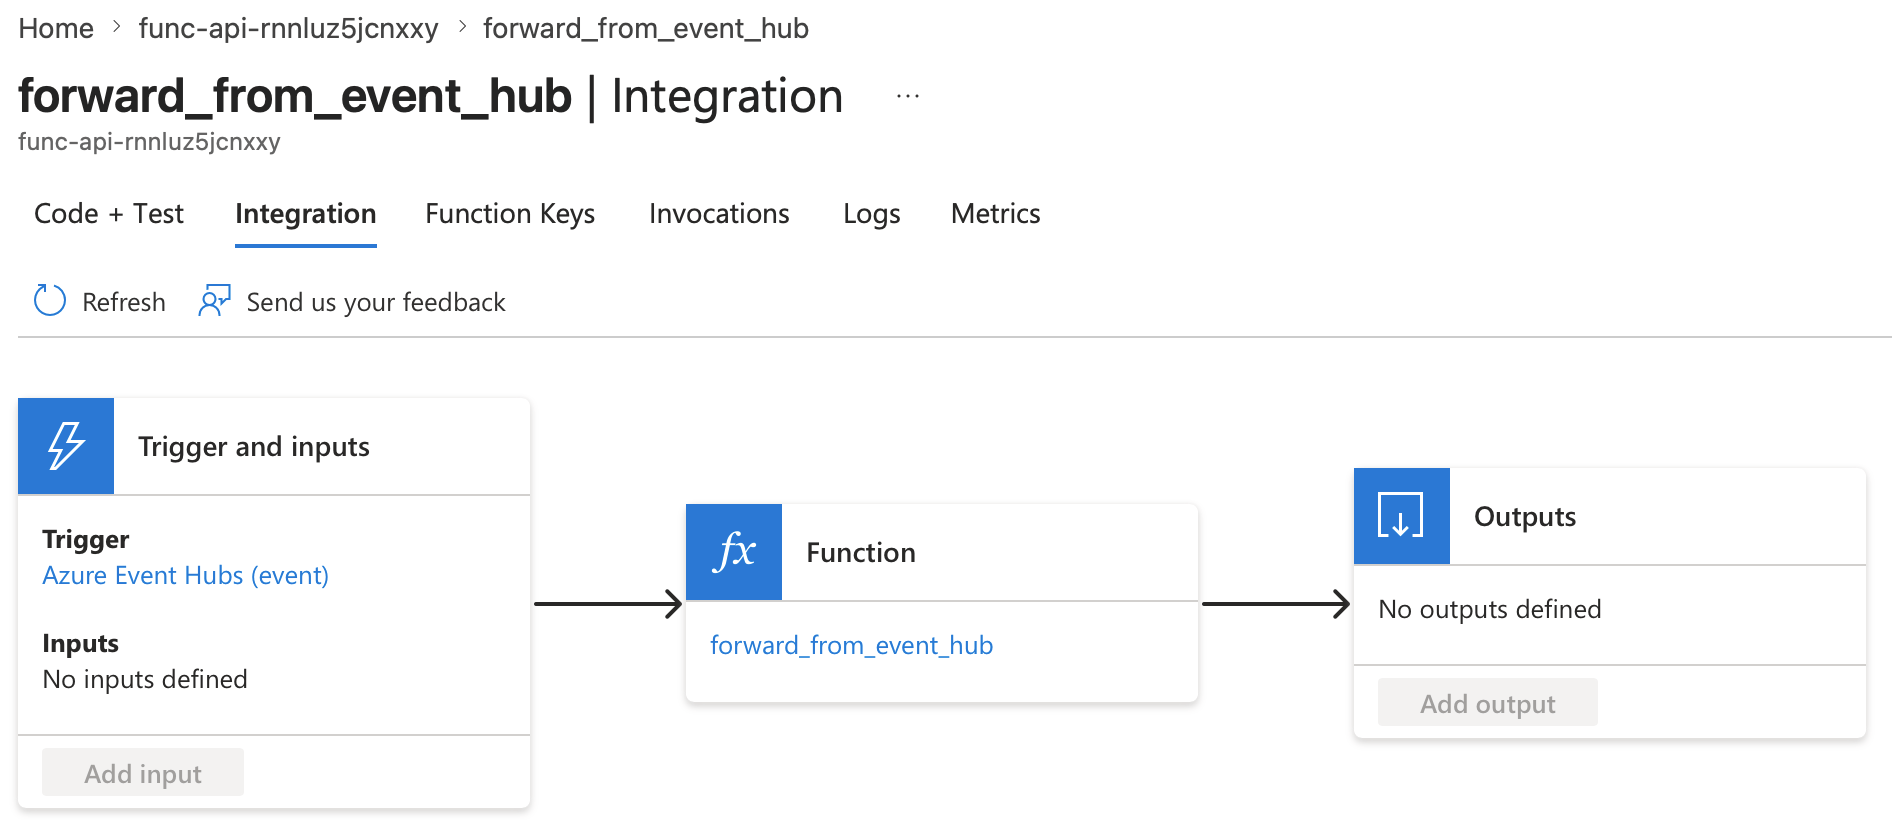
The Event Hub trigger unpacks each message’s
records array, converts them to spans, and exports them:copilot_studio_records_to_spans accepts Azure Monitor diagnostic-export records and returns OpenTelemetry ReadableSpan objects, handling trace and session correlation. For batched export, swap the Event Hub trigger for a blob trigger that reads the archived records and passes the same records list to the adapter.Add these dependencies to the project’s requirements.txt:Set application settings
Set the OTLP export settings and the Event Hub connection on the Function App.Always required:
Event Hub trigger:
| Setting | Description |
|---|---|
OTEL_EXPORTER_OTLP_ENDPOINT | Your HoneyHive data plane host with the /opentelemetry path (for example https://api.dp1.us.honeyhive.ai/opentelemetry). The HTTP exporter appends /v1/traces |
OTEL_EXPORTER_OTLP_HEADERS | authorization=Bearer <your-honeyhive-api-key> |
| Setting | Description |
|---|---|
EventHubConnection | Connection string for the Event Hub namespace |
EVENT_HUB_NAME | Name of the Event Hub receiving diagnostic exports |
EVENT_HUB_CONSUMER_GROUP | Consumer group; defaults to $Default |
Verify in HoneyHive
Generate Copilot Studio activity
Chat with your Copilot Studio agent (the test canvas works) so it emits telemetry to Application Insights and through the diagnostic export.
Check forwarded traces
In Traces, search for your agent name. Each conversation appears as one session, with 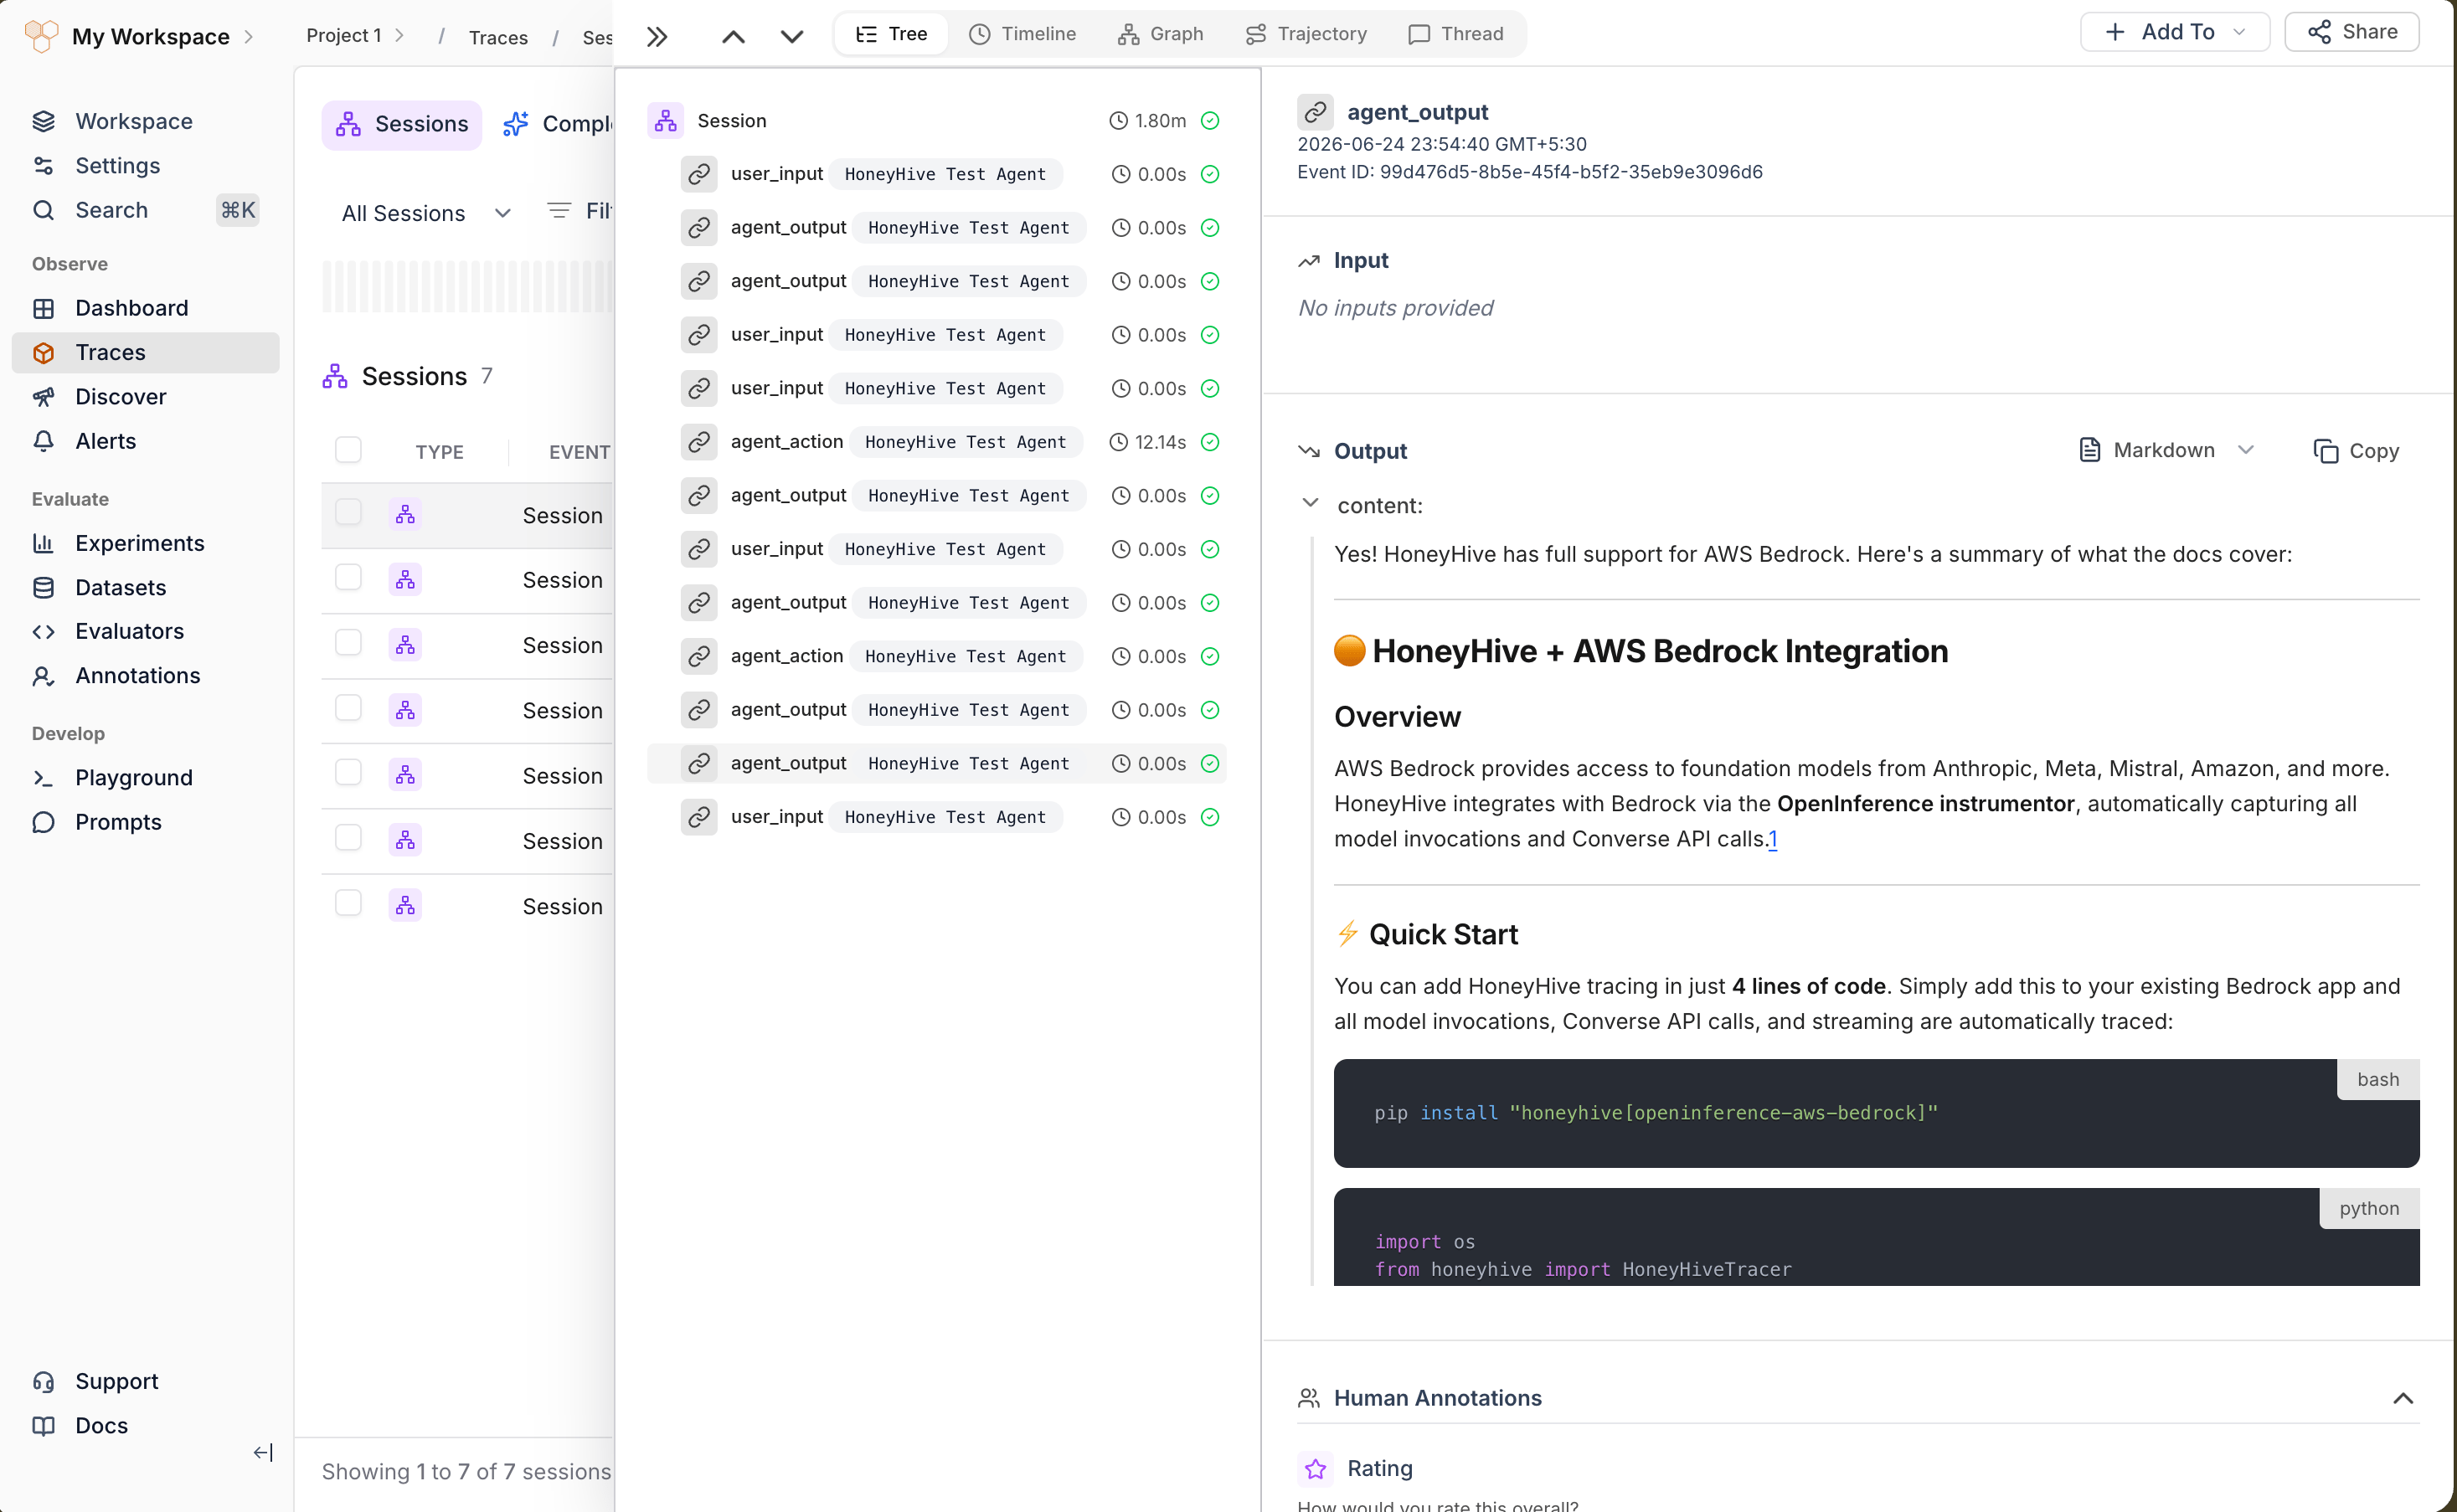
user_input, agent_output, and any agent_error spans carrying the message content as inputs and outputs.Optional settings
Set these as Function App application settings:| Setting | Values | Default | Description |
|---|---|---|---|
COPILOT_STUDIO_ADAPTER_KEEP_TOPIC_SPANS | true | off | Emit TopicStart, TopicEnd, TopicAction, and root spans as agent_action instead of dropping them |
COPILOT_STUDIO_ADAPTER_DEBUG | true | off | Attach the raw source record as debug.raw_record on each span |
Troubleshooting
| Symptom | Fix |
|---|---|
| No traces in HoneyHive | Confirm OTEL_EXPORTER_OTLP_ENDPOINT and the authorization=Bearer <your-honeyhive-api-key> header are set on the Function App, and that the API key matches the target project |
| Function runs but emits no spans | Confirm the diagnostic export includes AppEvents, AppRequests, and AppDependencies. Other categories carry log signals, not span data, and are skipped |
| Spans arrive with empty inputs/outputs | Enable Log conversation details in Copilot Studio (Settings > Advanced > Application Insights). Without it, message text is not logged, so BotMessageReceived / BotMessageSend spans have no content |
| Too many empty orchestration spans | Topic and root spans are dropped by default. If you set COPILOT_STUDIO_ADAPTER_KEEP_TOPIC_SPANS=1, unset it to hide them again |
| Event Hub trigger not firing | Verify EventHubConnection, EVENT_HUB_NAME, and the consumer group, and that the diagnostic setting streams to that hub |
Related
n8n Integration
Forward workflow executions to HoneyHive from an external shipper
Microsoft Semantic Kernel
Instrument code-first Semantic Kernel agents
Tracing Introduction
Sessions, event types, and trace hierarchy
Enrich Your Traces
Add metadata, user properties, and feedback