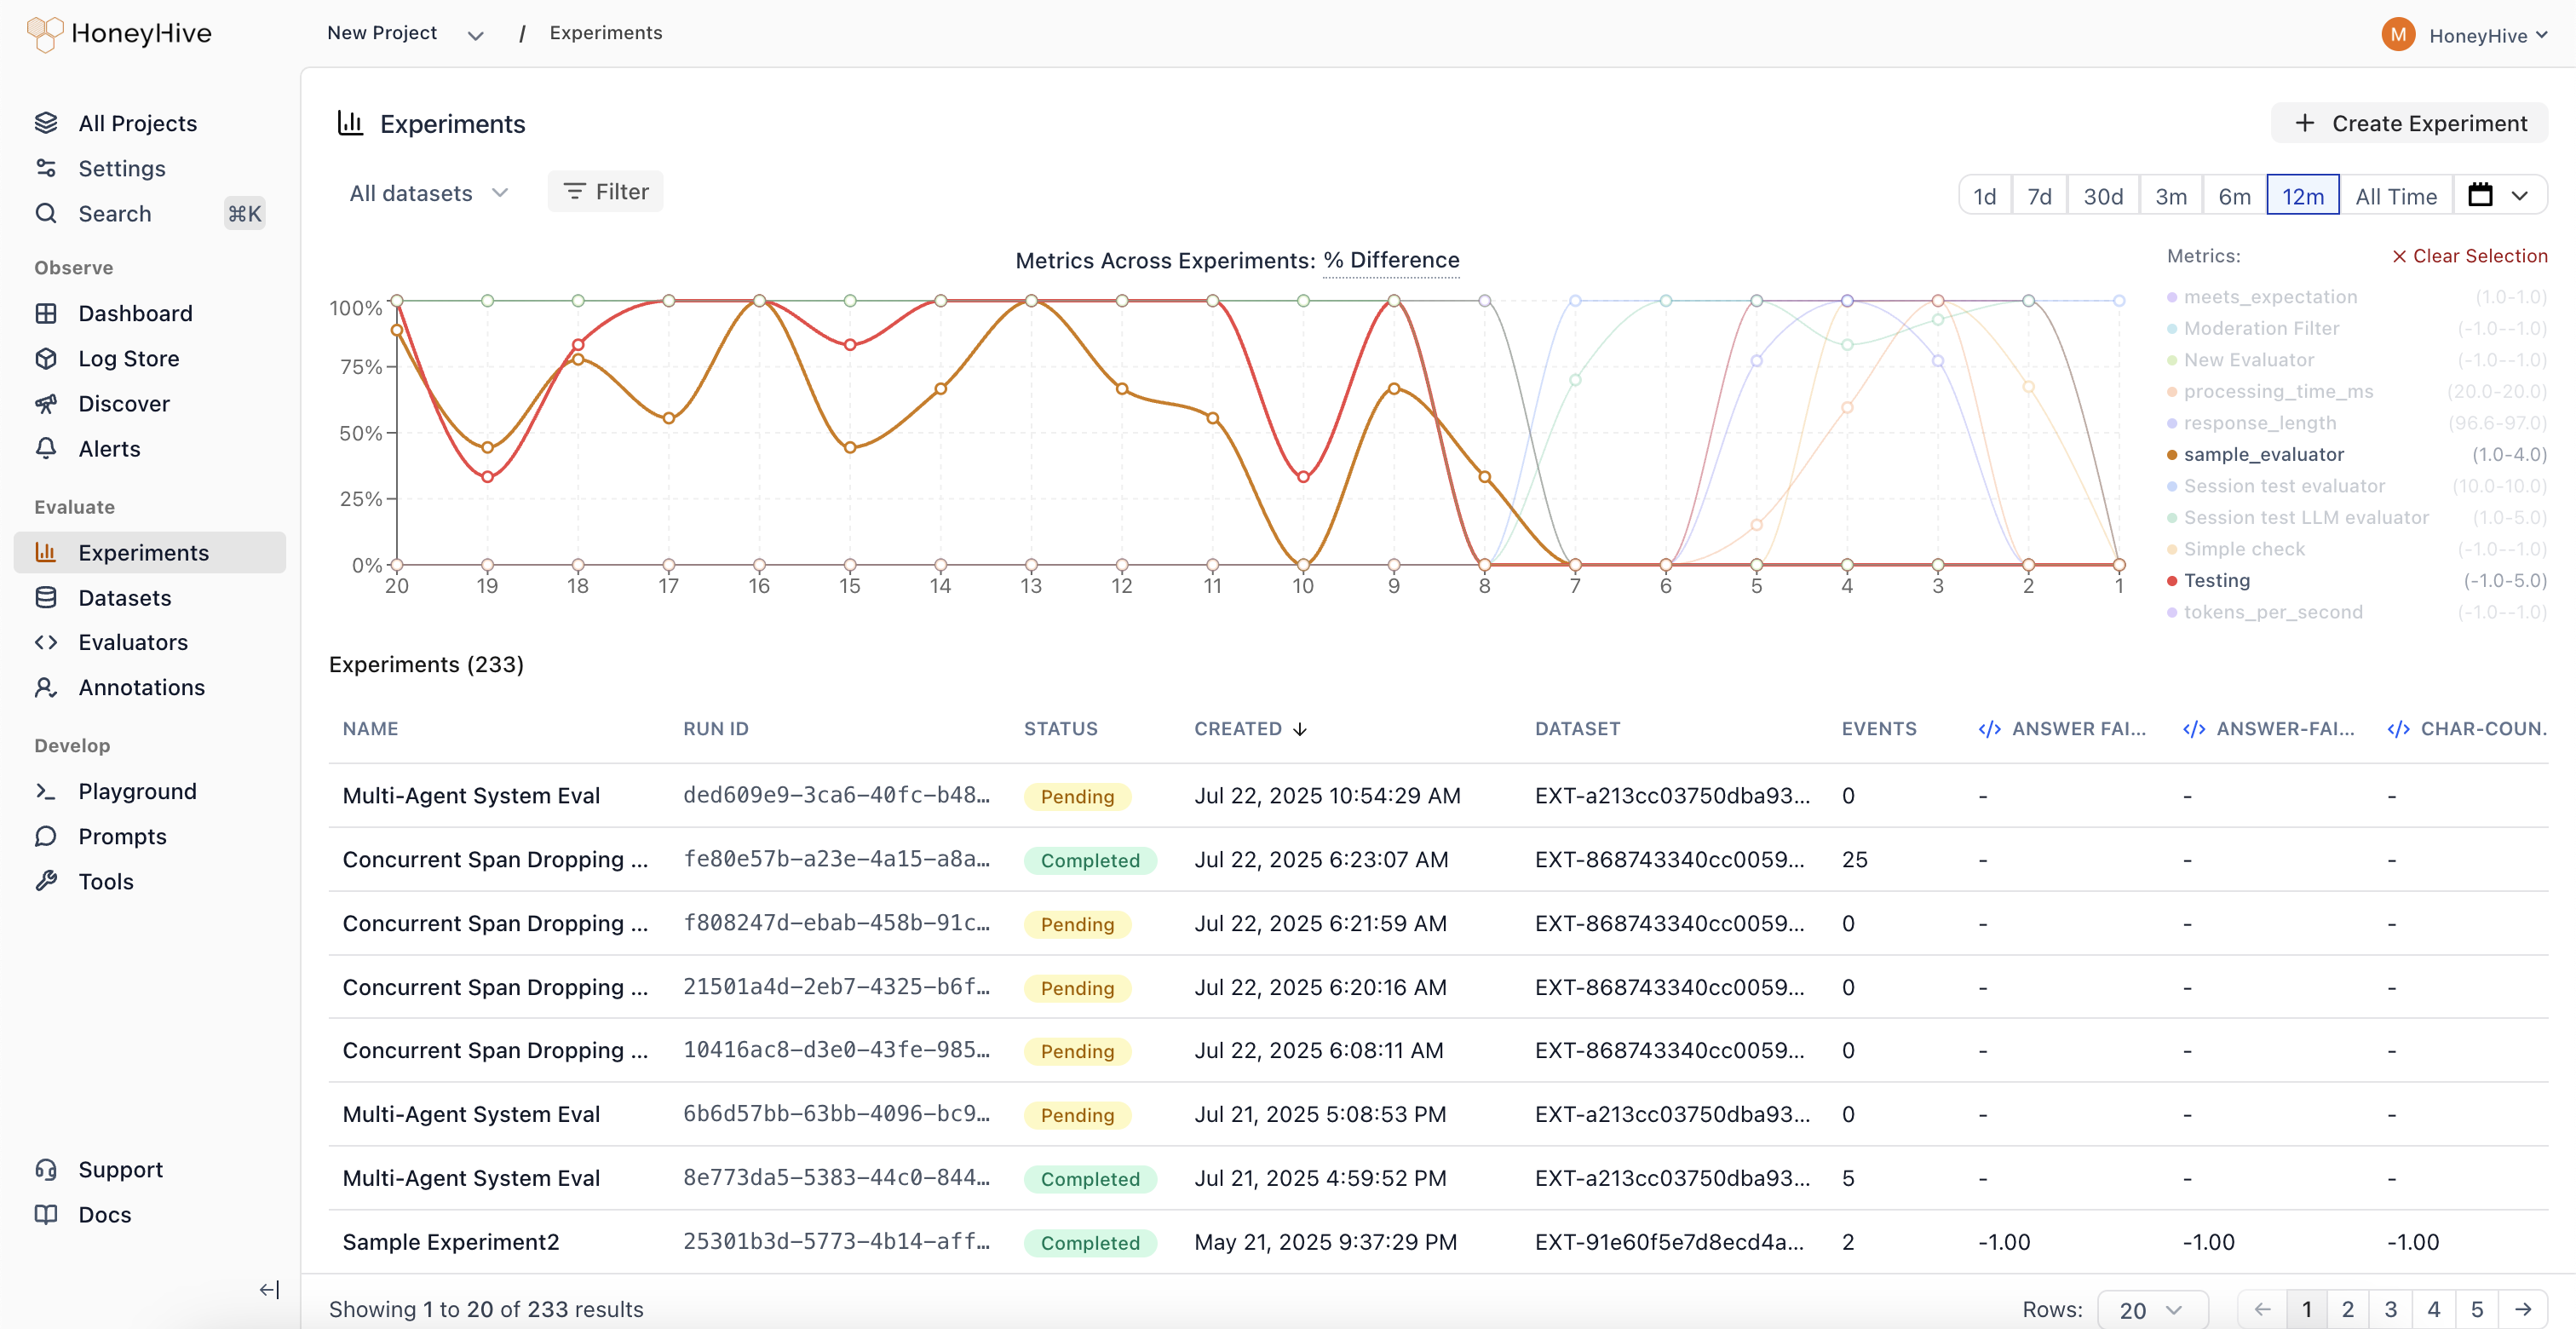
Experiments in HoneyHive help you systematically test and improve your AI applications. Whether you’re iterating on prompts, comparing models, or optimizing your RAG pipeline, experiments provide a structured way to measure improvements and ensure reliability.Documentation Index
Fetch the complete documentation index at: https://docs.honeyhive.ai/llms.txt
Use this file to discover all available pages before exploring further.

What is an experiment?
An experiment in HoneyHive consists of three core components:- Application Logic: The core function you want to evaluate - this could be different models, prompts, retrieval strategies, or an end-to-end agent you want to evaluate.
- Dataset: A dataset of inputs (and optionally target outputs) you’re evaluating against. Using consistent test cases ensures you can reliably compare different versions of your application as you iterate.
- Evaluators: The metrics and criteria you’re measuring. Evaluators help quantify improvements and catch regressions across different versions as you iterate. These can be either automated (i.e. code or LLM evaluators) or performed by a human.
Why run experiments with HoneyHive?
Experiments provide a systematic approach to improving your AI applications:- Iterate with confidence: Test prompt variations, model configurations, and architectural changes against consistent metrics
- Track improvements: Monitor how changes affect key metrics over time and ensure continuous improvement
- Automate quality checks: With GitHub integration, automatically run experiments on code changes and set performance thresholds
- Compare approaches: Evaluate different models, retrieval methods, or chunking strategies using standardized metrics
- Ensure reliability: Catch potential issues by testing across diverse scenarios before deploying to production
How do experiments work?
HoneyHive uses metadata linking to track and organize experiment traces:Trace Metadata and Linking
Every trace in HoneyHive contains metadata that links it to specific experiments and datapoint you’re testing against (i.e.inputs and ground_truths pairs). The run_id in the metadata links related test traces together, while the datapoint_id connects traces that were run on the same test cases / datapoints.
Experiment Structure
-
Experiment-Dataset Relationship
- Each experiment run (identified by
run_id) is linked to a specific dataset - This dataset-run linking enables aggregate comparison across different configurations
- Multiple runs can use the same dataset, allowing you to test different approaches against consistent inputs
- Each experiment run (identified by
-
Trace Comparison
- Traces with the same
datapoint_idrepresent different configurations tested on identical inputs - This enables direct comparison of performance for specific inputs
- Example: Compare how different LLM models handle the same prompt, or how different RAG configurations retrieve for the same query
- Traces with the same
-
Performance Tracking
- Evaluators measure performance metrics for each trace
- Results can be analyzed at both individual trace and aggregate run levels
- Metrics are tracked over time to identify improvements or regressions
Integration with Development Workflow
The experiment framework integrates with GitHub to:- Trigger automated experiment runs on code changes
- Set performance thresholds that must be met
- Track metric improvements across commits
- Alert on performance regressions

