

~/.codex/config.toml and every codex run exports spans directly to your project. No SDK, daemon, or collector is involved. Verified against Codex CLI 0.156.1.
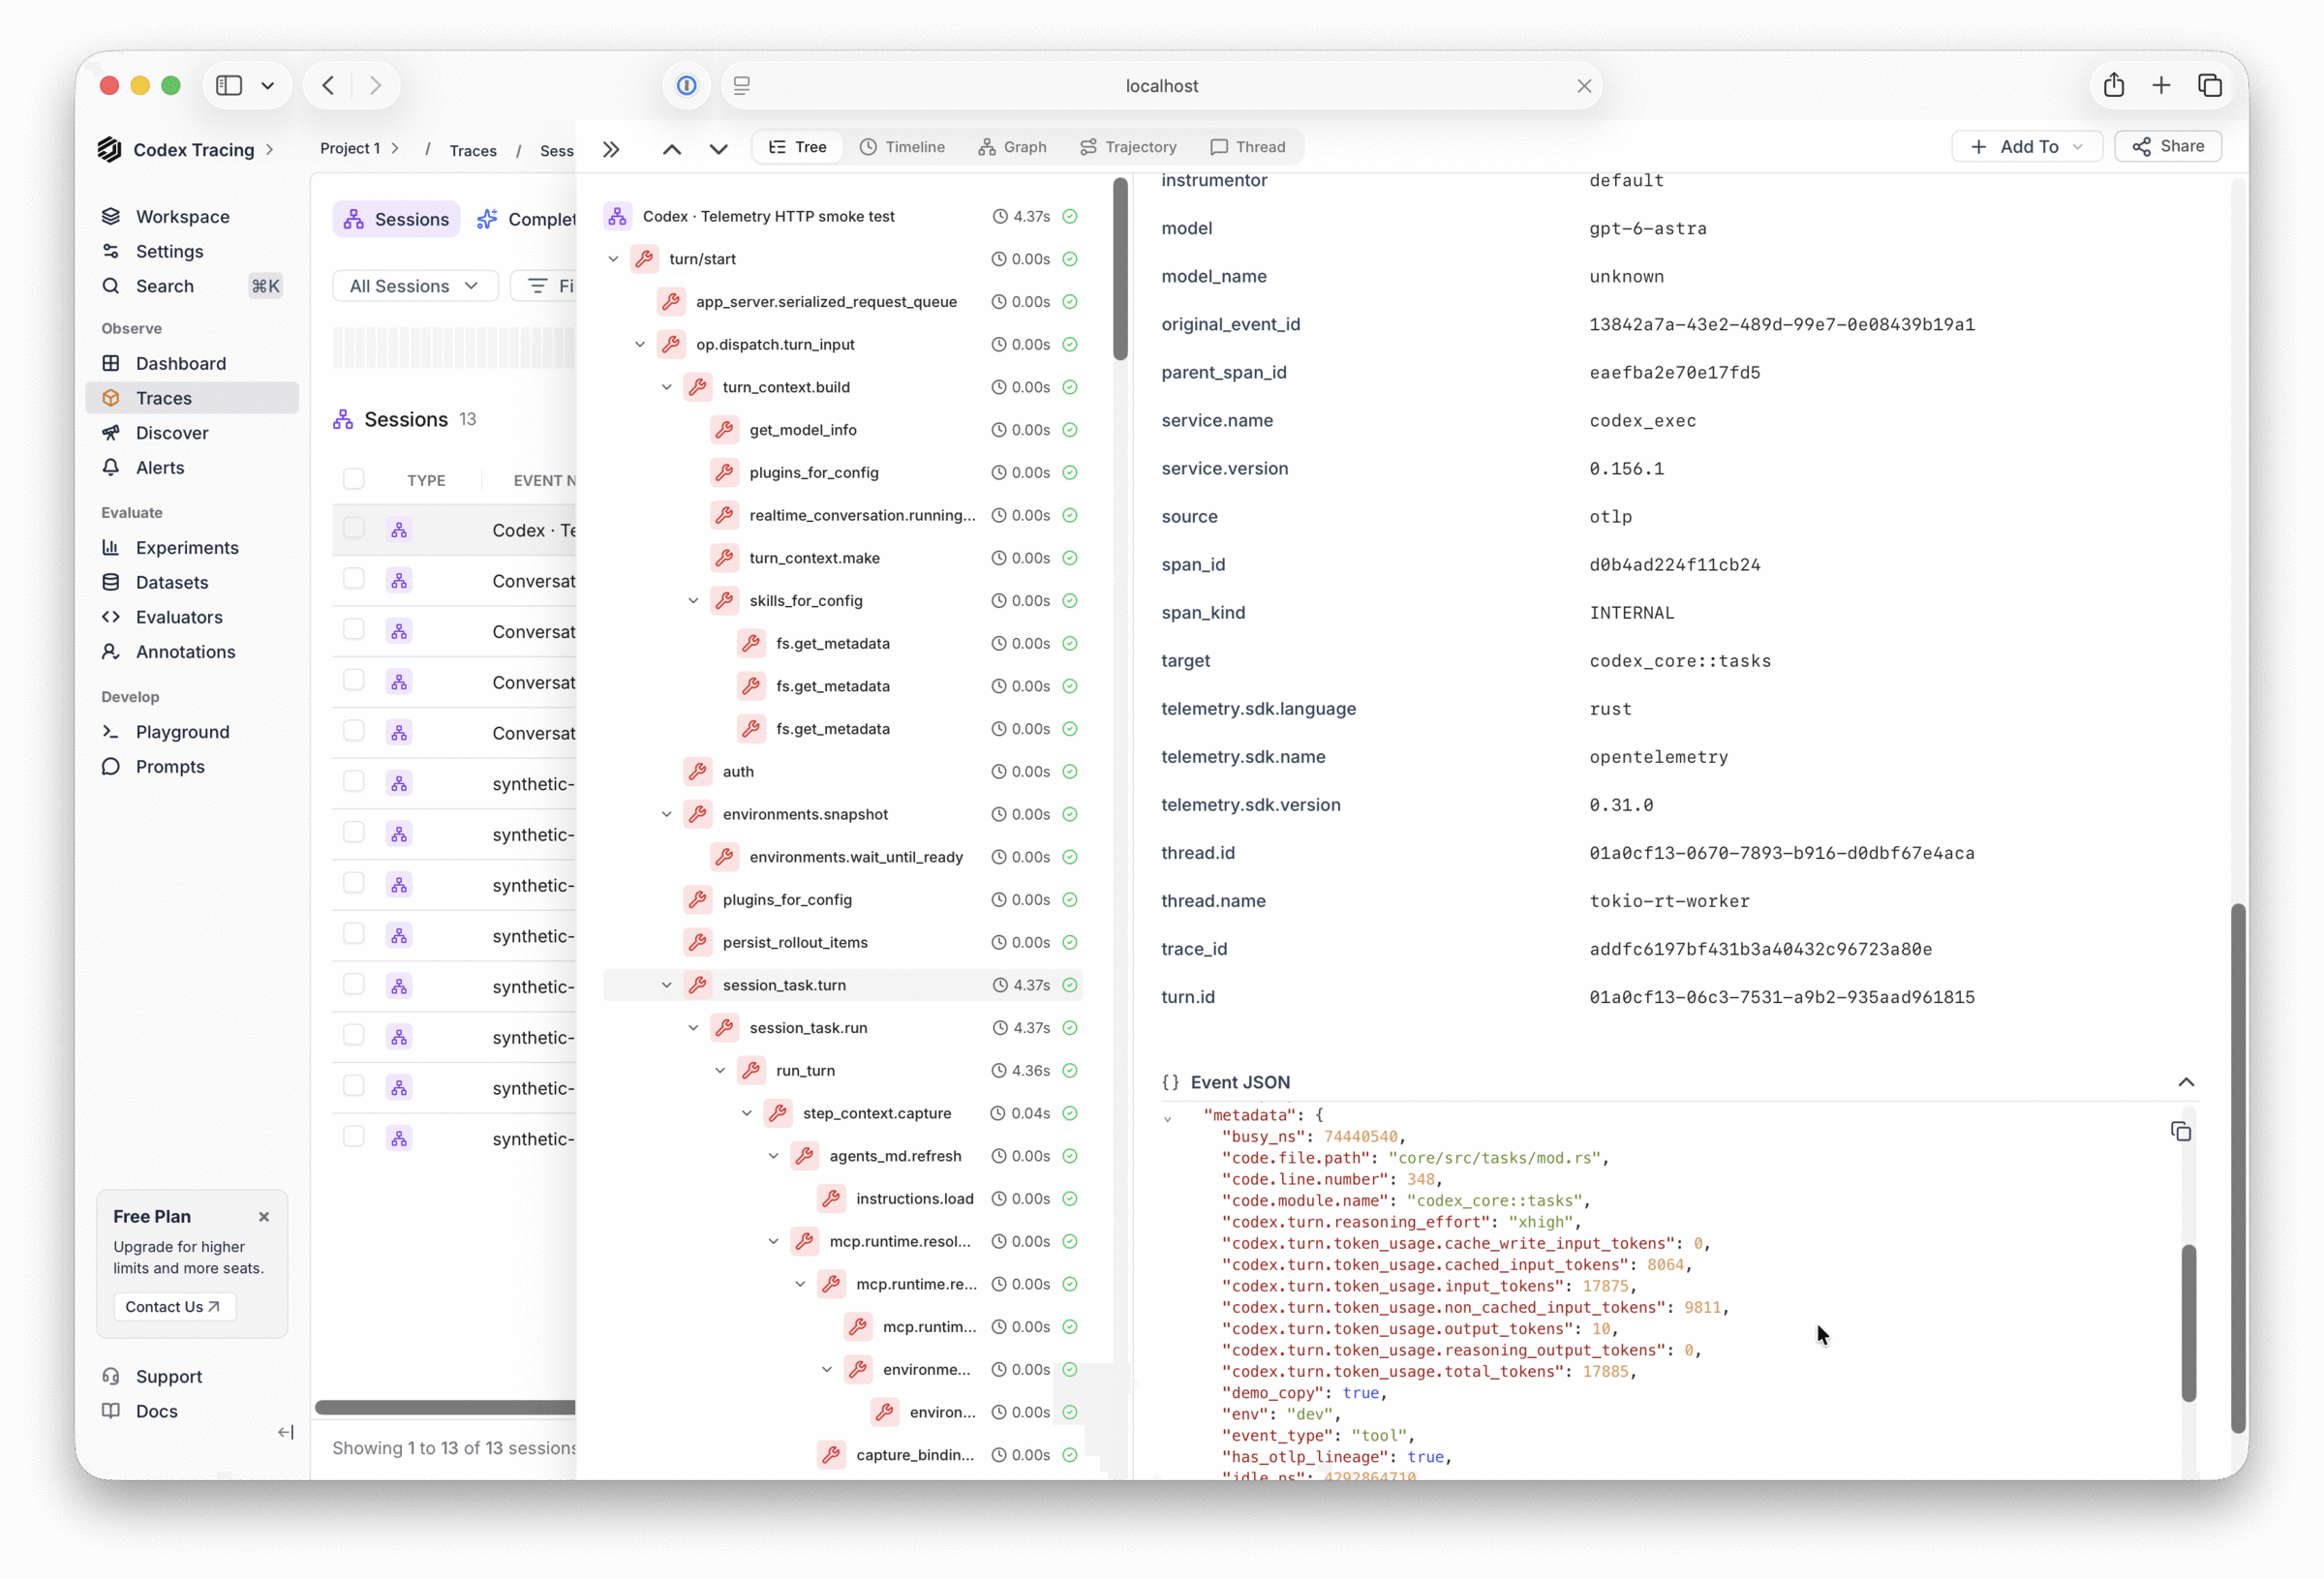
Codex CLI spans in HoneyHive: turn/start span tree with per-turn token usage on session_task.turn
Quick Start
Get an ingestion API key from Settings → Project → API Keys, then add an[otel] table to ~/.codex/config.toml:
api.dp1.us.prod.honeyhive.ai with your data plane host if you are not on US production.
Codex exports its full internal span tree, so volume is high: one short
codex exec run produced roughly 780 events, most of them runtime plumbing. The [otel] table has no span filtering or sampling option. Consider this before enabling it on a shared or high-traffic setup.Codex reads
[otel] header values literally and does not expand environment variables in them, so the ingestion key is stored in plaintext in config.toml. Keep ~/.codex/config.toml out of version control.Configuration reference
See OpenAI’s observability and telemetry reference for every
[otel] option.
How it works
- Codex’s trace exporter is wired to its internal Rust
tracingspans, so HoneyHive receives the runtime’s own span tree rather than a curated agent transcript - Each span becomes one HoneyHive event with
event_type: tool; a single shortcodex execrun produced 780 events across roughly 20 trace IDs metadata.trace_idandparent_idpreserve the span hierarchy, so the tree view underturn/startis intact- Token usage arrives as
gen_ai.usage.*attributes onhandle_responsesspans and ascodex.turn.token_usage.*onsession_task.turnspans - Resource attributes (
service.name = codex_exec,service.version,env) land inmetadataon every event - Prompt and completion text is emitted by Codex as OTLP log records, not spans, so it is not part of the trace export
What Gets Traced
- Run and turn lifecycle -
codex.execmarks the invocation,turn/startis the root of each turn’s tree, withsession_task.turn,run_turn, andrun_sampling_requestbeneath it - Model requests -
handle_responsesspans (one per Responses API stream) with input, output, cached, and reasoning token counts, the model name, and reasoning effort - Tool executions -
exec_command,unified_exec.exec_command, andcode_mode.handler.executespans withtool_name,call_id, andoutcome - Runtime internals -
fs.get_metadata,append_items,persist_rollout_items,auth, and similar plumbing spans that make up most of the volume - Durations -
duration(ms) on every event, plusbusy_nsandidle_ns
session_id and a run is not shown as one session. Support for OTLP /v1/logs and /v1/metrics is planned for an upcoming release. Logs will add Codex’s codex.user_prompt, codex.sse_event, and codex.tool_result records, which carry prompt and completion content and per-response token counts; metrics will add Codex’s request and token counters.
Events
Representative events from onecodex exec run. All are event_type: tool.
Every event also carries
metadata.trace_id, metadata.span_id, metadata.parent_span_id, metadata.service.name = codex_exec, and metadata.instrumentor.
Verify the integration
Run a short task, then open the project’s Traces view in the HoneyHive UI and filter onevent_name = codex.exec:
HH_PROJECT_API_KEY), not the ingestion key configured above. See API keys.
codex.exec event per run confirms export. Filter on metadata.service.name = codex_exec to see every Codex event, on event_name = turn/start to find the root of each turn’s tree, or on metadata.conversation.id to narrow to one Codex thread.
Troubleshooting
If events aren’t showing up in HoneyHive, work through these checks in order:1
Check the endpoint path
Codex sends to the URL exactly as written. Confirm
endpoint ends in /opentelemetry/v1/traces.2
Check the header
The key must be inside
headers as "Authorization" = "Bearer <key>". Confirm it is an ingestion key for the intended project and that the host matches that project’s region.3
Use codex exec for the first test
The exporter flushes on process exit. A non-interactive
codex exec "..." run ends cleanly and flushes every span; an interactive session that is still open has not flushed yet.4
Inspect the raw export
Point
endpoint at a plain HTTP listener on http://127.0.0.1:<port>/opentelemetry/v1/traces and capture the application/x-protobuf requests. Self-signed HTTPS listeners were not accepted by Codex in our testing; this does not affect remote HTTPS endpoints with valid certificates.5
HTTP 500 with 'request must contain at least one ResourceSpans entry'
HoneyHive received an OTLP request with no spans. This is not a Codex issue, and it confirms the endpoint and key are reachable.
6
Events show inputs and outputs as {} or are not grouped into a session
Expected with the trace exporter alone, not a misconfiguration. See What Gets Traced.
metadata.trace_id groups one span tree; a run spans roughly 20 trace IDs and no single attribute is present on every span of a run, so filter on event_name = turn/start to find each turn’s tree.