How it works
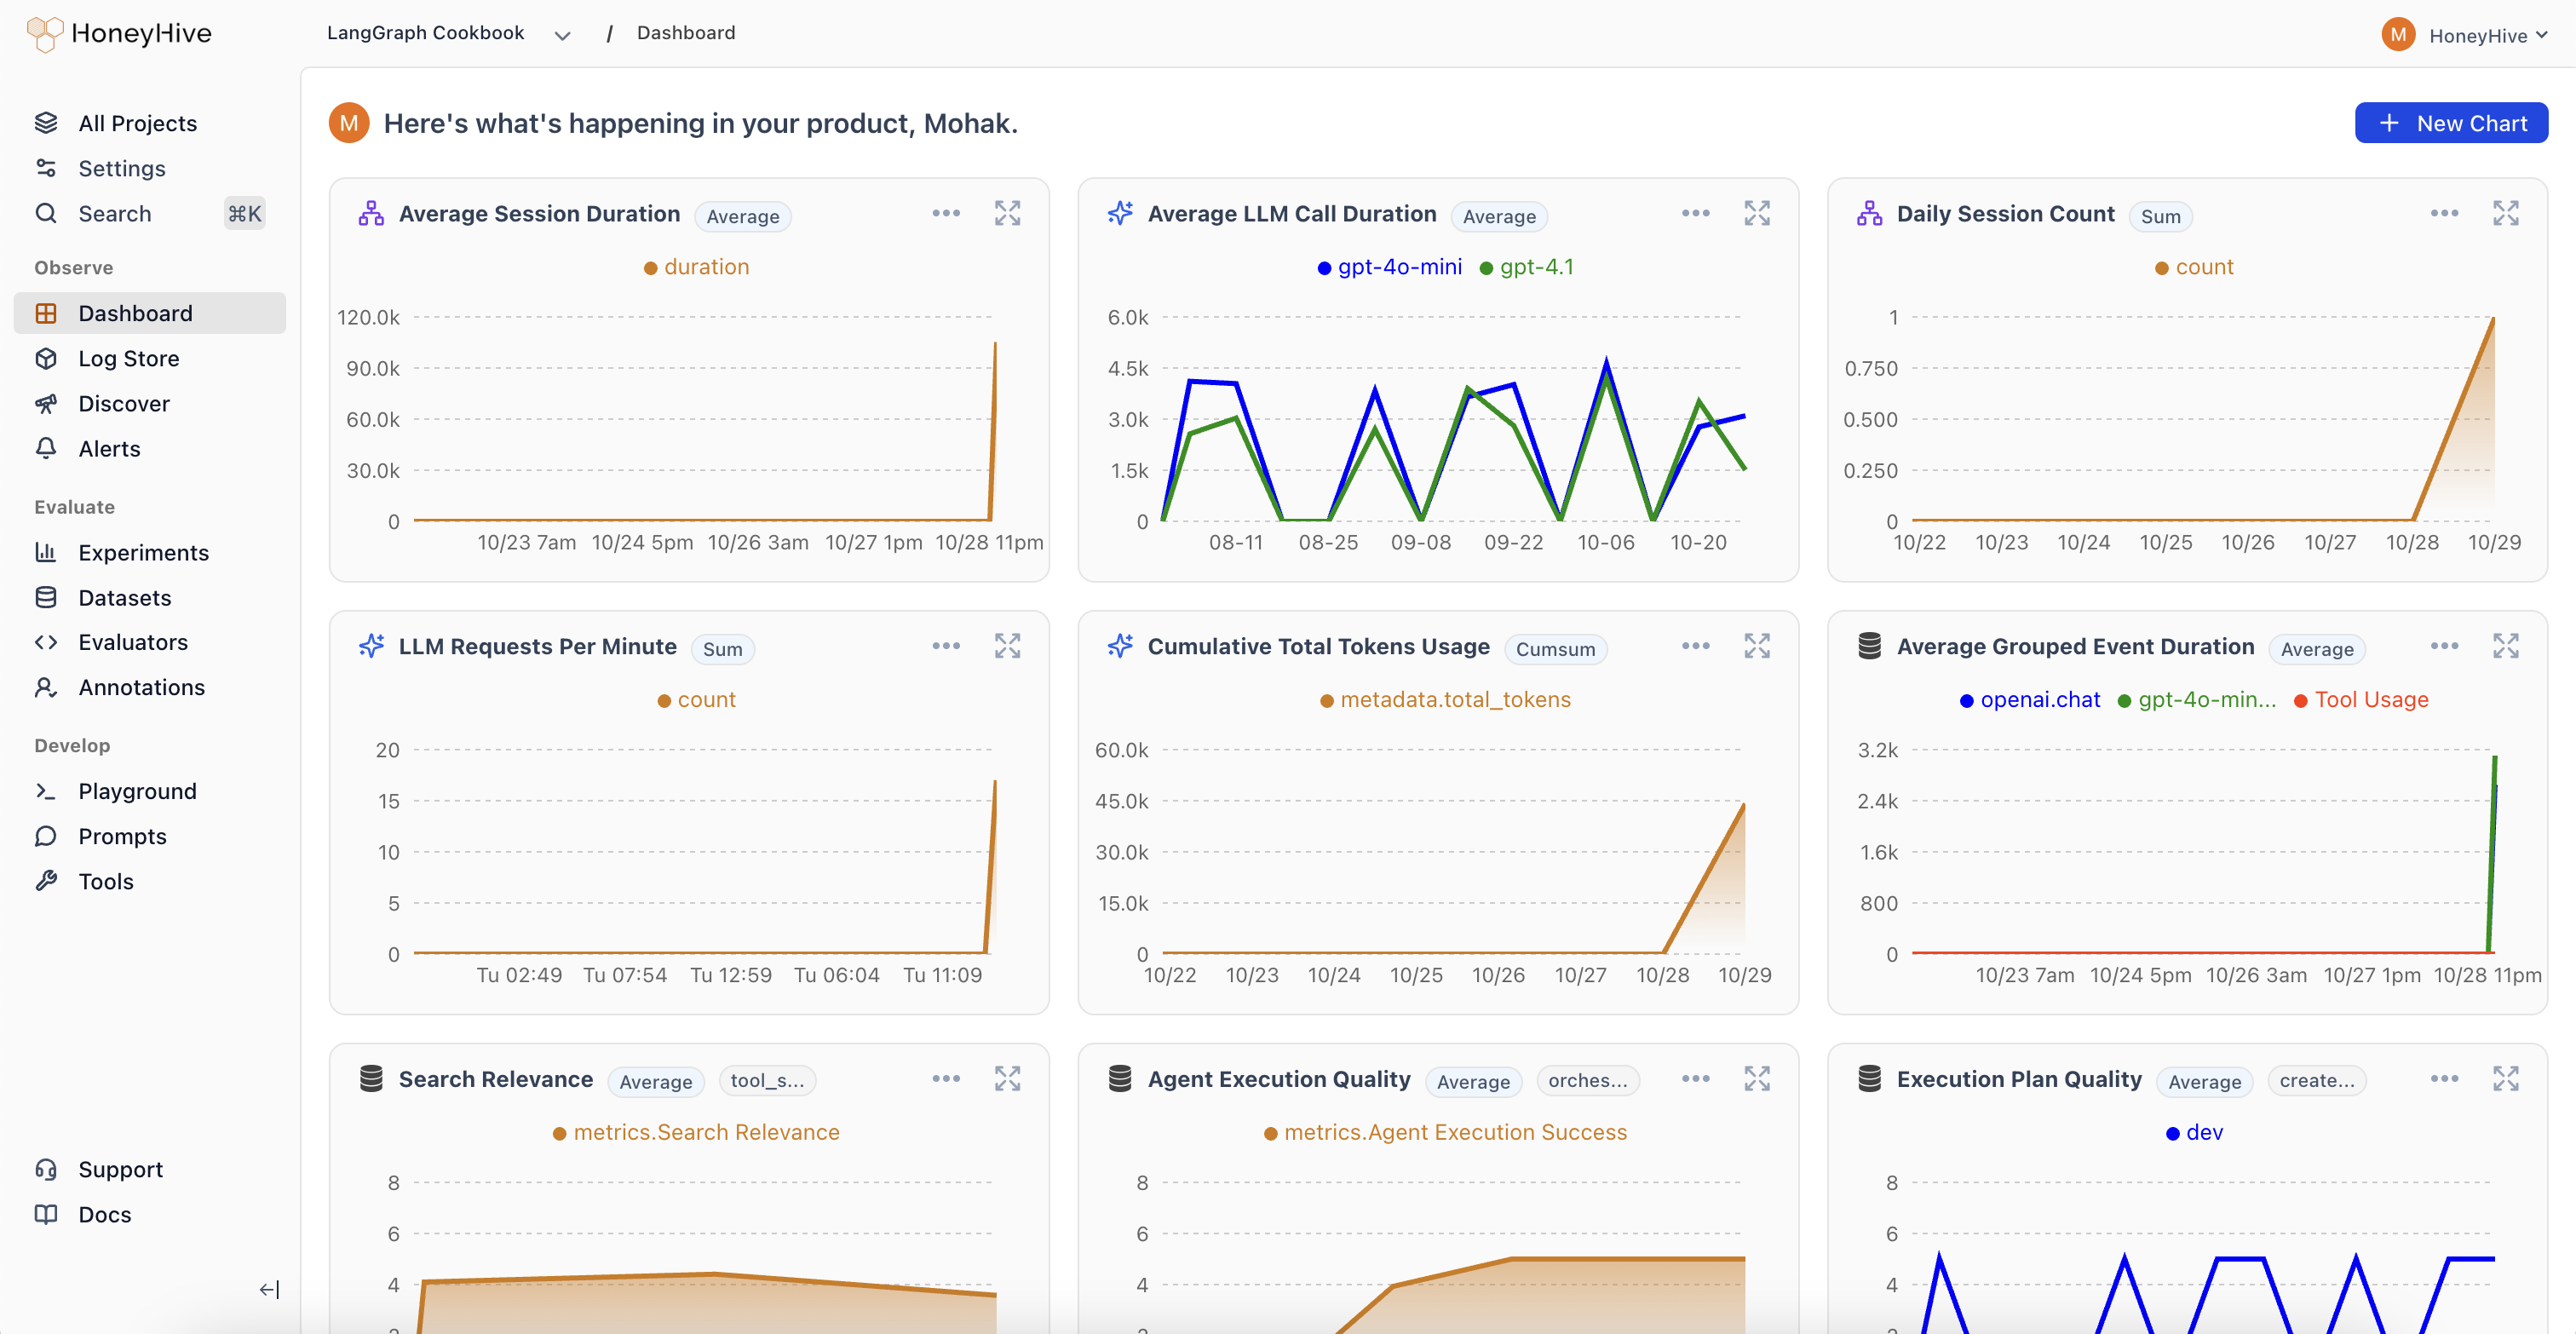
HoneyHive aggregates all your production data (traces, evaluations, and user feedback) in one place. This unified view lets you:- Detect Failures: Catch anomalies across your cost, usage, and quality metrics.
- Set Up Proactive Monitoring: Create automated alerts to notify you when metrics exceed thresholds or drift from expected values.
- Form Hypotheses: “I think response quality drops for after 5 agent actions.” “Our new RAG might be causing unintended hallucinations.”
- Explore Your Data: Craft queries to validate or refute these hypotheses in real-time.
- Iterate Continuously: Use insights to tweak prompts, swap models, or refine pipelines, then immediately see the impact.