How It Works
When you enable online evaluation for an evaluator, HoneyHive runs it asynchronously on incoming production traces:- Your application sends traces to HoneyHive
- HoneyHive matches traces against your evaluator’s event filters
- Matching events are evaluated (subject to your sampling rate)
- Results appear as metrics in your dashboard and on individual traces
Online evaluations only run on production traces (where
source is not evaluation or playground). Experiment traces are always evaluated at 100%.Enabling Online Evaluation
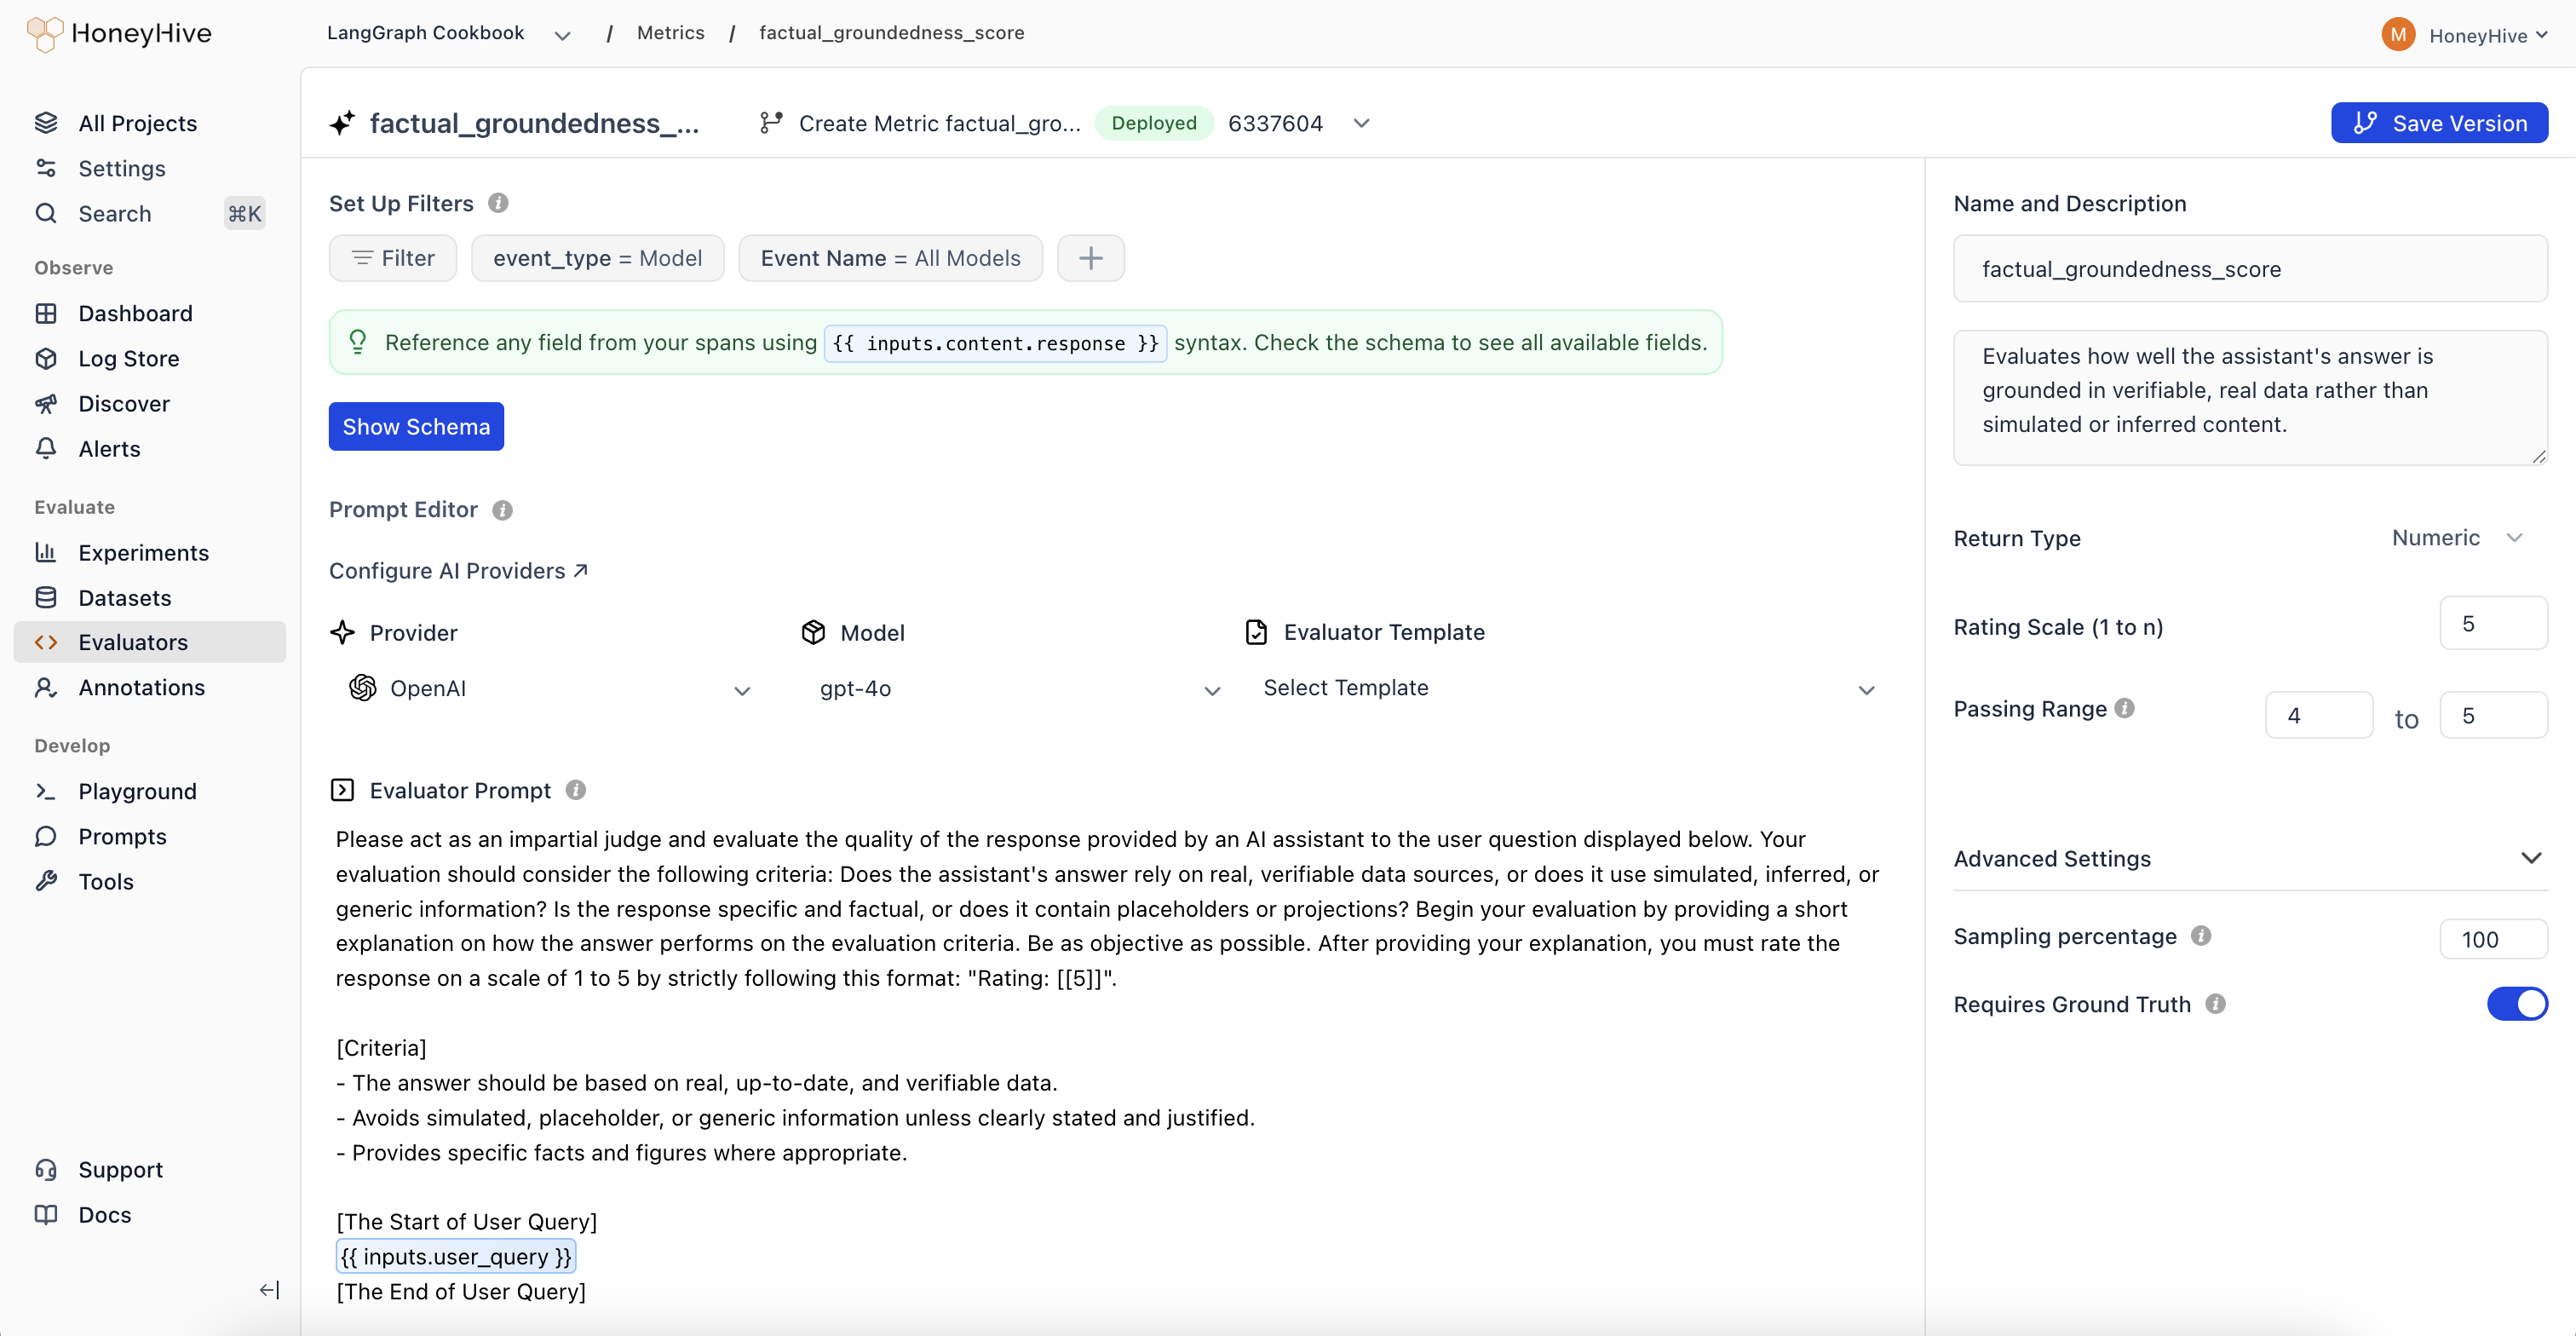
You can enable online evaluation on any server-side evaluator (Python or LLM):Go to the Evaluators page
Navigate to the Evaluators tab in HoneyHive.
Enable the evaluator
Toggle the Enabled switch in the evaluators table. This tells HoneyHive to run this evaluator on matching production traces.
Event Filters
Each evaluator has event filters that determine which traces it runs on:- Event type: Filter by
model,tool,chain, orsession - Event name: Target a specific named event, or use “All” to match any event of that type
model events named generate_response, while running a tone evaluator on the full session.
Sampling
LLM-based evaluators incur model costs for every evaluation. At production scale, use sampling to control spend:| Volume | Suggested Sampling | Rationale |
|---|---|---|
| < 1K events/day | 100% | Full coverage is affordable |
| 1K - 10K events/day | 25 - 50% | Good signal with moderate cost |
| 10K+ events/day | 5 - 25% | Statistical significance with controlled spend |
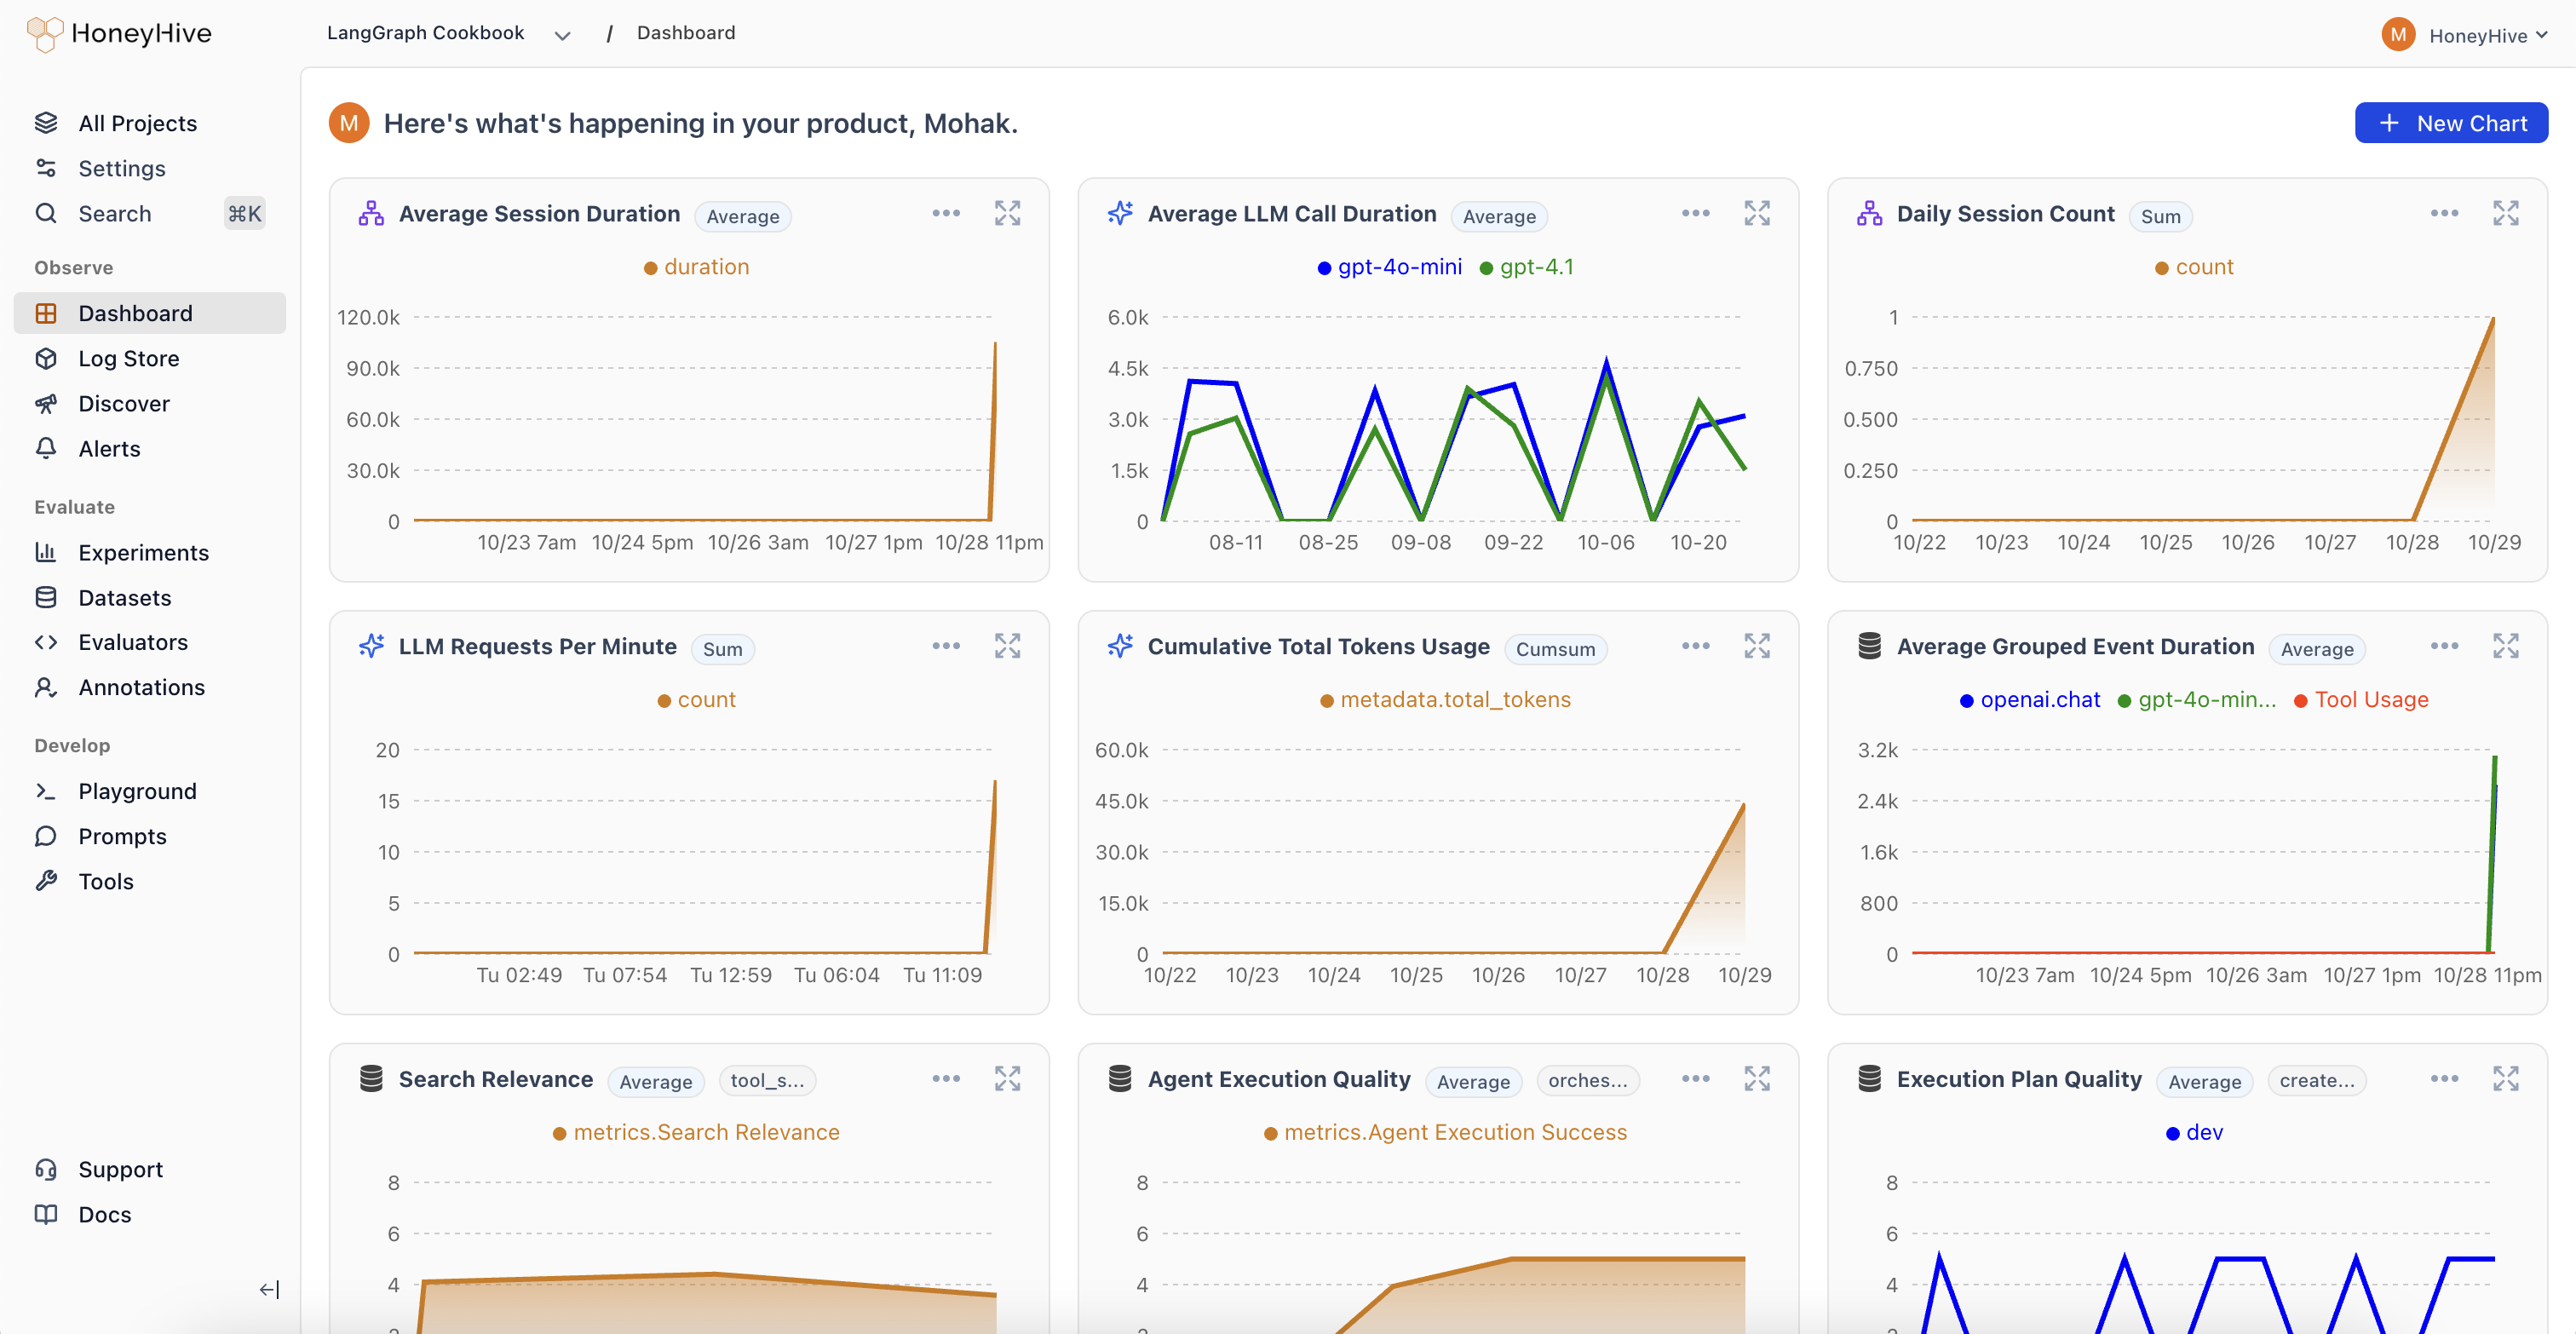
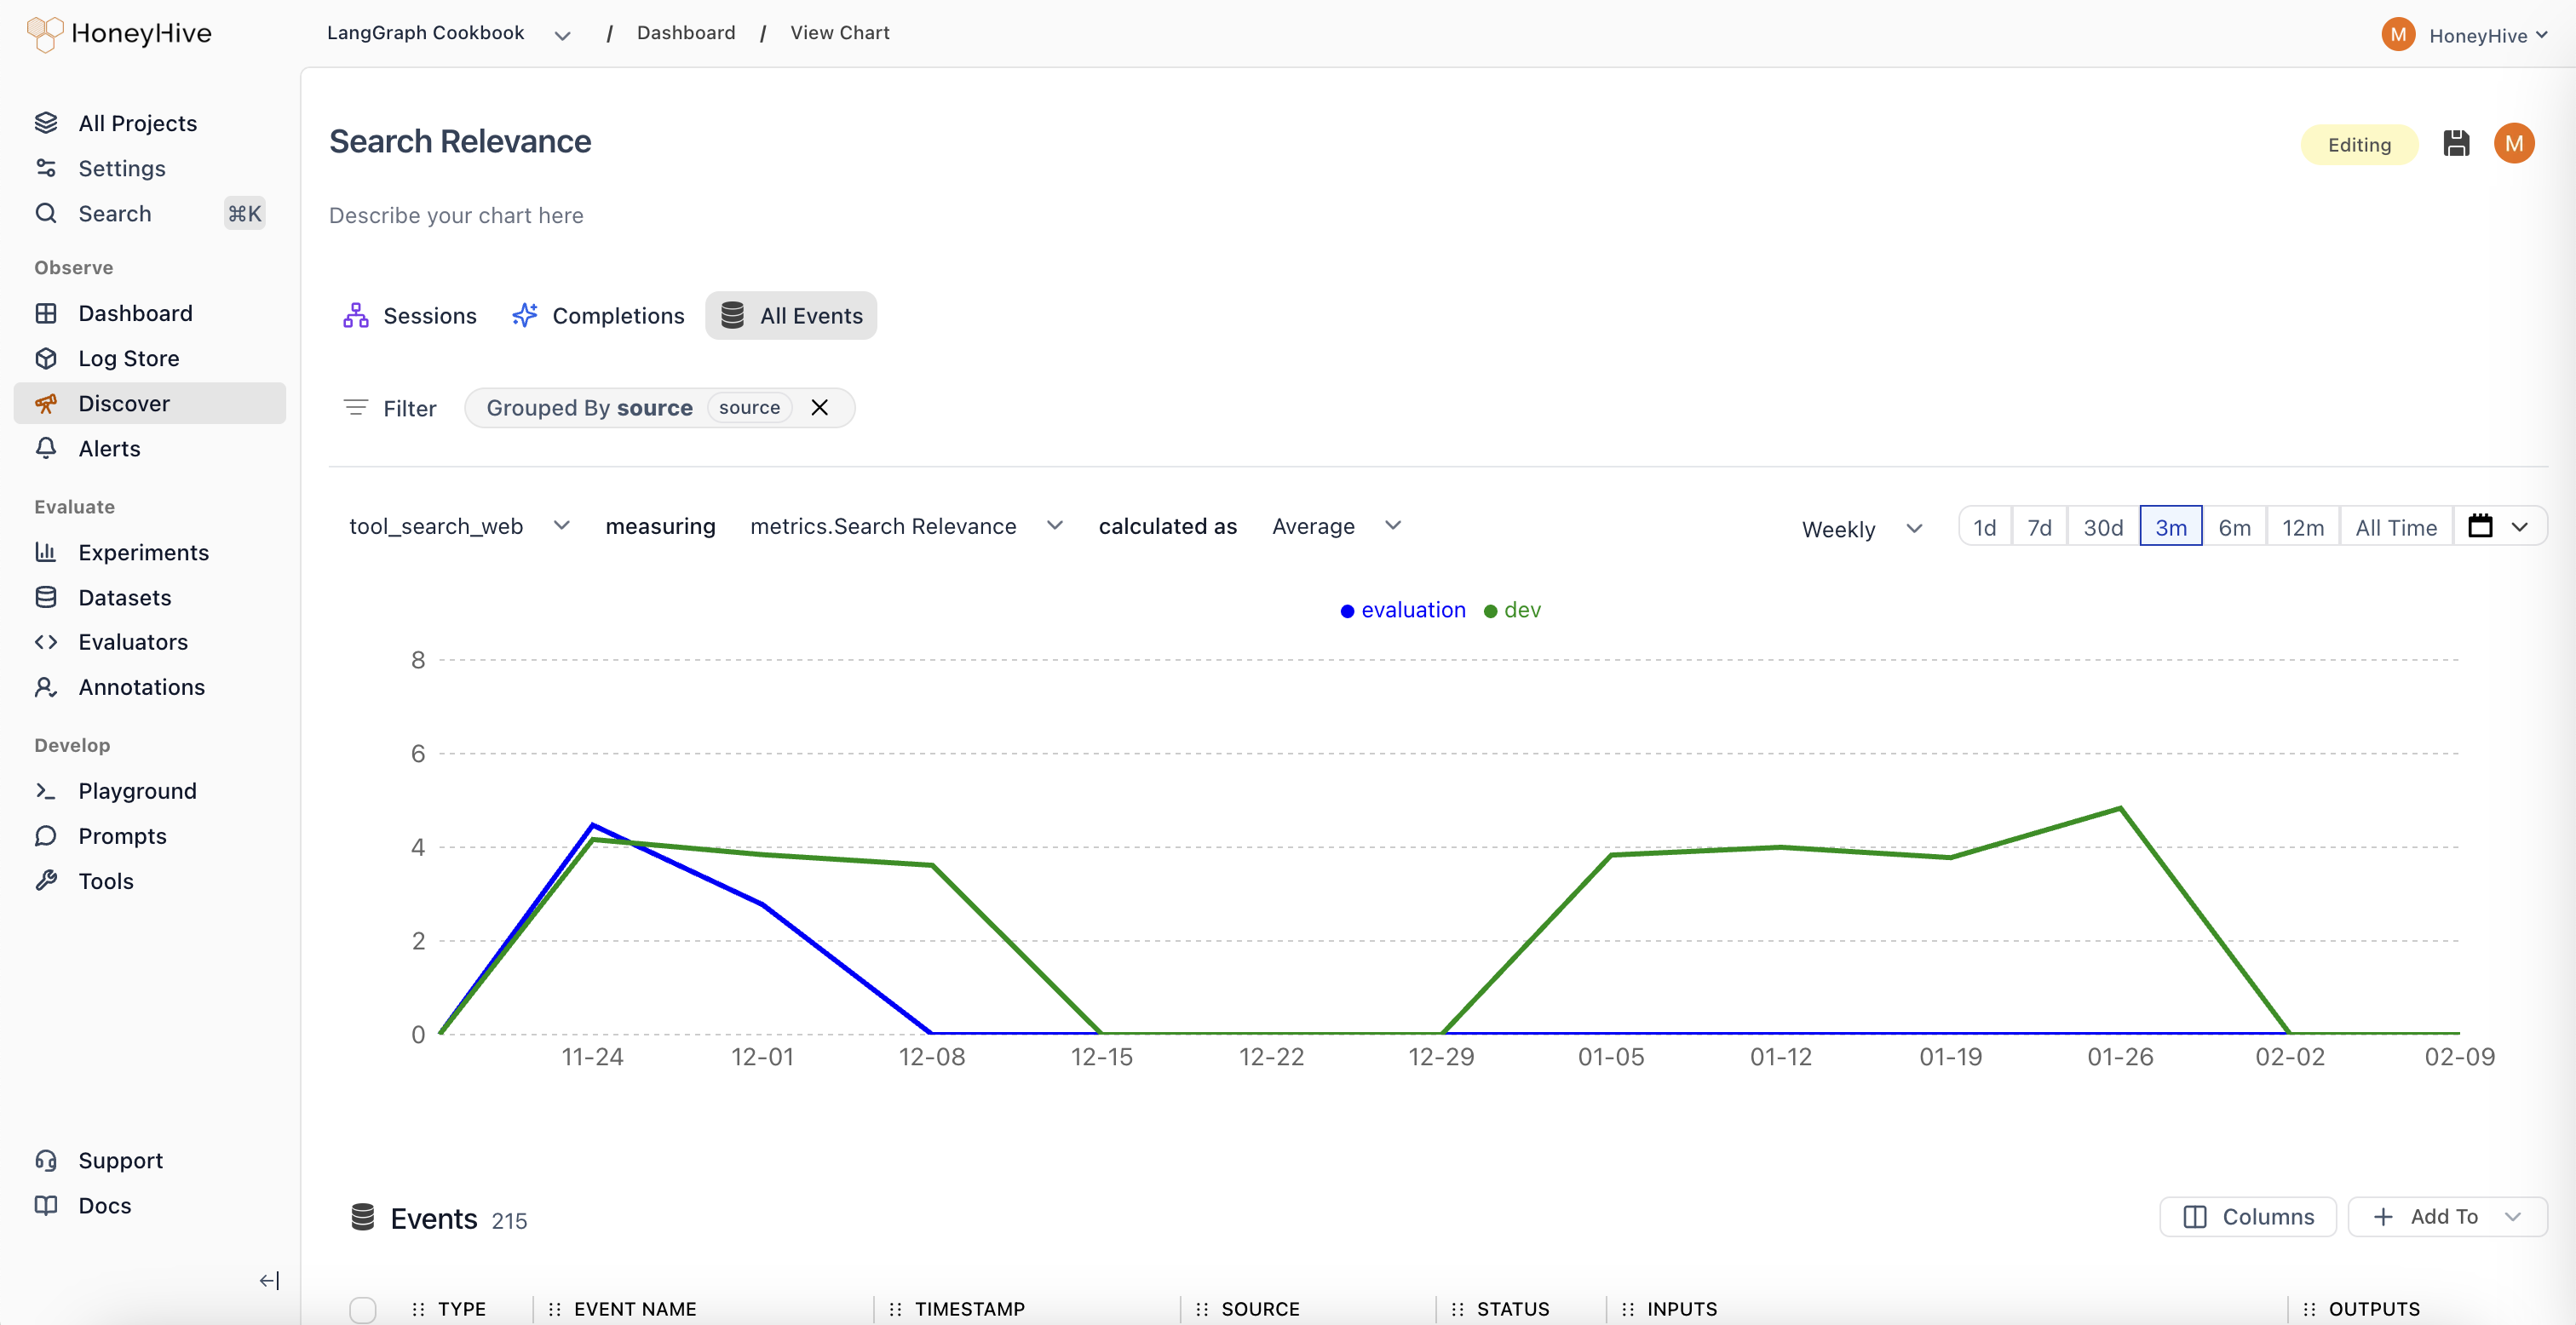
Viewing Results
Online evaluation results are available in two places:- Dashboard charts: Select your evaluator as a metric in Custom Charts to track quality over time, group by properties, and set up alerts
- Individual traces: Each evaluated trace shows its evaluator scores alongside inputs, outputs, and other metadata
Choosing Between Client-Side and Server-Side
| Client-Side | Server-Side (Online) | |
|---|---|---|
| Runs | In your application | On HoneyHive after ingestion |
| Latency impact | Adds to request time | None |
| Best for | Guardrails, format checks, PII detection | LLM-as-judge, complex quality scoring |
| Managed in | Your code | HoneyHive UI |