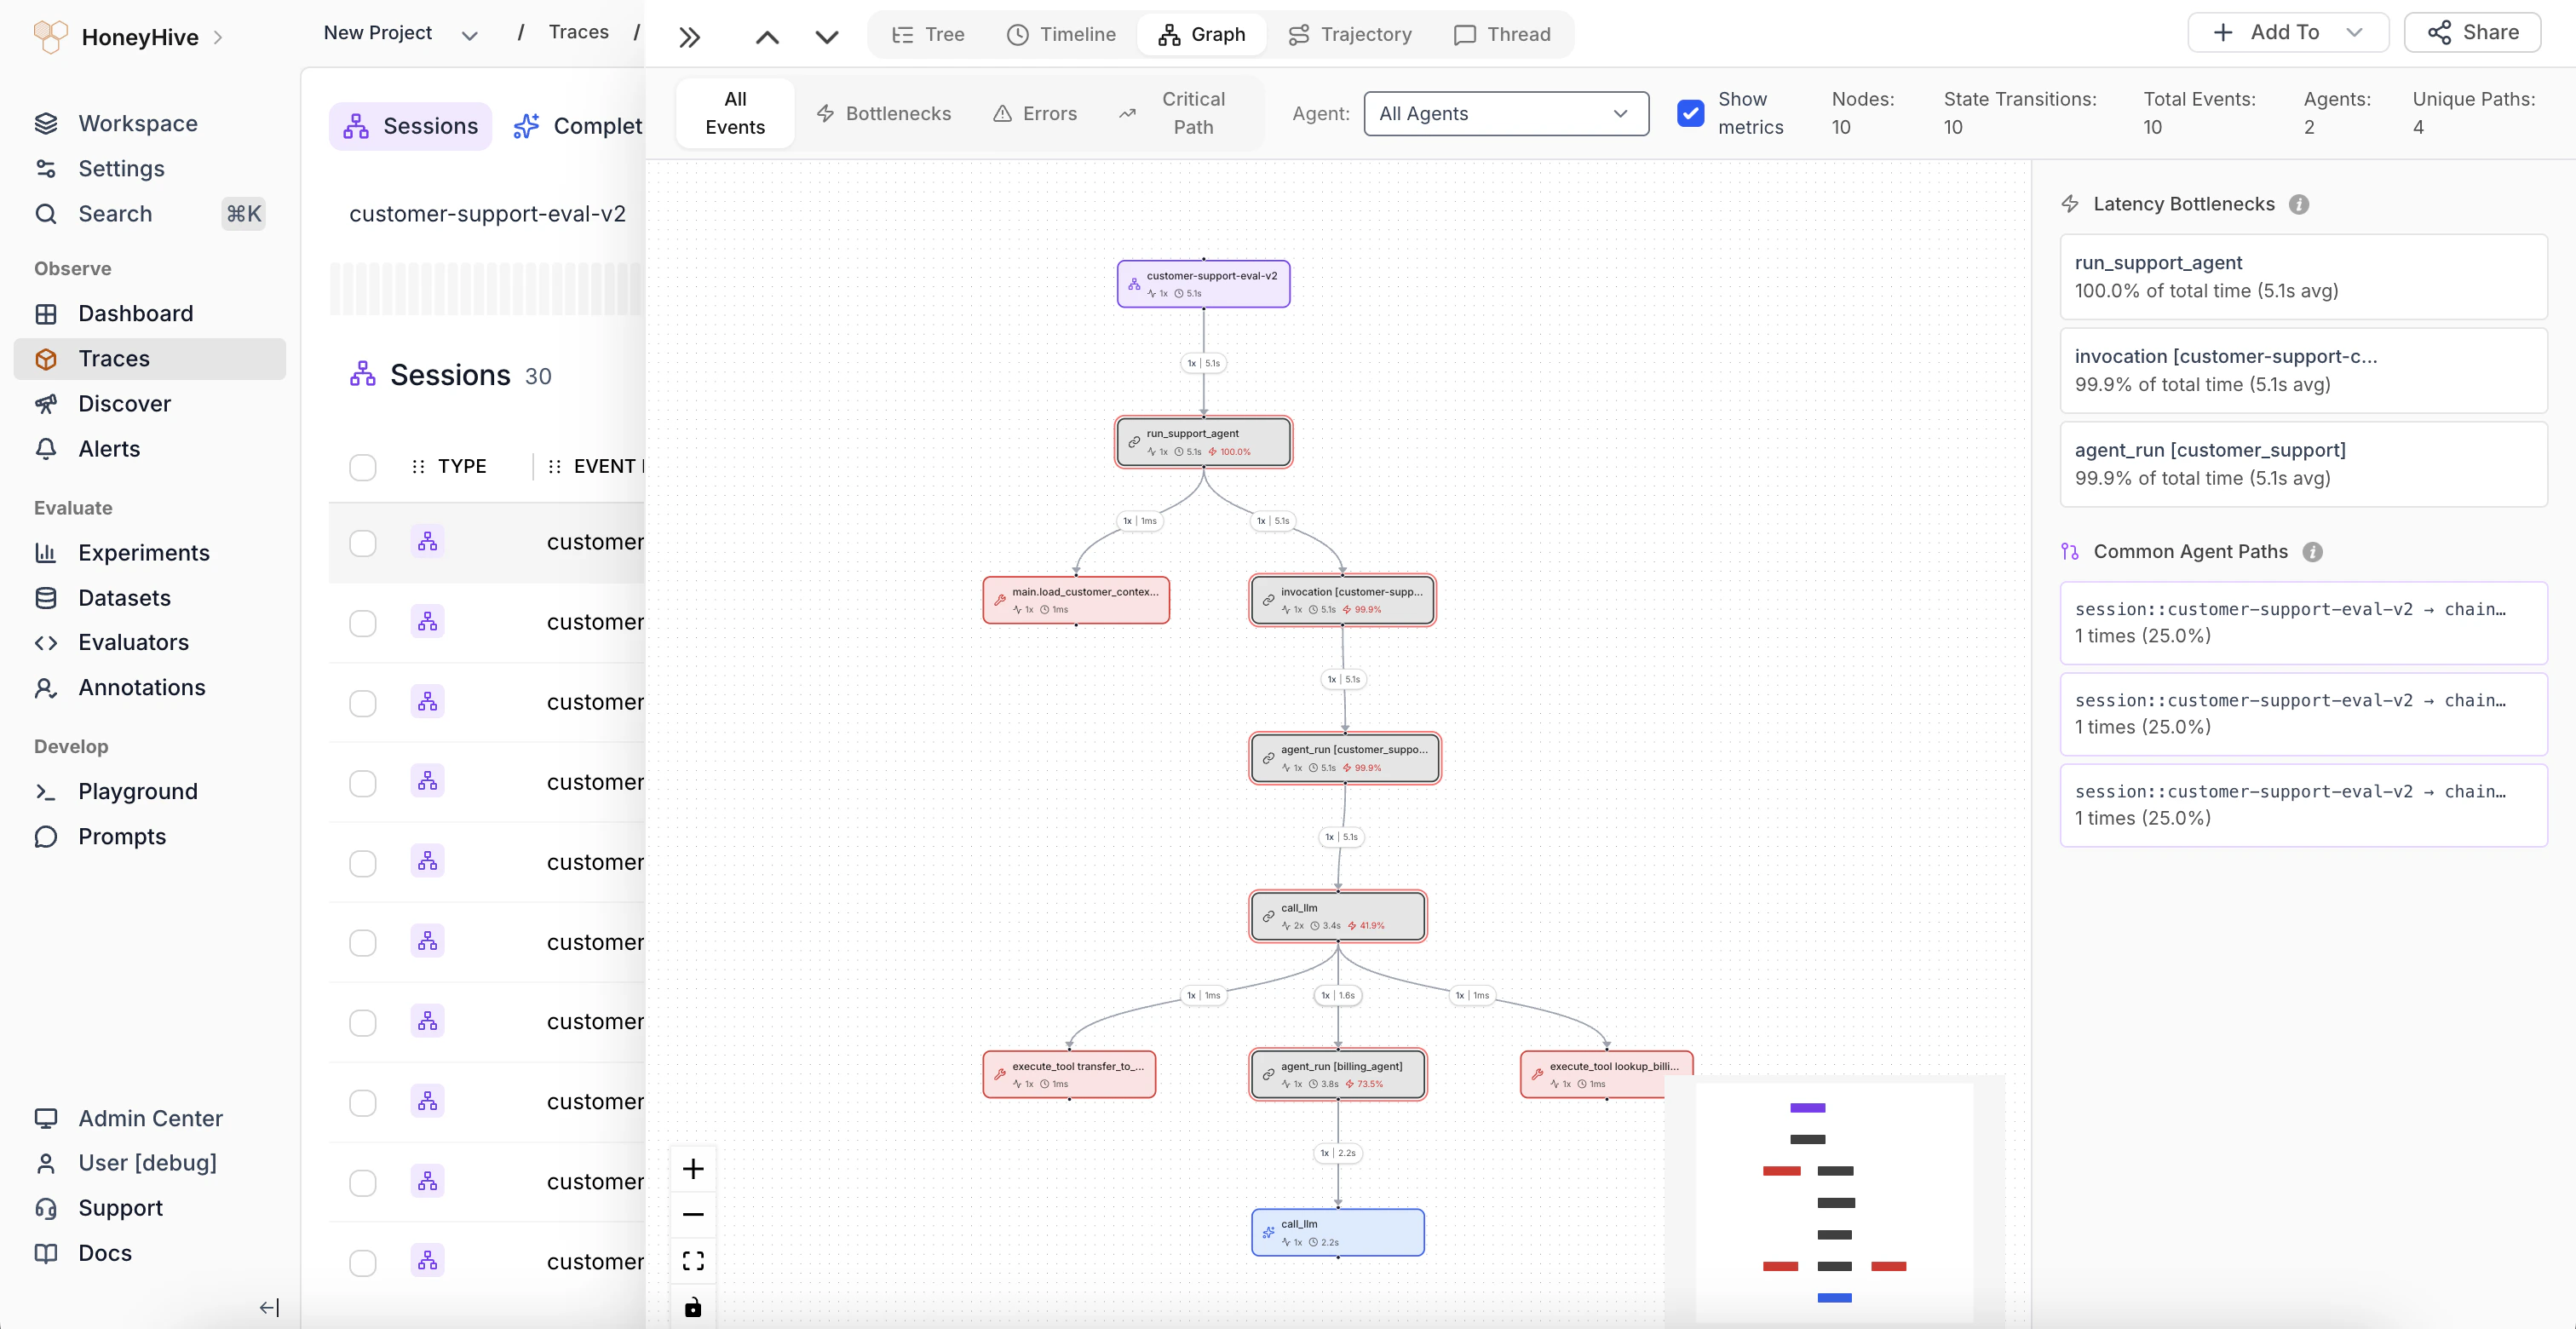
Graph view showing execution flow with nodes, edges, latency bottlenecks, and common agent paths
Reading the graph
- Nodes represent spans, colored by event type (model, tool, chain)
- Edges show parent-child relationships with labels indicating call count and duration
- Node labels include the span name, call count, average duration, and percentage of total time
Toolbar filters
The toolbar above the graph provides several filters:- All Events - show all spans
- Bottlenecks - highlight the slowest spans
- Errors - show only spans that failed
- Critical Path - highlight the longest sequential chain of spans
- Agent dropdown - filter by agent when the trace involves multiple agents
- Show metrics toggle - display or hide duration and percentage annotations on nodes
Latency Bottlenecks panel
The right sidebar lists the top spans by percentage of total trace time. Use this to quickly identify which operations consume the most time without scanning the full graph.Common Agent Paths
Below the bottlenecks, the Common Agent Paths section shows the most frequent execution paths through the trace. Each path displays the sequence of spans and how many times that path was observed. This is useful for understanding typical agent routing behavior.When to use
Use the Graph view to:- Understand the overall architecture of a trace at a glance
- Identify which agent paths are most common in multi-agent systems
- Find latency bottlenecks across the entire execution flow
- See how different spans connect and interact